9811 Walnut St #201 · Dallas, TX
Flood risk 1/10 · Minimal
- FEMA flood zone
- X (unshaded)
- Chance of flooding over 30 yrs
- 0.0%
- Est. flood insurance / yr
- $507 – $1,088
Fire risk 1/10 · Minimal
- Est. fire insurance / yr
- $1,222 – $2,270
Heat risk 7/10 · Major
- Hot days now (above 109°F)
- 7 days/yr
- Hot days in 30 yrs
- 23 days/yr
Wind risk 6/10 · Moderate
- Chance of severe wind over 30 yrs
- 27.0%
Air-quality risk 3/10 · Minor
- Unhealthy air days now
- 3 days/yr
- Unhealthy air days in 30 yrs
- 3 days/yr
Risk factors via First Street. Map © Google.
Why this score? — see what drove the C- grade
The composite is a weighted blend of 9 inputs, each scored 0–100. Each bar is that input's sub-score; the figure is the points it added to the 100-point composite (weight × sub-score).
- ARV discount +15.0/15.0
- Cash flow +10.7/30.0
- 1% rule +10.0/10.0
- Livability +4.0/5.0
- Schools +3.7/10.0
- DSCR +3.1/10.0
- Condition / age +2.5/5.0
- Rent growth +1.2/5.0
- Appreciation +0.0/10.0
$54,500
🖨 Deal sheet 📄 Offer letter ✓ Due diligence
Listing remarks MLS
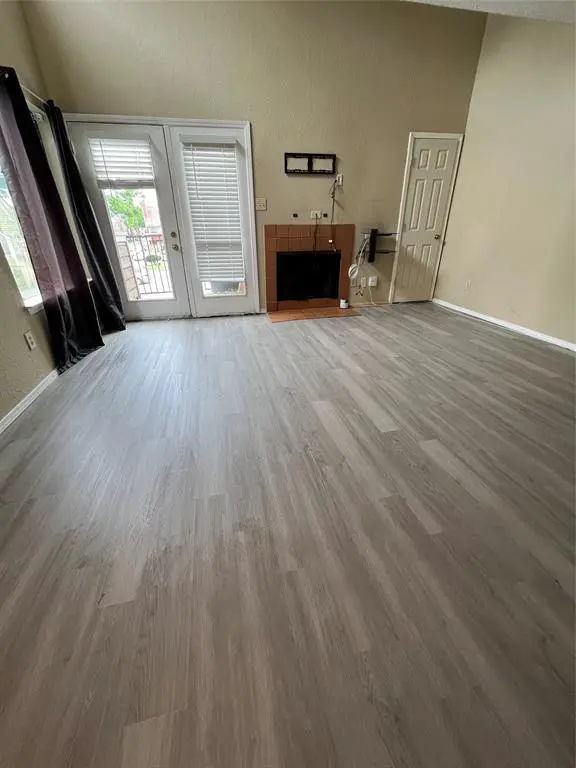
Move-in ready condo features brand-new flooring and fresh interior paint, giving the home a clean, modern feel. Bright and inviting living spaces make it easy to settle right in. Conveniently located near shopping, dining, major highways, and everyday essentials. Perfect for an owner-occupant or investor looking for a turnkey opportunity.
Key facts
- $251 HOA
- Parking
- Built 1981
Neighborhood map
What this means for you Summary
Snapshot
- This is a 1-bed/1.0-bath condo listed at $54k.
Deal economics
- At list price, monthly cash flow is $-25 ($-306/yr) — negative.
- To cash-flow at today's rent, offer at most $50k (8.3% below list).
- Meets the 1% rule at list price ($891 rent vs $54k).
- Recommended offer: $50k (8.3% below list) — sets the bar for cash-flow.
- Cap rate 5.7% vs local median 2.3% in Dallas — top-decile yield for the area; either an underpriced asset or a hidden risk that comps aren't pricing in. Stress-test before assuming the spread holds.
Location & tenants
- Location reads 81/100 on livability (#24 in TX, #1,380 nationally) — a professional / high-income tenant draw. Strengths: amenities A+, commute A+, housing A+; Watch: schools C-, crime F.
- Richardson ISD (urban): math 40% / reading 44% proficiency, ranked #316 of 826 in TX (top 38%) — families likely to look elsewhere, expect single-tenant / working-renter base with shorter leases.
- Market conditions: Rents falling (-5.3%/yr); 271 active listings in the ZIP; 40 comparable units currently listed for rent nearby; rentals leasing fast (median 4d on market — plan ~1-2 weeks tenant-placement turnaround); 12,577 units permitted in Dallas County in 2024 (6,829 in 5+ unit buildings).
Forward outlook
- Local home prices are declining (-3.0%/yr); year-one equity from $377 of loan paydown is wiped out by about $2k of value loss. Plan a longer hold.
- Dallas County population projected at +35% by 2050 — long-run rental-demand tailwind backs the buy-and-hold thesis.
Negotiation context
- It's been on market 90 days — a 6% lower offer ($51k) is reasonable based on typical stale-listing flexibility.
- 4 sale attempts; this cycle's ask is 5956% above the opening price — seller raised mid-cycle; expect resistance to lowballs.
Risks & watch-outs
- Watch-outs: property tax is 3.7% of price; HOA is 28% of rent.
- Climate carrying-cost: major wind risk, 27% chance of damaging wind over 30y; extreme-heat days projected 7→23/yr by 2055 (HVAC capex compounding) — expect insurance premiums to compound above CPI over the hold.
Questions for the listing agent
- What do current leases actually rent for vs. the listed asking? Can we see a recent rent roll and the last 12 months of T-12 income?
- It's been on market 90 days. Have you received any prior offers? Is the seller open to a 8% concession, seller financing, or rate buy-down credit?
- Property tax is high relative to price — has the assessment been appealed recently, and will the sale trigger a re-assessment?
- What does the HOA fee cover, when was the last increase, and are there any pending special assessments or reserve-fund shortfalls?
- Any open or pending special assessments — roof, HVAC, plumbing, elevator, façade? What's the per-unit balance and payoff schedule, and is the seller paying it off at close or rolling it to the buyer?
- Why hasn't it sold? Are there any deal-killer items the seller is aware of (foundation, flood, title, zoning, code violations)?
- Is there a deadline driving the sale (1031 exchange, divorce, estate, relocation)? That informs how much negotiation room exists.
- Crime grade is F in this area — have there been break-ins, vandalism, or insurance claims at this property in the last 3 years? What carrier currently insures it and at what premium?
- What's the average days-on-market for RENTAL listings here right now (not sales)? A rising rental-DOM trend means longer vacancies and softer asking-rent achievability than the comps imply.
- What's the recent tenant-quality profile in this submarket — average credit score on applications, eviction rate, late-payment / NSF rate, and stable-employment percentage? A property-management company in the area should have these aggregated.
- How much new apartment / multifamily construction is in the pipeline within 1–3 miles? Heavy new supply (>2% of stock underway) typically softens rents 12–24 months out; light construction supports rent growth.
Investment metrics
- 1% rule
- 1.63% ✓
- Cap rate
- 5.73%
- Cash-on-cash
- -2.00%
- DSCR
- 0.91
- GRM
- 5.1
CMA / ARV
- ARV (median comp)
- $70,145
- List price
- $54,500
- Delta
- -22.30%
- Verdict
- UNDERPRICED
- Comps
- 20 within 1.0 mi
Projected returns pro-forma
-3.0% appreciation · 0.0% rent growth · sell at horizon
- IRR
- -26.2%
- Equity multiple
- 0.16×
- Total profit
- $-12,835
- Equity at exit
- $8,126
- IRR
- -67.5%
- Equity multiple
- -0.47×
- Total profit
- $-22,420
- Equity at exit
- $4,712
Cash invested: $15,260 (down + closing). Projections, not guarantees.
Landlord ↔ Tenant lean methodology
- Overall (STATE)
- 87 Strongly Landlord-Friendly
- State Texas
- 87 Strongly Landlord-Friendly · R+5
- County
- — inherits STATE
- City
- — inherits STATE
ZIP-level market 75243
- Rents YoY
- -5.3%
- Active inventory
- 271
- Price-to-rent
- 5.1×
Monthly cashflow live
- Estimated rent
- $891 high interval (Pro) →
- Mortgage (P&I)
- −$286
- Tax from tax record
- −$170 /mo · $2,036/yr
- Insurance
- −$23
- HOA
- −$251
- Vacancy / Maint / Mgmt
- −$187
- Net cashflow
- $-25
Break-even live
UW: 25.0% down · 7.5% · 30yr · 1.5% tax · 5.0% vac · 8.0% maint · 8.0% mgmt
Financing live
Cash to close
- Down payment
- $13,625
- Closing costs
- $1,635
- Reserves months
- —
- Total cash needed
- —
Loan-product check · same deal, 3 products live
Conventional
25% down · 7.5% · 30yr
- Down + closing
- —
- Monthly P&I
- —
- Monthly cashflow
- —
- DSCR
- —
- Eligible?
- —
Personal DTI + credit; lowest rate.
DSCR
20% down · 8.5% · 30yr
- Down + closing
- —
- Monthly P&I
- —
- Monthly cashflow
- —
- DSCR
- —
- Eligible?
- —
No personal income docs; deal must DSCR.
Hard money
10% down · 12.0% · 12mo
- Down + closing
- —
- Monthly P&I
- —
- Monthly cashflow
- —
- DSCR
- —
- Eligible?
- —
Short-term bridge; refi at stabilization.
Rent comps 40 comps
| Address | Beds | Baths | Sqft | Rent | $/sqft | DOM | Units | Dist |
|---|---|---|---|---|---|---|---|---|
| 9835 Walnut St #102 Dallas, TX | 1.0 | 1.0 | 662 | $895 | $1.35 | 43d | 1 | 0.02mi |
| 9815 Walnut St #102 Dallas, TX | 1.0 | 1.0 | 662 | $1,100 | $1.66 | 1d | 1 | 0.03mi |
| 9839 Walnut St #305 Dallas, TX | 1.0 | 1.0 | 486 | $750 | $1.54 | 43d | 1 | 0.03mi |
| 9839 Walnut St #306 Dallas, TX | 1.0 | 1.0 | 486 | $900 | $1.85 | 1d | 1 | 0.03mi |
| 9839 Walnut St Dallas, TX | 1.0 | 1.0 | 486 | $900 | $1.85 | 43d | 1 | 0.03mi |
| 9813 Walnut St Unit 303 Dallas, TX | 1.0 | 1.0 | 535 | $695 | $1.30 | 24d | 1 | 0.04mi |
| 9813 Walnut St #104 Dallas, TX | 1.0 | 1.0 | 551 | $750 | $1.36 | 43d | 1 | 0.04mi |
| 9823 Walnut St #304 Dallas, TX | 1.0 | 1.0 | 486 | $1,100 | $2.26 | 43d | 1 | 0.09mi |
| 9825 Walnut St Dallas, TX | 1.0 | 1.0 | 551 | $1,000 | $1.81 | 43d | 1 | 0.10mi |
| 9825 Walnut St Unit 308 Dallas, TX | 1.0 | 1.0 | 423 | $695 | $1.64 | 20d | 1 | 0.10mi |
| 9825 Walnut St #306 Dallas, TX | — | 1.0 | 486 | $999 | $2.06 | 16d | 1 | 0.10mi |
| 9825 Walnut St Unit M103 Dallas, TX | 1.0 | 1.0 | 551 | $1,000 | $1.81 | 1d | 1 | 0.10mi |
| 9801 Walnut St Unit A305 Dallas, TX | 1.0 | 1.0 | 486 | $795 | $1.64 | 7d | 1 | 0.19mi |
| 9944 Walnut St Dallas, TX | 1.0–2.0 | 1.0–2.0 | 775 | $885 | $1.14 | 1d | 40 | 0.22mi |
| 12920 Audelia Rd Dallas, TX | 1.0–2.0 | 1.0–2.0 | 888 | $1,016 | $1.14 | 2d | 25 | 0.24mi |
| 9805 Walnut St Dallas, TX | 1.0–2.0 | 1.0–2.0 | 758 | $850 | $1.12 | 17d | 2 | 0.28mi |
| 10000 Walnut St Dallas, TX | 2.0 | 1.0–2.0 | 717 | $1,118 | $1.56 | 2d | 23 | 0.32mi |
| 9855 Shadow Way Dallas, TX | 2.0 | 1.0–2.0 | 760 | $1,104 | $1.45 | 3d | 20 | 0.40mi |
| 9696 Walnut St Dallas, TX | 1.0–2.0 | 1.0–2.0 | 866 | $799 | $0.92 | 3d | 5 | 0.49mi |
| 9696 Walnut St Dallas, TX | 1.0–2.0 | 1.0–2.0 | 866 | $750 | $0.87 | 13d | 5 | 0.49mi |
| 9696 Walnut St Dallas, TX | 1.0–2.0 | 1.0–2.0 | 866 | $725 | $0.84 | 24d | 7 | 0.49mi |
| 12111 Audelia Rd Dallas, TX | 1.0–2.0 | 1.0–2.0 | 862 | $675 | $0.78 | 1d | 42 | 0.75mi |
| 540 Buckingham Rd Richardson, TX | 1.0–3.0 | 1.0–2.0 | 964 | $1,050 | $1.09 | 2d | 34 | 0.83mi |
| 11991 Audelia Rd Dallas, TX | 1.0–2.0 | 1.0–2.0 | 827 | $740 | $0.89 | 1d | 36 | 0.85mi |
| 12121 Audelia Rd Dallas, TX | 1.0–2.0 | 1.0–2.0 | 862 | $700 | $0.81 | 1d | 41 | 0.85mi |
| 530 Buckingham Rd Richardson, TX | 1.0–3.0 | 1.0–2.0 | 995 | $1,240 | $1.25 | 1d | 24 | 0.96mi |
| 9737 Forest Ln Dallas, TX | 1.0–2.0 | 1.0–2.0 | 650 | $700 | $1.08 | 16d | 30 | 0.98mi |
| 9920 Forest Ln Dallas, TX | 1.0–2.0 | 1.0–2.0 | 882 | $955 | $1.08 | 22d | 3 | 1.00mi |
| 9920 Forest Ln Dallas, TX | 1.0 | 1.0 | 739 | $1,048 | $1.42 | 7d | 2 | 1.00mi |
| 4209 W Walnut St Garland, TX | 1.0–2.0 | 1.0 | 845 | $1,275 | $1.51 | 2d | 29 | 1.02mi |
| 11700 Audelia Rd Dallas, TX | 1.0–2.0 | 1.0–2.0 | 830 | $944 | $1.14 | 7d | 15 | 1.03mi |
| 9669 Forest Ln Dallas, TX | 1.0–2.0 | 1.0–2.0 | 827 | $650 | $0.79 | 3d | 36 | 1.03mi |
| 535 Buckingham Rd Richardson, TX | 1.0–2.0 | 1.0–2.0 | 828 | $908 | $1.10 | 3d | 18 | 1.08mi |
| 11620 Audelia Rd Dallas, TX | 1.0–2.0 | 1.0–2.0 | 889 | $880 | $0.99 | 2d | 12 | 1.09mi |
| 430 Buckingham Rd Richardson, TX | 1.0–2.0 | 1.0–2.0 | 917 | $1,149 | $1.25 | 1d | 14 | 1.10mi |
| 11606 Audelia Rd Dallas, TX | 1.0 | 1.0 | 741 | $925 | $1.25 | 24d | 1 | 1.13mi |
| 9637 Forest Ln Dallas, TX | 1.0–3.0 | 1.0–2.0 | 1006 | $961 | $0.95 | 2d | 14 | 1.14mi |
| 11600 Audelia Rd Dallas, TX | 1.0–2.0 | 1.0–2.0 | 877 | $799 | $0.91 | 5d | 18 | 1.16mi |
| 9690 Forest Ln Dallas, TX | 3.0 | 1.0–2.0 | 838 | $1,088 | $1.30 | 1d | 31 | 1.17mi |
| 11515 Leisure Dr Dallas, TX | 1.0–2.0 | 1.0–2.0 | 781 | $675 | $0.86 | 3d | 27 | 1.19mi |
HOA detail condo
- Monthly dues
- $251 · $3,012/yr
- Assessments
- None detected in remarks — confirm with the listing agent.
Listing history 23 events
-
2026-06-18days on market $54,500 Active 90 DOM
-
2026-06-17days on market $54,500 Active 89 DOM
-
2026-06-16days on market $54,500 Active 88 DOM
-
2026-06-15days on market $54,500 Active 87 DOM
-
2026-06-13days on market $54,500 Active 85 DOM
-
2026-06-09days on market $54,500 Active 81 DOM
-
2026-06-08days on market $54,500 Active 80 DOM
-
2026-06-07days on market $54,500 Active 79 DOM
-
2026-06-04days on market $54,500 Active 76 DOM
-
2026-06-03days on market $54,500 Active 75 DOM
-
2026-06-02days on market $54,500 Active 74 DOM
-
2026-06-01days on market $54,500 Active 73 DOM
-
2026-05-31days on market $54,500 Active 72 DOM
-
2026-05-06$900
-
2026-03-18$54,500 Active 340-char remark
Show marketing remark (340 chars)
Move-in ready condo features brand-new flooring and fresh interior paint, giving the home a clean, modern feel. Bright and inviting living spaces make it easy to settle right in. Conveniently located near shopping, dining, major highways, and everyday essentials. Perfect for an owner-occupant or investor looking for a turnkey opportunity.
-
2026-03-10historical
-
2025-12-10price $54,400
-
2025-11-06status Active
-
2025-11-05status Pending
-
2025-10-25historical Active Option Contract
-
2025-10-06price $54,900
-
2025-09-02$65,000 Active
-
2014-03-10soldstatus
ⓘ Source: listings_history table (triggers on properties + properties_extension) + one-shot
backfill from property_details.listing_events for pre-trigger history.
Tax reassessment forecast TX · Resets to sale price
- Current annual tax
- $2,036 · $170/mo
- Projected year-2 tax
- $2,036 · $170/mo
- Expected delta
- $0/yr ($0/mo · 0.0%)
ⓘ Screening estimate from a state-policy table — verify with the county assessor before closing.
Climate risk First Street
- Flood 1/10 Low FEMA zone X (unshaded) · 0% chance over 30 yrs
- Wildfire 1/10 Low
- Heat 7/10 Severe 7 d/yr ≥109°F today · 23 d/yr by 30 yrs out
- Wind 6/10 Major 27% chance of damaging wind over 30 yrs
- Air quality 3/10 Moderate 3 unhealthy d/yr today · 3 by 30 yrs out
Nearby sold comps map
Loading sold comps map…
Walkable amenities ~0.75 mi
Loading nearby amenities…
Taxation est. · year 1
- Rental income
- $10,689
- − Mortgage interest
- −$3,053
- − Property taxes
- −$2,036
- − Insurance
- −$272
- − Repairs & maintenance
- −$855
- − Management
- −$855
- − HOA
- −$3,012
- − Depreciation
- −$1,585
- Taxable loss
- −$980
- Est. tax savings @ 24.0%
- +$235
- After-tax cash flow
- $-71/yr
For passive investors: Depreciation is non-cash, so a rental often shows a tax loss while cash-flowing — sheltering income. Rental losses are passive: they offset passive income freely, and up to $25,000/yr can offset ordinary (W-2) income if you actively participate and your MAGI is under $100k (phasing out to $0 by $150k); unused losses carry forward. On sale, claimed depreciation is recaptured at up to 25%, and gains may owe capital-gains tax (a 1031 exchange can defer both). Figures are a year-1 estimate at your 24.0% rate — not tax advice; consult a CPA.
Schools (NCES district)
- District
- Richardson ISD
- NCES district ID
- 4837020
- Math proficiency
- 40% ▼ -14.00%
- Reading proficiency
- 44% ▼ -6.00%
- Median HH income
- $54,609
- Composite
- 36.58/100
- National rank
- #4633
- State rank
- #316 of 826 in TX
Livability — Dallas
- Score
- 81/100
- State rank
- #24
- US rank
- #1380
Category grades
Schools grade is shown separately in the Schools card above.
Census & demographics
- Census place
- Dallas, TX
- County
- Dallas County · 2,612,404 people
- City population
- 1,168,437
- Metro
- Dallas-Fort Worth-Arlington, TX
- Population (ZIP)
- 63,481
- Household income
- $53,618
- Rent vs Own
- Severe rent burden
- 5970.0
Population outlook (Dallas County) Hauer SSP2
- Today (2025)
- 2,979,839 people
- By 2030
- 3,191,823 · +7.1%
- By 2040
- 3,619,611 · +21.5%
- By 2050
- 4,026,915 · +35.1%
- By 2075
- 4,957,073 · +66.4%
- By 2100
- 5,508,725 · +84.9%
Race, ethnicity, and origin ACS 2023
- Neighborhood character
- Highly diverse neighborhood (Simpson 0.71)
- Race & ethnicity
- Black 43% Hispanic / Latino 23% White 22% Two or more races 10% Asian 7%
- Hispanic origin (detail)
- Mexican 15%
- Common ancestry
- Swiss 1% Slovak 1% Lithuanian 1%
- Foreign-born
- 34% · Canada, Vietnam, South Korea
- Languages at home
- 56% English-only · Spanish 21% Other Indo-European 3% French/Haitian/Cajun 2%
Political lean MEDSL · Dallas
- 2024 margin
- Strong D (+22.2) · D 60.2% · R 38.0% · Other 1.8%
- 2008→2024 swing
- +6.9pp toward D · 2008: 15.3pp · 2024: 22.2pp
- All cycles
- 2024: D+22.2 2020: D+31.6 2016: D+26.2 2012: D+15.4 2008: D+15.3
Not yet ingested
- Civics
- —
Market trends
- HPI YoY
- ▼ -203.08%
- Current HPI
- 317.5287
- Rent YoY
- ▼ -5.31%
- Metro
- Dallas-Fort Worth-Arlington, TX
- State GDP YoY
- ▲ 3.95%
- F500 in state
- 110
Industry mix (Fortune 500 HQ in TX)
| Industry | F500 HQs | Revenue |
|---|---|---|
| Energy | 16 | $1,198B |
|
||
| Technology | 5 | $198B |
|
||
| Engineering / Construction | 4 | $72B |
|
||
| Energy Services | 3 | $60B |
|
||
| Utilities | 3 | $41B |
|
||
| Healthcare | 2 | $330B |
|
||
Price history
-16.2% since first listed10 events — show timeline
- 2026-05-06 Listed for Rent $900 NTREIS
- 2026-03-18 Listed $54,500 NTREIS
- 2026-03-10 Listing Removed — NTREIS
- 2025-12-10 Price Changed $54,400 NTREIS
- 2025-11-06 Relisted — NTREIS
- 2025-11-05 Pending — NTREIS
- 2025-10-25 Contingent — NTREIS
- 2025-10-06 Price Changed $54,900 NTREIS
- 2025-09-02 Listed $65,000 NTREIS
- 2014-03-10 Sold (Public Records) — Public Records
Property tax history
+6.9%/yrLatest (2025): $2,036 · -2.1% YoY. Source: county tax records.
Cash-flow waterfall
monthlySold comps — $/sqft
last 12 mo · ≤1 miLoading sold comps…