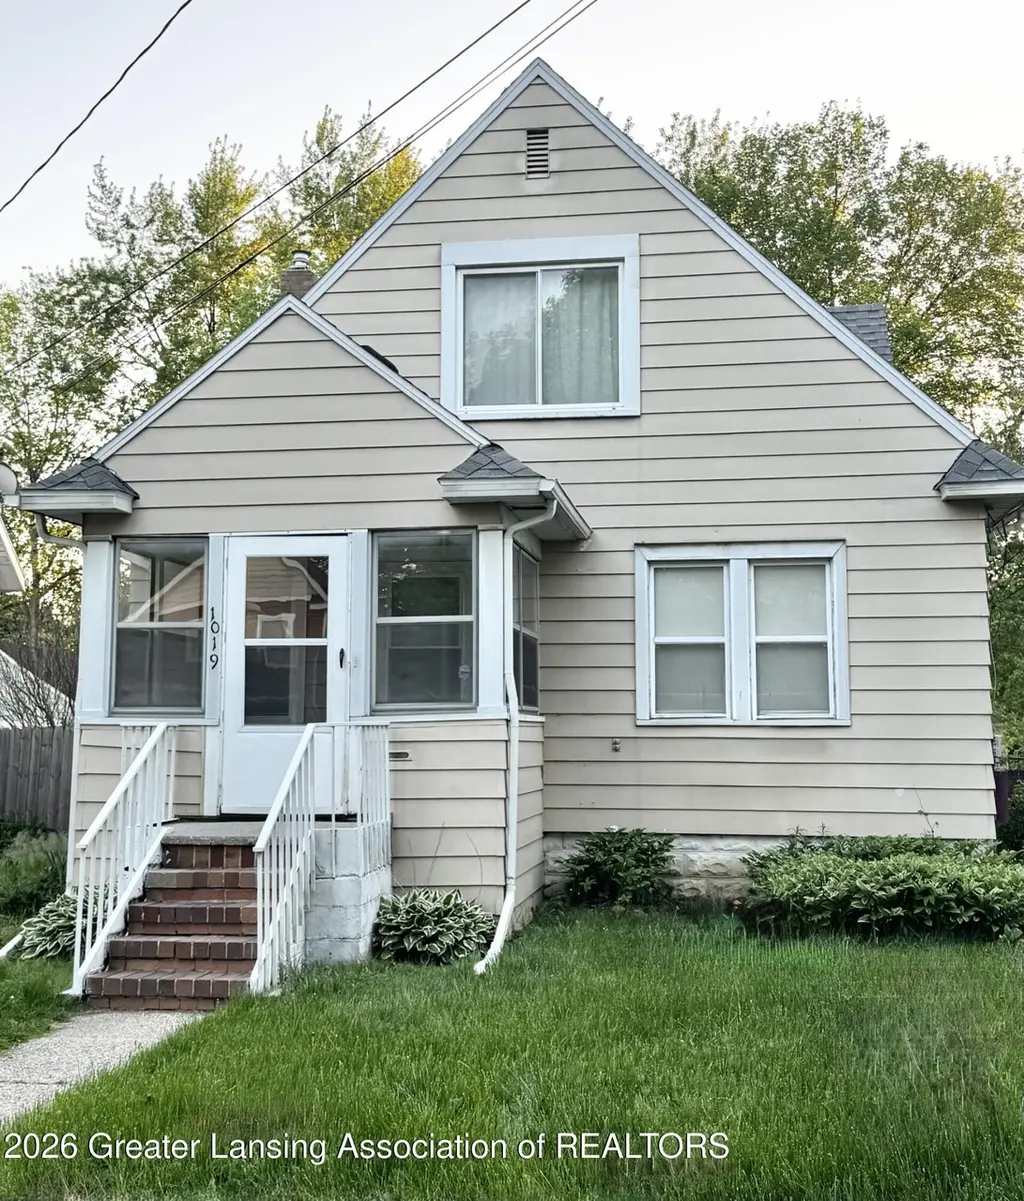
1019 N Jenison Ave · Lansing, MI
Flood risk 1/10 · Minimal
- FEMA flood zone
- X (unshaded)
- Chance of flooding over 30 yrs
- 0.0%
- Est. flood insurance / yr
- $473 – $860
Fire risk 1/10 · Minimal
- Est. fire insurance / yr
- $784 – $1,456
Heat risk 2/10 · Minimal
- Hot days now (above 97°F)
- 7 days/yr
- Hot days in 30 yrs
- 16 days/yr
Wind risk 2/10 · Minimal
- Chance of severe wind over 30 yrs
- —
Air-quality risk 2/10 · Minimal
- Unhealthy air days now
- 1 days/yr
- Unhealthy air days in 30 yrs
- 2 days/yr
Risk factors via First Street. Map © Google.
Why this score? — see what drove the C grade
The composite is a weighted blend of 9 inputs, each scored 0–100. Each bar is that input's sub-score; the figure is the points it added to the 100-point composite (weight × sub-score).
- Cash flow +22.5/30.0
- ARV discount +11.3/15.0
- DSCR +7.2/10.0
- 1% rule +7.0/10.0
- Livability +4.0/5.0
- Rent growth +2.5/5.0
- Condition / age +2.5/5.0
- Schools +1.9/10.0
- Appreciation +0.0/10.0
$129,900
🖨 Deal sheet (PDF) 📄 Offer letter ✓ Due diligence
Listing remarks MLS
Public Remarks Adorable four bedrooms, 2 full bathrooms house on quiet street. Spacious living room, dining room and kitchen. Hardwood floors and loaded with charm and character. Full basement, ready to finish. Nice fenced yard, garage with opener. Wonderful potential! Convenient location and well established neighborhood! Great starter home for 1st time buyer! Call for private showings!
Key facts
- Fenced yard
- Full basement
- Garage with opener
Tags
Property features AI
Exterior
- Parking: Attached 1-car garage with garage door opener
- Utilities: Public sewer
- Home design: Cape Cod style; Two levels; Built in 1926
- Construction: Aluminum siding
- Exterior features: Back yard; Front porch and additional porch; Shingle roof
Interior
- Kitchen: Oven; Range; Microwave; Refrigerator
- Bedrooms: 4 bedrooms (Primary Bedroom included)
- Flooring: Combination flooring
- Bathrooms: 2 full bathrooms
- Heating & cooling: Forced air heating (natural gas); Central air conditioning
- Interior features: Combination flooring; Full basement
- Laundry & utility: Washer and Dryer; Laundry located in basement
Neighborhood map
What this means for you Summary
Snapshot
- This is a 4-bed/2.0-bath single-family listed at $130k.
Deal economics
- At list price, monthly cash flow is $219 ($3k/yr) — positive.
- The deal already cash-flows at list — no discount required.
- Meets the 1% rule at list price ($2k rent vs $130k).
- Recommended offer: $128k (1.5% below list) — sets the bar for market timing.
- Cap rate 8.3% vs local median 6.0% in Lansing — top-decile yield for the area; either an underpriced asset or a hidden risk that comps aren't pricing in. Stress-test before assuming the spread holds.
Location & tenants
- Location reads 79/100 on livability (#94 in MI, #2,182 nationally) — a middle-class / working-renter tenant base. Strengths: amenities A+, commute A+, cost of living A+; Watch: employment D, schools F, crime F.
- Lansing Public School District (urban): math 14% / reading 23% proficiency, ranked #650 of 760 in MI (top 86%) — low school quality limits family demand, transient renter base, plan for 1-2y turnover; 68% free/reduced lunch — lower-income household profile, screen leases tightly.
- Market conditions: 68 active listings in the ZIP; 6 comparable units currently listed for rent nearby; rentals at typical pace (median 22d on market — plan ~3-4 weeks tenant-placement turnaround); 350 units permitted in Ingham County in 2024 (186 in 5+ unit buildings).
- This rent runs 34% of the median local income ($54k/yr) — at the standard rent-burdened threshold; future hikes will face affordability resistance.
Forward outlook
- Local home prices are declining (-3.0%/yr); year-one equity from $898 of loan paydown is wiped out by about $4k of value loss. Plan a longer hold.
- Ingham County population projected at +11% by 2050 — modest demand growth; plan on rents tracking national, not racing it.
Negotiation context
- It's been on market 25 days — a 2% lower offer ($128k) is reasonable based on typical stale-listing flexibility.
- 4 sale attempts since 16y ago with the ask held roughly flat each time — persistent listings suggest the price (not the market) is what's stuck; bring a comps-based counter.
Risks & watch-outs
- Watch-outs: property tax is 2.6% of price; built in 1926 — expect roof / HVAC / electrical / plumbing capex.
Questions for the listing agent
- Built in 1926 — when were the roof, HVAC, electrical panel, plumbing, and water heater last replaced?
- Property tax is high relative to price — has the assessment been appealed recently, and will the sale trigger a re-assessment?
- Is there a deadline driving the sale (1031 exchange, divorce, estate, relocation)? That informs how much negotiation room exists.
- Schools are F-rated, which usually means shorter tenancies and higher turnover. Who's the typical renter profile here, and what's been the actual vacancy rate?
- Crime grade is F in this area — have there been break-ins, vandalism, or insurance claims at this property in the last 3 years? What carrier currently insures it and at what premium?
- What's the average days-on-market for RENTAL listings here right now (not sales)? A rising rental-DOM trend means longer vacancies and softer asking-rent achievability than the comps imply.
- What's the recent tenant-quality profile in this submarket — average credit score on applications, eviction rate, late-payment / NSF rate, and stable-employment percentage? A property-management company in the area should have these aggregated.
- How much new for-sale + rental construction is in the pipeline within 1–3 miles? Heavy new supply typically softens prices + rents 12–24 months out; constrained supply supports both.
Investment metrics
- 1% rule
- 1.20% ✓
- Cap rate
- 8.32%
- Cash-on-cash
- 7.23%
- DSCR
- 1.32
- GRM
- 6.9
CMA / ARV
- ARV (median comp)
- $141,946
- List price
- $129,900
- Delta
- -8.49%
- Verdict
- FAIR
- Comps
- 20 within 1.0 mi
Show comp detail 12 sales within ~0.75 mi
| Address | Dist | Beds/Ba | Sqft | Sold | Price | $/sf | Match |
|---|---|---|---|---|---|---|---|
| 920 Clyde St | 0.26mi | 3/1.5 (-1) | 1,204 (-2%) | 2mo | $170,000 | $141 | 77 |
| 916 Cleo St | 0.19mi | 3/1.5 (-1) | 1,124 (-8%) | 0mo | $172,000 | $153 | 70 |
| 1100 Comfort St | 0.07mi | 3/1.0 (-1) | 1,108 (-10%) | 2mo | $132,000 | $119 | 70 |
| 1629 N Genesee Dr | 0.41mi | 3/2.0 (-1) | 1,176 (-4%) | 1mo | $213,800 | $182 | 68 |
| 1422 Comfort St | 0.33mi | 4/1.5 | 1,342 (+10%) | 0mo | $160,000 | $119 | 66 |
| 1043 Ontario St | 0.40mi | 3/1.0 (-1) | 1,152 (-6%) | 2mo | $54,900 | $48 | 61 |
| 919 Princeton Ave | 0.37mi | 3/1.5 (-1) | 1,119 (-9%) | 2mo | $60,000 | $54 | 60 |
| 502 N Butler Blvd | 0.65mi | 3/1.0 (-1) | 1,176 (-4%) | 1mo | $144,000 | $122 | 54 |
| 1217 W Shiawassee St | 0.62mi | 3/1.5 (-1) | 1,316 (+8%) | 3mo | $147,000 | $112 | 49 |
| 1621 Robertson Ave | 0.58mi | 3/1.5 (-1) | 1,108 (-10%) | 3mo | $110,000 | $99 | 48 |
| 905 N Sycamore St | 0.58mi | 3/1.5 (-1) | 1,368 (+12%) | 0mo | $130,000 | $95 | 46 |
| 1537 Roselawn Ave | 0.49mi | 3/1.5 (-1) | 1,054 (-14%) | 4mo | $104,500 | $99 | 44 |
Match score weights: distance 35% · size 25% · config 20% · recency 20%. Top-matched comps best support the ARV.
Projected returns pro-forma
-3.0% appreciation · 3.0% rent growth · sell at horizon
- IRR
- -5.2%
- Equity multiple
- 0.81×
- Total profit
- $-6,994
- Equity at exit
- $19,369
- IRR
- 4.6%
- Equity multiple
- 1.34×
- Total profit
- $12,274
- Equity at exit
- $11,231
Cash invested: $36,372 (down + closing). Projections, not guarantees.
Landlord ↔ Tenant lean methodology
- Overall (STATE)
- 62 Landlord-Friendly
- State Michigan
- 62 Landlord-Friendly · EVEN
- County
- — inherits STATE
- City
- — inherits STATE
ZIP-level market 48915
- Active inventory
- 68
- Price-to-rent
- 6.9×
Monthly cashflow live
- Estimated rent
- $1,563 high interval (Pro) →
- Mortgage (P&I)
- −$681
- Tax from tax record
- −$280 /mo · $3,363/yr
- Insurance
- −$54
- HOA
- −$0
- Vacancy / Maint / Mgmt
- −$328
- Net cashflow
- $219
Break-even live
Sensitivity live
| Price | -10% $293 | -5% $256 | +0% $219 | +5% $182 | +10% $146 |
|---|---|---|---|---|---|
| Rent | -10% $96 | -5% $157 | +0% $219 | +5% $281 | +10% $343 |
| Rate | -1.0pp $285 | -0.5pp $252 | base $219 | +0.5pp $186 | +1.0pp $151 |
UW: 25.0% down · 7.5% · 30yr · 1.5% tax · 5.0% vac · 8.0% maint · 8.0% mgmt
Financing live
Cash to close
- Down payment
- $32,475
- Closing costs
- $3,897
- Reserves months
- —
- Total cash needed
- —
Loan-product check · same deal, 3 products live
Conventional
25% down · 7.5% · 30yr
- Down + closing
- —
- Monthly P&I
- —
- Monthly cashflow
- —
- DSCR
- —
- Eligible?
- —
Personal DTI + credit; lowest rate.
DSCR
20% down · 8.5% · 30yr
- Down + closing
- —
- Monthly P&I
- —
- Monthly cashflow
- —
- DSCR
- —
- Eligible?
- —
No personal income docs; deal must DSCR.
Hard money
10% down · 12.0% · 12mo
- Down + closing
- —
- Monthly P&I
- —
- Monthly cashflow
- —
- DSCR
- —
- Eligible?
- —
Short-term bridge; refi at stabilization.
Rent comps 6 comps
| Address | Beds | Baths | Sqft | Rent | $/sqft | DOM | Units | Dist |
|---|---|---|---|---|---|---|---|---|
| 919 Princeton Ave Lansing, MI | 3.0 | 1.5 | 1119 | $1,475 | $1.32 | 22d | 1 | 0.37mi |
| 1012 Ontario St Lansing, MI | 4.0 | 2.0 | 1320 | $1,600 | $1.21 | 22d | 1 | 0.45mi |
| 712 N Sycamore St Lansing, MI | 3.0 | 1.0 | 1100 | $1,650 | $1.50 | 22d | 1 | 0.67mi |
| 433 Seymour Ave Unit 3 Lansing, MI | 3.0 | 1.0 | 1250 | $1,395 | $1.12 | 44d | 1 | 1.03mi |
| 400 N Catherine St Lansing, MI | 3.0 | 1.0 | 760 | $1,395 | $1.84 | 14d | 1 | 1.03mi |
| 1330 W Hillsdale St Lansing, MI | 3.0 | 1.0 | 1008 | $1,550 | $1.54 | 44d | 1 | 1.27mi |
Listing history 16 events
-
2026-06-10status $129,900 Pending 25 DOM
-
2026-06-09days on market $129,900 Active Under Contract 25 DOM
Show marketing remark (391 chars)
Public Remarks Adorable four bedrooms, 2 full bathrooms house on quiet street. Spacious living room, dining room and kitchen. Hardwood floors and loaded with charm and character. Full basement, ready to finish. Nice fenced yard, garage with opener. Wonderful potential! Convenient location and well established neighborhood! Great starter home for 1st time buyer! Call for private showings!
-
2026-06-08days on market $129,900 Active Under Contract 24 DOM
-
2026-06-07days on market $129,900 Active Under Contract 23 DOM
-
2026-06-05days on market $129,900 Active Under Contract 20 DOM
-
2026-06-03days on market $129,900 Active Under Contract 19 DOM
-
2026-06-02days on market $129,900 Active Under Contract 18 DOM
-
2026-06-01days on market $129,900 Active Under Contract 17 DOM
-
2026-05-31days on market $129,900 Active Under Contract 16 DOM
-
2026-05-30days on market $129,900 Active Under Contract 15 DOM
-
2026-05-15$129,900 Active 391-char remark
Show marketing remark (391 chars)
Public Remarks Adorable four bedrooms, 2 full bathrooms house on quiet street. Spacious living room, dining room and kitchen. Hardwood floors and loaded with charm and character. Full basement, ready to finish. Nice fenced yard, garage with opener. Wonderful potential! Convenient location and well established neighborhood! Great starter home for 1st time buyer! Call for private showings!
-
2012-01-31historical
-
2011-07-27$60,000
-
2010-10-10historical
-
2010-04-10$79,000
ⓘ Source: listings_history table (triggers on properties + properties_extension) + one-shot
backfill from property_details.listing_events for pre-trigger history.
Tax reassessment forecast MI · Partial reset (capped growth)
- Current annual tax
- $3,363 · $280/mo
- Projected year-2 tax
- $3,363 · $280/mo
- Expected delta
- $0/yr ($0/mo · 0.0%)
ⓘ Screening estimate from a state-policy table — verify with the county assessor before closing.
Climate risk First Street
- Flood 1/10 Low FEMA zone X (unshaded) · 0% chance over 30 yrs
- Wildfire 1/10 Low
- Heat 2/10 Low 7 d/yr ≥97°F today · 16 d/yr by 30 yrs out
- Wind 2/10 Low
- Air quality 2/10 Low 1 unhealthy d/yr today · 2 by 30 yrs out
Nearby sold comps map
Loading sold comps map…
Walkable amenities ~0.75 mi
Loading nearby amenities…
Taxation est. · year 1
- Rental income
- $18,756
- − Mortgage interest
- −$7,276
- − Property taxes
- −$3,363
- − Insurance
- −$650
- − Repairs & maintenance
- −$1,501
- − Management
- −$1,501
- − Depreciation
- −$3,779
- Taxable income
- $687
- Est. tax owed @ 24.0%
- −$165
- After-tax cash flow
- $2,465/yr
For passive investors: Depreciation is non-cash, so a rental often shows a tax loss while cash-flowing — sheltering income. Rental losses are passive: they offset passive income freely, and up to $25,000/yr can offset ordinary (W-2) income if you actively participate and your MAGI is under $100k (phasing out to $0 by $150k); unused losses carry forward. On sale, claimed depreciation is recaptured at up to 25%, and gains may owe capital-gains tax (a 1031 exchange can defer both). Figures are a year-1 estimate at your 24.0% rate — not tax advice; consult a CPA.
Schools (NCES district)
- District
- Lansing Public School District
- NCES district ID
- 2621150
- Math proficiency
- 14% ▲ 1.00%
- Reading proficiency
- 23% ▲ 3.00%
- Median HH income
- $37,453
- Composite
- 18.76/100
- National rank
- #14002
- State rank
- #650 of 760 in MI
Livability — Lansing
- Score
- 79/100
- State rank
- #94
- US rank
- #2182
Category grades
Schools grade is shown separately in the Schools card above.
Census & demographics
- Census place
- Lansing, MI
- County
- Ingham County · 237,052 people
- City population
- 161,269
- Metro
- Lansing-East Lansing, MI
- Population (ZIP)
- 9,428
- Household income
- $54,465
- Rent vs Own
- Severe rent burden
- 307.0
Population outlook (Ingham County) Hauer SSP2
- Today (2025)
- 300,362 people
- By 2030
- 307,808 · +2.5%
- By 2040
- 320,492 · +6.7%
- By 2050
- 333,223 · +10.9%
- By 2075
- 373,693 · +24.4%
- By 2100
- 392,021 · +30.5%
Race, ethnicity, and origin ACS 2023
- Neighborhood character
- Diverse neighborhood (Simpson 0.64)
- Race & ethnicity
- White 54% Black 24% Two or more races 13% Hispanic / Latino 13%
- Hispanic origin (detail)
- Mexican 10%
- Common ancestry
- Romanian 7% Lithuanian 2% Iranian 2%
- Foreign-born
- 5% · Canada, Philippines
- Languages at home
- 90% English-only · Spanish 7% Other Asian/Pacific 1% German/W. Germanic 1%
Political lean MEDSL · Ingham
- 2024 margin
- Strong D (+29.7) · D 63.9% · R 34.2% · Other 2.0%
- 2008→2024 swing
- -3.6pp toward R · 2008: 33.3pp · 2024: 29.7pp
- All cycles
- 2024: D+29.7 2020: D+32.2 2016: D+27.6 2012: D+27.9 2008: D+33.3
Not yet ingested
- Civics
- —
Market trends
- HPI YoY
- ▼ -129.90%
- Current HPI
- 177.0906
- Rent YoY
- —
- Metro
- Lansing-East Lansing, MI
- State GDP YoY
- ▲ 1.37%
- F500 in state
- 28
Industry mix (Fortune 500 HQ in MI)
| Industry | F500 HQs | Revenue |
|---|---|---|
| Automotive Parts | 3 | $48B |
|
||
| Automotive | 2 | $372B |
|
||
| Chemicals | 1 | $45B |
|
||
| Automotive Retail | 1 | $29B |
|
||
| Healthcare / Medical Devices | 1 | $23B |
|
||
| Automotive Technology | 1 | $20B |
|
||
Price history
+64.4% since first listed10 events — show timeline
- 2026-06-09 Pending — REALCOMP
- 2026-06-09 Pending — Greater Lansing AoR
- 2026-05-27 Contingent — REALCOMP
- 2026-05-27 Contingent — Greater Lansing AoR
- 2026-05-15 Listed $129,900 Greater Lansing AoR
- 2026-05-15 Listed $129,900 REALCOMP
- 2012-01-31 Listing Removed — Greater Lansing AoR
- 2011-07-27 Listed $60,000 Greater Lansing AoR
- 2010-10-10 Listing Removed — Greater Lansing AoR
- 2010-04-10 Listed $79,000 Greater Lansing AoR
Property tax history
+3.5%/yrLatest (2025): $3,363 · +3.0% YoY. Source: county tax records.
Cash-flow waterfall
monthlySold comps — $/sqft
last 12 mo · ≤1 miLoading sold comps…