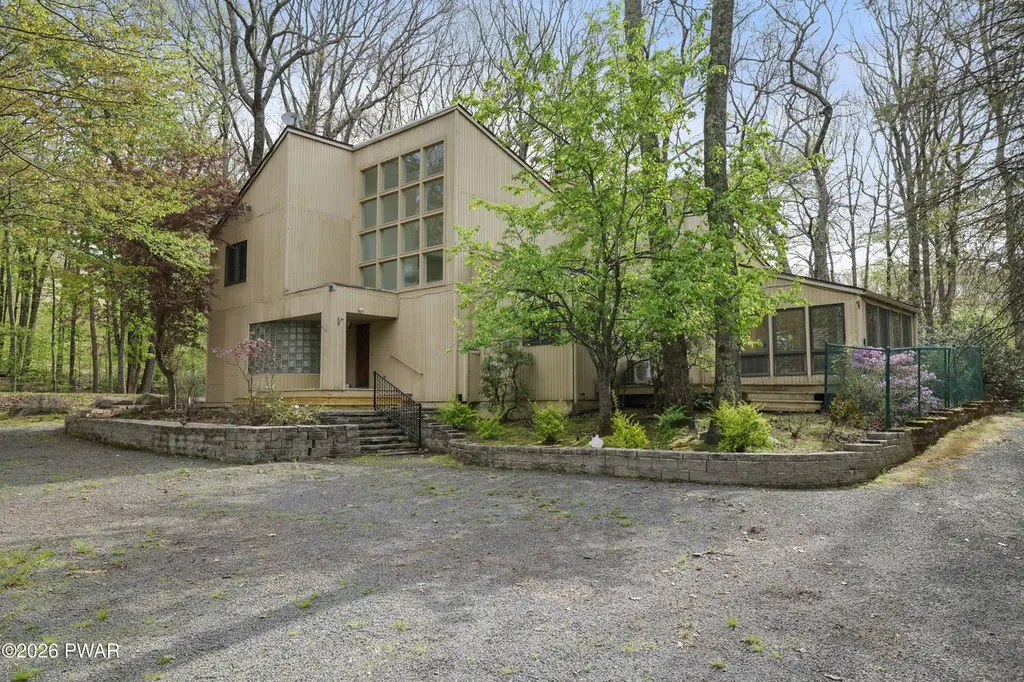
121 Fairway Dr · Hemlock Farms, PA
Flood risk 1/10 · Minimal
- FEMA flood zone
- X (unshaded)
- Chance of flooding over 30 yrs
- 0.0%
- Est. flood insurance / yr
- $473 – $860
Fire risk 5/10 · Moderate
- Est. fire insurance / yr
- $511 – $949
Heat risk 2/10 · Minimal
- Hot days now (above 91°F)
- 7 days/yr
- Hot days in 30 yrs
- 15 days/yr
Wind risk 3/10 · Minor
- Chance of severe wind over 30 yrs
- 7.0%
Air-quality risk 2/10 · Minimal
- Unhealthy air days now
- 1 days/yr
- Unhealthy air days in 30 yrs
- 2 days/yr
Risk factors via First Street. Map © Google.
Why this score? — see what drove the C- grade
The composite is a weighted blend of 9 inputs, each scored 0–100. Each bar is that input's sub-score; the figure is the points it added to the 100-point composite (weight × sub-score).
- Cash flow +12.7/30.0
- Appreciation +10.0/10.0
- ARV discount +8.0/15.0
- 1% rule +4.4/10.0
- Schools +4.2/10.0
- DSCR +3.8/10.0
- Livability +3.4/5.0
- Rent growth +2.5/5.0
- Condition / age +2.5/5.0
$399,000
🖨 Deal sheet 📄 Offer letter ✓ Due diligence
Listing remarks
This isn't your typical golf course home. With bold contemporary architecture and a setting overlooking the 7th hole of LVCC, this 3-bedroom, 2-bath retreat offers a rare blend of design, comfort, and lifestyle. Expansive walls of glass fill the home with natural light and create a seamless connection to the outdoors, while the open-concept layout is ideal for both quiet mornings and entertaining friends. Warm oak flooring, a wood-burning fireplace, and an airy lofted office space add character and functionality, while the private primary suite features a unique glass-block Jacuzzi room that feels like your own personal wellness escape. Located in the amenity-rich Hemlock community, life he
Key facts
- Golf course home
- Open-concept layout
- 0.7 acre lot
Tags
Property features AI
Finance
- HOA & community: Homeowners association with annual fee of $2,995 (approximately $249.58/month)
Exterior
- Security: 24-hour security; Gated community
- Utilities: Septic tank
- Home design: Single family residence; Two stories
- Construction: Shingle roof
- Exterior features: Deck; On golf course; Paved road access; Community features: gated community, clubhouse, tennis courts, park, lake, golf, fitness center, pool, fishing
Interior
- Kitchen: Dishwasher; Electric range; Electric oven; Refrigerator
- Flooring: Carpet; Tile; Hardwood
- Bathrooms: 2 full bathrooms
- Heating & cooling: Baseboard heating; Electric heating
- Interior features: Fireplace (1); Has view
- Laundry & utility: Main level laundry room; Washer; Dryer
Neighborhood map
What this means for you Summary
Snapshot
- This is a 3-bed/2.0-bath single-family listed at $399k.
Deal economics
- At list price, monthly cash flow is $-44 ($-532/yr) — negative.
- To cash-flow at today's rent, offer at most $391k (2.0% below list).
- To meet the 1% rule (rent ≥ 1% of price), the offer needs to be $374k (6.1% below list).
- Recommended offer: $374k (6.1% below list) — sets the bar for 1% rule.
Location & tenants
- Location reads 68/100 on livability (#884 in PA) — a middle-class / working-renter tenant base. Strengths: crime A+, housing A+, health & safety A+; Watch: schools C-, amenities F, commute F.
- Wallenpaupack Area SD (rural): math 39% / reading 59% proficiency, ranked #192 of 539 in PA (top 36%) — families likely to look elsewhere, expect single-tenant / working-renter base with shorter leases.
- Market conditions: 371 active listings in the ZIP; 2 comparable units currently listed for rent nearby; 213 units permitted in Pike County in 2024 (0 in 5+ unit buildings).
Forward outlook
- In year one you build about $43k of equity ($3k loan paydown + $40k appreciation (10.0% local appreciation)).
- Pike County population projected at -25% by 2050 — secular population decline; favor cash flow + early exit over multi-decade hold.
- At projected returns (10.0% appreciation + 3.0% rent growth), your $112k cash investment doubles in ~3 years — after that, you're playing with house money.
- By year 2, paydown + projected appreciation supports a ~$69k cash-out refi (75% LTV) — recoverable capital for the next deal without selling this one.
Negotiation context
- It's been on market 31 days — a 3% lower offer ($387k) is reasonable based on typical stale-listing flexibility.
- 4 sale attempts since 2y ago with the ask held roughly flat each time — persistent listings suggest the price (not the market) is what's stuck; bring a comps-based counter.
Risks & watch-outs
- Climate carrying-cost: moderate wildfire risk — expect insurance premiums to compound above CPI over the hold.
Questions for the listing agent
- What do current leases actually rent for vs. the listed asking? Can we see a recent rent roll and the last 12 months of T-12 income?
- It's been on market 31 days. Have you received any prior offers? Is the seller open to a 6% concession, seller financing, or rate buy-down credit?
- What does the HOA fee cover, when was the last increase, and are there any pending special assessments or reserve-fund shortfalls?
- Is there a deadline driving the sale (1031 exchange, divorce, estate, relocation)? That informs how much negotiation room exists.
- What's the average days-on-market for RENTAL listings here right now (not sales)? A rising rental-DOM trend means longer vacancies and softer asking-rent achievability than the comps imply.
- What's the recent tenant-quality profile in this submarket — average credit score on applications, eviction rate, late-payment / NSF rate, and stable-employment percentage? A property-management company in the area should have these aggregated.
- How much new for-sale + rental construction is in the pipeline within 1–3 miles? Heavy new supply typically softens prices + rents 12–24 months out; constrained supply supports both.
Investment metrics
- 1% rule
- 0.94% ✗
- Cap rate
- 6.16%
- Cash-on-cash
- -0.48%
- DSCR
- 0.98
- GRM
- 8.9
CMA / ARV
- ARV (median comp)
- $403,360
- List price
- $399,000
- Delta
- -1.08%
- Verdict
- FAIR
- Comps
- 20 within 1.0 mi
Show comp detail 9 sales within ~0.75 mi
| Address | Dist | Beds/Ba | Sqft | Sold | Price | $/sf | Match |
|---|---|---|---|---|---|---|---|
| 111 Fairway Dr | 0.12mi | 4/3.0 (+1) | 2,783 (+5%) | 3mo | $375,000 | $135 | 75 |
| 404 Canoe Brook Dr | 0.28mi | 3/3.0 | 2,430 (-9%) | 1mo | $315,000 | $130 | 68 |
| 137 Hillcrest Dr | 0.64mi | 4/2.0 (+1) | 2,480 (-7%) | 2mo | $360,000 | $145 | 52 |
| 205 Waterview Dr | 0.51mi | 3/3.0 | 2,880 (+8%) | 9mo | $395,000 | $137 | 51 |
| 808 Tanager Ct | 0.73mi | 3/2.5 | 2,500 (-6%) | 5mo | $415,000 | $166 | 50 |
| 112 Falling Brook Way | 0.50mi | 4/3.0 (+1) | 2,400 (-10%) | 14mo | $415,000 | $173 | 40 |
| 104 Heron Bay | 0.71mi | 3/2.0 | 2,296 (-14%) | 5mo | $185,000 | $81 | 40 |
| 804 E Whippletree Ct | 0.56mi | 3/2.0 | 2,362 (-11%) | 21mo | $460,000 | $195 | 38 |
| 108 Falling Brook Dr | 0.47mi | 4/2.5 (+1) | 2,964 (+11%) | 23mo | $1,177,500 | $397 | 33 |
Match score weights: distance 35% · size 25% · config 20% · recency 20%. Top-matched comps best support the ARV.
Projected returns pro-forma
10.0% appreciation · 3.0% rent growth · sell at horizon
- IRR
- 24.0%
- Equity multiple
- 2.92×
- Total profit
- $214,688
- Equity at exit
- $359,451
- IRR
- 21.3%
- Equity multiple
- 6.68×
- Total profit
- $634,856
- Equity at exit
- $775,169
Cash invested: $111,720 (down + closing). Projections, not guarantees.
Landlord ↔ Tenant lean methodology
- Overall (STATE)
- 62 Landlord-Friendly
- State Pennsylvania
- 62 Landlord-Friendly · EVEN
- County
- — inherits STATE
- City
- — inherits STATE
ZIP-level market 18428
- Home prices YoY
- 9.2%
- Active inventory
- 371
- Price-to-rent
- 8.9×
Monthly cashflow live
- Estimated rent
- $3,745 medium interval (Pro) →
- Mortgage (P&I)
- −$2,092
- Tax from tax record
- −$494 /mo · $5,930/yr
- Insurance
- −$166
- HOA
- −$250
- Vacancy / Maint / Mgmt
- −$786
- Net cashflow
- $-44
Break-even live
UW: 25.0% down · 7.5% · 30yr · 1.5% tax · 5.0% vac · 8.0% maint · 8.0% mgmt
Financing live
Cash to close
- Down payment
- $99,750
- Closing costs
- $11,970
- Reserves months
- —
- Total cash needed
- —
Loan-product check · same deal, 3 products live
Conventional
25% down · 7.5% · 30yr
- Down + closing
- —
- Monthly P&I
- —
- Monthly cashflow
- —
- DSCR
- —
- Eligible?
- —
Personal DTI + credit; lowest rate.
DSCR
20% down · 8.5% · 30yr
- Down + closing
- —
- Monthly P&I
- —
- Monthly cashflow
- —
- DSCR
- —
- Eligible?
- —
No personal income docs; deal must DSCR.
Hard money
10% down · 12.0% · 12mo
- Down + closing
- —
- Monthly P&I
- —
- Monthly cashflow
- —
- DSCR
- —
- Eligible?
- —
Short-term bridge; refi at stabilization.
Rent comps 2 comps
| Address | Beds | Baths | Sqft | Rent | $/sqft | DOM | Units | Dist |
|---|---|---|---|---|---|---|---|---|
| 402 Canoe Brook Dr Hawley, PA | 3.0 | 2.0 | 2055 | $3,500 | $1.70 | 1d | 1 | 0.23mi |
| 142 Eisenhower Dr Hawley, PA | 3.0 | 2.0 | 2764 | $5,000 | $1.81 | 1d | 1 | 1.50mi |
HOA detail
- Monthly dues
- $250 · $3,000/yr
Listing history 20 events
-
2026-06-18days on market $399,000 Active 31 DOM
-
2026-06-17days on market $399,000 Active 30 DOM
-
2026-06-16days on market $399,000 Active 29 DOM
-
2026-06-15status $399,000 Active 28 DOM
-
2026-06-13statusdays on market $399,000 Pending 28 DOM
-
2026-06-09days on market $399,000 Active 26 DOM
-
2026-06-08days on market $399,000 Active 25 DOM
-
2026-06-07days on market $399,000 Active 24 DOM
-
2026-06-04days on market $399,000 Active 21 DOM
-
2026-06-03days on market $399,000 Active 20 DOM
-
2026-06-02days on market $399,000 Active 19 DOM
-
2026-06-01days on market $399,000 Active 18 DOM
-
2026-05-31days on market $399,000 Active 17 DOM
-
2026-05-14$399,000 Active 1189-char remark
-
2025-09-09price $399,900
-
2025-06-10price $425,000
-
2024-12-09$495,000 Active
-
2024-05-27price $550,000
-
2024-05-08$650,000 Active
-
2005-09-09soldstatus $440,000
ⓘ Source: listings_history table (triggers on properties + properties_extension) + one-shot
backfill from property_details.listing_events for pre-trigger history.
Tax reassessment forecast PA · Partial reset (capped growth)
- Current annual tax
- $5,930 · $494/mo
- Projected year-2 tax
- $6,117 · $510/mo
- Expected delta
- +$187/yr (+$16/mo · 3.2%)
ⓘ Screening estimate from a state-policy table — verify with the county assessor before closing.
Climate risk First Street
- Flood 1/10 Low FEMA zone X (unshaded) · 0% chance over 30 yrs
- Wildfire 5/10 Major
- Heat 2/10 Low 7 d/yr ≥91°F today · 15 d/yr by 30 yrs out
- Wind 3/10 Moderate 7% chance of damaging wind over 30 yrs
- Air quality 2/10 Low 1 unhealthy d/yr today · 2 by 30 yrs out
Nearby sold comps map
Loading sold comps map…
Walkable amenities ~0.75 mi
Loading nearby amenities…
Taxation est. · year 1
- Rental income
- $44,939
- − Mortgage interest
- −$22,350
- − Property taxes
- −$5,930
- − Insurance
- −$1,995
- − Repairs & maintenance
- −$3,595
- − Management
- −$3,595
- − HOA
- −$3,000
- − Depreciation
- −$11,607
- Taxable loss
- −$7,134
- Est. tax savings @ 24.0%
- +$1,712
- After-tax cash flow
- $1,180/yr
For passive investors: Depreciation is non-cash, so a rental often shows a tax loss while cash-flowing — sheltering income. Rental losses are passive: they offset passive income freely, and up to $25,000/yr can offset ordinary (W-2) income if you actively participate and your MAGI is under $100k (phasing out to $0 by $150k); unused losses carry forward. On sale, claimed depreciation is recaptured at up to 25%, and gains may owe capital-gains tax (a 1031 exchange can defer both). Figures are a year-1 estimate at your 24.0% rate — not tax advice; consult a CPA.
Schools (NCES district)
- District
- Wallenpaupack Area SD
- NCES district ID
- 4224750
- Math proficiency
- 39% ▼ -10.00%
- Reading proficiency
- 59% ▼ -5.00%
- Median HH income
- $51,027
- Composite
- 41.97/100
- National rank
- #3345
- State rank
- #192 of 539 in PA
Livability — Hemlock Farms
- Score
- 68/100
- State rank
- #884
- US rank
- #9421
Category grades
Schools grade is shown separately in the Schools card above.
Census & demographics
- Census place
- Hemlock Farms, PA
- Population (ZIP)
- 12,446
Population outlook (Pike County) Hauer SSP2
- Today (2025)
- 53,548 people
- By 2030
- 51,622 · -3.6%
- By 2040
- 46,490 · -13.2%
- By 2050
- 40,372 · -24.6%
- By 2075
- 31,951 · -40.3%
- By 2100
- 26,821 · -49.9%
Race, ethnicity, and origin ACS 2023
- Neighborhood character
- Predominantly White (85%)
- Race & ethnicity
- White 85% Hispanic / Latino 8% Two or more races 6% Black 1% Asian 1%
- Hispanic origin (detail)
- Puerto Rican 5%
- Common ancestry
- Romanian 5% Portuguese 3% Italian 2%
- Foreign-born
- 5% · Canada
- Languages at home
- 91% English-only · Spanish 5% Russian/Polish/Slavic 1% Other Asian/Pacific 1%
Political lean MEDSL · Pike
- 2024 margin
- Strong R (+24.1) · D 37.6% · R 61.6%
- 2008→2024 swing
- -19.8pp toward R · 2008: -4.2pp · 2024: -24.1pp
- All cycles
- 2024: R+24.1 2020: R+19.0 2016: R+26.0 2012: R+11.0 2008: R+4.2
Not yet ingested
- Civics
- —
Market trends
- HPI YoY
- ▲ 28.60%
- Current HPI
- 340.8254
- Rent YoY
- —
- Metro
- —
- State GDP YoY
- ▲ 1.68%
- F500 in state
- 34
Industry mix (Fortune 500 HQ in PA)
| Industry | F500 HQs | Revenue |
|---|---|---|
| Healthcare | 2 | $309B |
|
||
| Insurance | 2 | $27B |
|
||
| Telecommunications / Media | 1 | $124B |
|
||
| Industrial Distribution | 1 | $22B |
|
||
| Financial Services | 1 | $20B |
|
||
| Chemicals / Materials | 1 | $18B |
|
||
Price history
-9.3% since first listed9 events — show timeline
- 2026-06-15 Relisted — PWMLS
- 2026-06-11 Pending — PWMLS
- 2026-05-14 Listed $399,000 PWMLS
- 2025-09-09 Price Changed $399,900 PWMLS
- 2025-06-10 Price Changed $425,000 PWMLS
- 2024-12-09 Listed $495,000 PWMLS
- 2024-05-27 Price Changed $550,000 PWMLS
- 2024-05-08 Listed $650,000 PWMLS
- 2005-09-09 Sold (Public Records) $440,000 Public Records
Property tax history
+2.8%/yrLatest (2026): $5,930 · +3.0% YoY. Source: county tax records.
Cash-flow waterfall
monthlySold comps — $/sqft
last 12 mo · ≤1 miLoading sold comps…