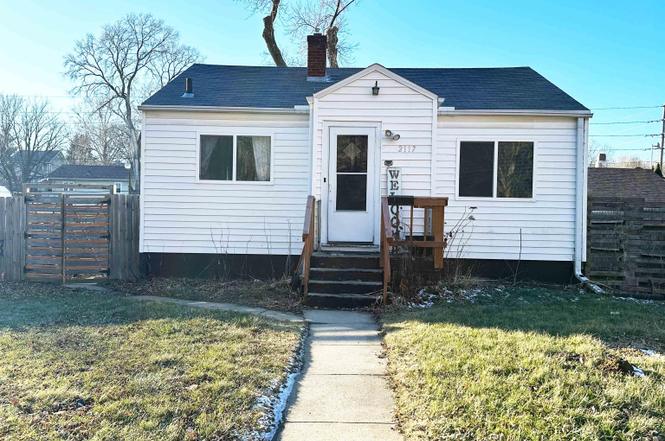
2117 Virginia St · Sioux City, IA
Flood risk 1/10 · Minimal
- FEMA flood zone
- X (unshaded)
- Chance of flooding over 30 yrs
- 0.0%
- Est. flood insurance / yr
- $473 – $860
Fire risk 1/10 · Minimal
- Est. fire insurance / yr
- $902 – $1,676
Heat risk 3/10 · Minor
- Hot days now (above 103°F)
- 7 days/yr
- Hot days in 30 yrs
- 15 days/yr
Wind risk 2/10 · Minimal
- Chance of severe wind over 30 yrs
- —
Air-quality risk 1/10 · Minimal
- Unhealthy air days now
- 0 days/yr
- Unhealthy air days in 30 yrs
- 0 days/yr
Risk factors via First Street. Map © Google.
Why this score? — see what drove the F grade
The composite is a weighted blend of 9 inputs, each scored 0–100. Each bar is that input's sub-score; the figure is the points it added to the 100-point composite (weight × sub-score).
- Cash flow +9.6/30.0
- Schools +4.7/10.0
- Livability +3.9/5.0
- 1% rule +2.7/10.0
- DSCR +2.7/10.0
- Rent growth +2.5/5.0
- Condition / age +2.5/5.0
- ARV discount +0.4/15.0
- Appreciation +0.0/10.0
$150,000
🖨 Deal sheet (PDF) 📄 Offer letter ✓ Due diligence
Listing remarks MLS
Cozy 2 bedroom Ranch home in great location with maintenance free exterior, newer windows, large deck, fenced yard and a 2 car garage. This home is a light equity builder, a little paint and carpet will go along way. Offers to be presented by 3pm Saturday 10-29-2022 and Seller will respond by 5:00pm 10-30-2022
Key facts
- Large deck
- Newer windows
- Vinyl siding
Tags
Neighborhood map
What this means for you Summary
Snapshot
- This is a 2-bed/1.5-bath single-family listed at $150k.
Deal economics
- At list price, monthly cash flow is $-102 ($-1k/yr) — negative.
- To cash-flow at today's rent, offer at most $132k (12.0% below list).
- To meet the 1% rule (rent ≥ 1% of price), the offer needs to be $115k (23.1% below list).
- Recommended offer: $115k (23.1% below list) — sets the bar for 1% rule.
- Cap rate 5.5% vs local median 3.7% in Sioux City — top-decile yield for the area; either an underpriced asset or a hidden risk that comps aren't pricing in. Stress-test before assuming the spread holds.
Location & tenants
- Location reads 78/100 on livability (#138 in IA, #2,544 nationally) — a middle-class / working-renter tenant base. Strengths: cost of living A+, housing A+, health & safety A+; Watch: crime F, commute F.
- Sioux City Community School District (urban): math 54% / reading 57% proficiency, ranked #264 of 289 in IA (top 91%) — acceptable for families but not a draw, mixed tenant base, ~2y average lease.
- Zoned schools: Hunt Elementary School (math 57% / reading 47%, grade C-, #494 of 616 statewide, top 83%, 392 students, 86% FRL); North Middle School (math 46% / reading 50%, grade C-, #224 of 246 statewide, top 91%, 1,224 students, 74% FRL); North High School (math 53% / reading 57%, grade C, #289 of 336 statewide, top 86%, 1,634 students, 64% FRL) — zoned schools average 75% FRL vs 54% district-wide (21 pts higher); higher-poverty schools than district average — tighter screening recommended.
- Market conditions: 121 active listings in the ZIP; 13 comparable units currently listed for rent nearby; rentals lingering (median 46d on market — plan ~5-8 weeks vacancy on turnover, expect pricing pressure); 100% of comp listings sitting > 30 days — soft ceiling on asking rent; solid renter incomes; 170 units permitted in Woodbury County in 2024 (90 in 5+ unit buildings).
Forward outlook
- Local home prices are declining (-3.0%/yr); year-one equity from $1k of loan paydown is wiped out by about $4k of value loss. Plan a longer hold.
Negotiation context
- Only 1 days on market — expect competitive offers; lowballing is unlikely to land.
- 2 sale attempts since 4y ago with the ask held roughly flat each time — persistent listings suggest the price (not the market) is what's stuck; bring a comps-based counter.
Risks & watch-outs
- Watch-outs: built in 1956 — expect roof / HVAC / electrical / plumbing capex.
Questions for the listing agent
- What do current leases actually rent for vs. the listed asking? Can we see a recent rent roll and the last 12 months of T-12 income?
- Built in 1956 — when were the roof, HVAC, electrical panel, plumbing, and water heater last replaced?
- Is there a deadline driving the sale (1031 exchange, divorce, estate, relocation)? That informs how much negotiation room exists.
- Crime grade is F in this area — have there been break-ins, vandalism, or insurance claims at this property in the last 3 years? What carrier currently insures it and at what premium?
- The area grade is low — what's the realistic commute time and amenity access for the typical tenant pool here? Any planned neighborhood developments (good or bad) we should know about?
- What's the average days-on-market for RENTAL listings here right now (not sales)? A rising rental-DOM trend means longer vacancies and softer asking-rent achievability than the comps imply.
- What's the recent tenant-quality profile in this submarket — average credit score on applications, eviction rate, late-payment / NSF rate, and stable-employment percentage? A property-management company in the area should have these aggregated.
- How much new for-sale + rental construction is in the pipeline within 1–3 miles? Heavy new supply typically softens prices + rents 12–24 months out; constrained supply supports both.
Investment metrics
- 1% rule
- 0.77% ✗
- Cap rate
- 5.48%
- Cash-on-cash
- -2.91%
- DSCR
- 0.87
- GRM
- 10.8
CMA / ARV
- ARV (on-the-fly)
- $129,600
- Comps found
- 12
Show comp detail 12 sales within ~0.75 mi
| Address | Dist | Beds/Ba | Sqft | Sold | Price | $/sf | Match |
|---|---|---|---|---|---|---|---|
| 2021 Howard St | 0.34mi | 3/1.0 (+1) | 954 (+6%) | 6mo | $123,600 | $130 | 62 |
| 913 17th St | 0.30mi | 2/2.0 | 780 (-13%) | 6mo | $95,000 | $122 | 57 |
| 30 Stewart Ave | 0.69mi | 2/2.0 | 932 (+4%) | 6mo | $192,500 | $207 | 55 |
| 2734 Virginia St | 0.41mi | 2/1.0 | 936 (+4%) | 21mo | $113,500 | $121 | 55 |
| 1223 26th St | 0.37mi | 2/1.0 | 800 (-11%) | 9mo | $97,060 | $121 | 54 |
| 1318 28th St | 0.54mi | 2/1.0 | 1,003 (+11%) | 0mo | $165,000 | $165 | 53 |
| 511 30th St | 0.72mi | 2/1.0 | 902 (+0%) | 14mo | $194,000 | $215 | 52 |
| 1011 18th St | 0.23mi | 2/1.0 | 1,004 (+12%) | 21mo | $125,000 | $125 | 50 |
| 1603 27th St | 0.57mi | 2/1.0 | 868 (-4%) | 18mo | $124,950 | $144 | 50 |
| 1029 27th St | 0.35mi | 3/1.0 (+1) | 992 (+10%) | 13mo | $130,000 | $131 | 49 |
| 2732 Morgan St | 0.71mi | 2/1.0 | 849 (-6%) | 13mo | $129,500 | $153 | 44 |
| 3007 Nebraska St | 0.72mi | 2/1.0 | 1,015 (+13%) | 8mo | $185,100 | $182 | 36 |
Match score weights: distance 35% · size 25% · config 20% · recency 20%. Top-matched comps best support the ARV.
Projected returns pro-forma
-3.0% appreciation · 3.0% rent growth · sell at horizon
- IRR
- -21.2%
- Equity multiple
- 0.27×
- Total profit
- $-30,793
- Equity at exit
- $22,365
- IRR
- -14.6%
- Equity multiple
- 0.16×
- Total profit
- $-35,157
- Equity at exit
- $12,969
Cash invested: $42,000 (down + closing). Projections, not guarantees.
Landlord ↔ Tenant lean methodology
- Overall (STATE)
- 83 Strongly Landlord-Friendly
- State Iowa
- 83 Strongly Landlord-Friendly · R+6
- County
- — inherits STATE
- City
- — inherits STATE
ZIP-level market 51104
- Home prices YoY
- -34.4%
- Active inventory
- 121
- Price-to-rent
- 10.8×
Monthly cashflow live
- Estimated rent
- $1,154 high interval (Pro) →
- Mortgage (P&I)
- −$787
- Tax from tax record
- −$164 /mo · $1,972/yr
- Insurance
- −$62
- HOA
- −$0
- Vacancy / Maint / Mgmt
- −$242
- Net cashflow
- $-102
Break-even live
Sensitivity live
| Price | -10% $-17 | -5% $-59 | +0% $-102 | +5% $-144 | +10% $-187 |
|---|---|---|---|---|---|
| Rent | -10% $-193 | -5% $-147 | +0% $-102 | +5% $-56 | +10% $-11 |
| Rate | -1.0pp $-26 | -0.5pp $-64 | base $-102 | +0.5pp $-141 | +1.0pp $-180 |
UW: 25.0% down · 7.5% · 30yr · 1.5% tax · 5.0% vac · 8.0% maint · 8.0% mgmt
Financing live
Cash to close
- Down payment
- $37,500
- Closing costs
- $4,500
- Reserves months
- —
- Total cash needed
- —
Loan-product check · same deal, 3 products live
Conventional
25% down · 7.5% · 30yr
- Down + closing
- —
- Monthly P&I
- —
- Monthly cashflow
- —
- DSCR
- —
- Eligible?
- —
Personal DTI + credit; lowest rate.
DSCR
20% down · 8.5% · 30yr
- Down + closing
- —
- Monthly P&I
- —
- Monthly cashflow
- —
- DSCR
- —
- Eligible?
- —
No personal income docs; deal must DSCR.
Hard money
10% down · 12.0% · 12mo
- Down + closing
- —
- Monthly P&I
- —
- Monthly cashflow
- —
- DSCR
- —
- Eligible?
- —
Short-term bridge; refi at stabilization.
Rent comps 13 comps
| Address | Beds | Baths | Sqft | Rent | $/sqft | DOM | Units | Dist |
|---|---|---|---|---|---|---|---|---|
| 301 21st St Sioux City, IA | 1.0 | 1.0 | 600 | $750 | $1.25 | 46d | 2 | 0.45mi |
| 301 21st St Apt E Sioux City, IA | 1.0 | 1.0 | 600 | $775 | $1.29 | 46d | 1 | 0.45mi |
| 1116 13th St Sioux City, IA | 3.0 | 1.0 | 1056 | $1,100 | $1.04 | 46d | 1 | 0.65mi |
| 1114 13th St Unit 1116 Sioux City, IA | 3.0 | 1.0 | 1056 | $1,100 | $1.04 | 46d | 1 | 0.66mi |
| 2722 Prospect St Sioux City, IA | 3.0 | 1.0 | 848 | $1,200 | $1.42 | 46d | 1 | 0.82mi |
| 821 Jackson St Apt 105 Sioux City, IA | 2.0 | 1.0 | 1014 | $1,010 | $1.00 | 46d | 1 | 0.95mi |
| 821 Jackson St Apt 202 Sioux City, IA | 1.0 | 1.0 | 680 | $780 | $1.15 | 46d | 1 | 0.95mi |
| 705 Douglas St Sioux City, IA | 2.0 | 2.0 | 1252 | $1,775 | $1.42 | 46d | 5 | 1.13mi |
| 505 6th St Sioux City, IA | 1.0–2.0 | 1.0 | 830 | $2,100 | $2.53 | 46d | 5 | 1.17mi |
| 301 Wesley Pkwy Sioux City, IA | 1.0 | 1.0 | 620 | $997 | $1.61 | 46d | 1 | 1.34mi |
| 302 Jones St #403 Sioux City, IA | 2.0 | 2.0 | 872 | $1,750 | $2.01 | 46d | 1 | 1.35mi |
| 228 36th St Sioux City, IA | 3.0 | 2.0 | 1092 | $1,500 | $1.37 | 46d | 1 | 1.39mi |
| 130 Nebraska St Sioux City, IA | 1.0–2.0 | 1.0–2.0 | 900 | $1,215 | $1.35 | 46d | 8 | 1.49mi |
Listing history 7 events
-
2026-02-18soldstatus $150,000
-
2026-01-14status Pending
-
2026-01-13$150,000 Active
-
2022-12-14soldstatus $115,000 Closed 311-char remark
Show marketing remark (311 chars)
Cozy 2 bedroom Ranch home in great location with maintenance free exterior, newer windows, large deck, fenced yard and a 2 car garage. This home is a light equity builder, a little paint and carpet will go along way. Offers to be presented by 3pm Saturday 10-29-2022 and Seller will respond by 5:00pm 10-30-2022
-
2022-12-14soldstatus $115,000
Show marketing remark (311 chars)
Cozy 2 bedroom Ranch home in great location with maintenance free exterior, newer windows, large deck, fenced yard and a 2 car garage. This home is a light equity builder, a little paint and carpet will go along way. Offers to be presented by 3pm Saturday 10-29-2022 and Seller will respond by 5:00pm 10-30-2022
-
2022-10-29status Pending 311-char remark
Show marketing remark (311 chars)
Cozy 2 bedroom Ranch home in great location with maintenance free exterior, newer windows, large deck, fenced yard and a 2 car garage. This home is a light equity builder, a little paint and carpet will go along way. Offers to be presented by 3pm Saturday 10-29-2022 and Seller will respond by 5:00pm 10-30-2022
-
2022-10-27$114,900 Active 311-char remark
Show marketing remark (311 chars)
Cozy 2 bedroom Ranch home in great location with maintenance free exterior, newer windows, large deck, fenced yard and a 2 car garage. This home is a light equity builder, a little paint and carpet will go along way. Offers to be presented by 3pm Saturday 10-29-2022 and Seller will respond by 5:00pm 10-30-2022
ⓘ Source: listings_history table (triggers on properties + properties_extension) + one-shot
backfill from property_details.listing_events for pre-trigger history.
Tax reassessment forecast IA · Partial reset (capped growth)
- Current annual tax
- $1,972 · $164/mo
- Projected year-2 tax
- $2,164 · $180/mo
- Expected delta
- +$192/yr (+$16/mo · 9.7%)
ⓘ Screening estimate from a state-policy table — verify with the county assessor before closing.
Climate risk First Street
- Flood 1/10 Low FEMA zone X (unshaded) · 0% chance over 30 yrs
- Wildfire 1/10 Low
- Heat 3/10 Moderate 7 d/yr ≥103°F today · 15 d/yr by 30 yrs out
- Wind 2/10 Low
- Air quality 1/10 Low 0 unhealthy d/yr today · 0 by 30 yrs out
Nearby sold comps map
Loading sold comps map…
Walkable amenities ~0.75 mi
Loading nearby amenities…
Taxation est. · year 1
- Rental income
- $13,846
- − Mortgage interest
- −$8,402
- − Property taxes
- −$1,972
- − Insurance
- −$750
- − Repairs & maintenance
- −$1,108
- − Management
- −$1,108
- − Depreciation
- −$4,364
- Taxable loss
- −$3,857
- Est. tax savings @ 24.0%
- +$926
- After-tax cash flow
- $-297/yr
For passive investors: Depreciation is non-cash, so a rental often shows a tax loss while cash-flowing — sheltering income. Rental losses are passive: they offset passive income freely, and up to $25,000/yr can offset ordinary (W-2) income if you actively participate and your MAGI is under $100k (phasing out to $0 by $150k); unused losses carry forward. On sale, claimed depreciation is recaptured at up to 25%, and gains may owe capital-gains tax (a 1031 exchange can defer both). Figures are a year-1 estimate at your 24.0% rate — not tax advice; consult a CPA.
Schools (NCES district)
- District
- Sioux City Community School District
- NCES district ID
- 1926400
- Math proficiency
- 54% ▼ -7.00%
- Reading proficiency
- 57% ▼ -2.00%
- Median HH income
- $44,967
- Composite
- 46.86/100
- National rank
- #2371
- State rank
- #264 of 289 in IA
Livability — Sioux City
- Score
- 78/100
- State rank
- #138
- US rank
- #2544
Category grades
Schools grade is shown separately in the Schools card above.
Census & demographics
- Census place
- Sioux City, IA
- County
- Woodbury County · 51,789 people
- City population
- 51,789
- Metro
- Sioux City, IA-NE-SD
- Population (ZIP)
- 23,197
- Household income
- $75,362
- Rent vs Own
- Severe rent burden
- 600.0
Population outlook (Woodbury County) Hauer SSP2
- Today (2025)
- 103,226 people
- By 2030
- 103,060 · -0.2%
- By 2040
- 102,533 · -0.7%
- By 2050
- 102,788 · -0.4%
- By 2075
- 107,227 · +3.9%
- By 2100
- 113,980 · +10.4%
Race, ethnicity, and origin ACS 2023
- Neighborhood character
- Majority White (64%)
- Race & ethnicity
- White 64% Hispanic / Latino 20% Two or more races 14% Black 5% Asian 4% Native American 2%
- Hispanic origin (detail)
- Mexican 16%
- Common ancestry
- Portuguese 4% Iranian 2% Romanian 2%
- Foreign-born
- 12% · Canada, Vietnam, United Kingdom
- Languages at home
- 80% English-only · Spanish 13% Other Asian/Pacific 2% Vietnamese 2%
Political lean MEDSL · Woodbury
- 2024 margin
- Strong R (+23.0) · D 37.8% · R 60.9% · Other 1.3%
- 2008→2024 swing
- -22.5pp toward R · 2008: -0.5pp · 2024: -23.0pp
- All cycles
- 2024: R+23.0 2020: R+15.5 2016: R+19.9 2012: R+0.2 2008: R+0.5
Not yet ingested
- Civics
- —
Market trends
- HPI YoY
- ▼ -114.54%
- Current HPI
- 218.5989
- Rent YoY
- —
- Metro
- Sioux City, IA-NE-SD
- State GDP YoY
- ▲ 2.48%
- F500 in state
- 4
Industry mix (Fortune 500 HQ in IA)
| Industry | F500 HQs | Revenue |
|---|---|---|
| Financial Services | 1 | $16B |
|
||
| Retail / Convenience | 1 | $15B |
|
||
Price history
+30.5% since first listed7 events — show timeline
- 2026-02-18 Sold (Public Records) $150,000 Public Records
- 2026-01-14 Pending — NWIA
- 2026-01-13 Listed $150,000 NWIA
- 2022-12-14 Sold (Public Records) $115,000 Public Records
- 2022-12-14 Sold (MLS) $115,000 NWIA
- 2022-10-29 Pending — NWIA
- 2022-10-27 Listed $114,900 NWIA
Property tax history
+5.0%/yrLatest (2025): $1,972 · +4.3% YoY. Source: county tax records.
Cash-flow waterfall
monthlySold comps — $/sqft
last 12 mo · ≤1 miLoading sold comps…