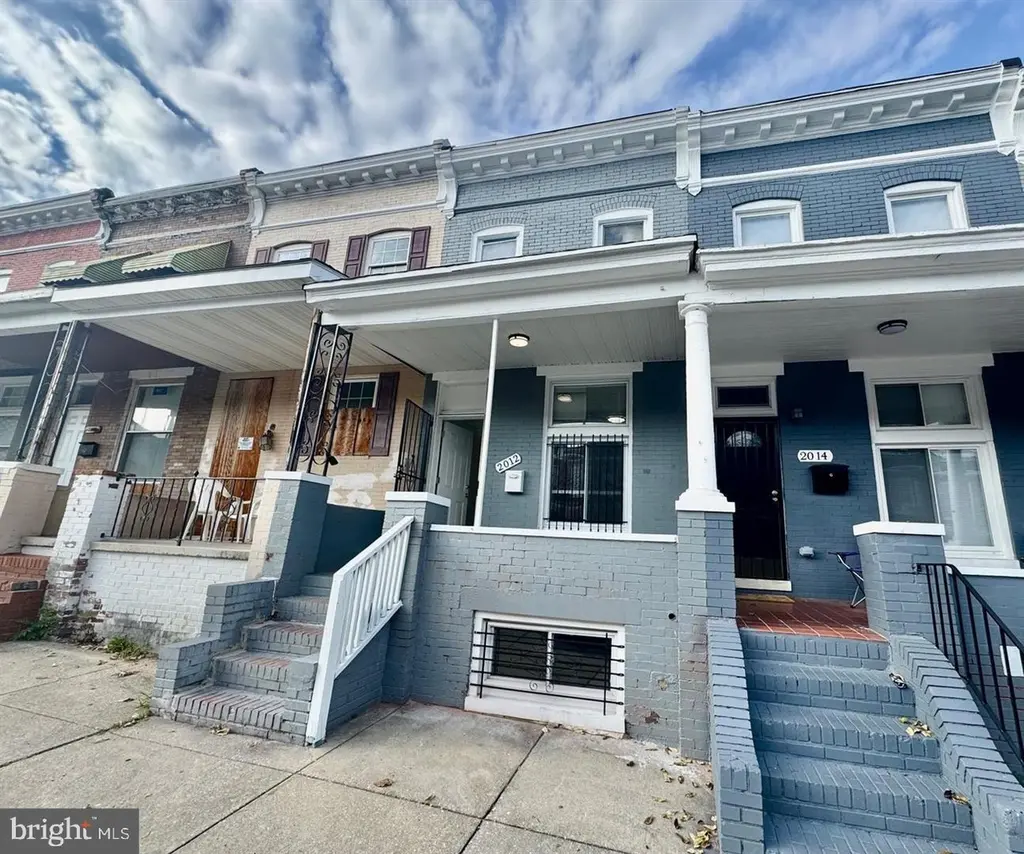
2012 Cliftwood Ave · Baltimore, MD
Flood risk 1/10 · Minimal
- FEMA flood zone
- X (unshaded)
- Chance of flooding over 30 yrs
- 0.0%
- Est. flood insurance / yr
- $507 – $1,088
Fire risk 1/10 · Minimal
- Est. fire insurance / yr
- $755 – $1,403
Heat risk 8/10 · Major
- Hot days now (above 103°F)
- 7 days/yr
- Hot days in 30 yrs
- 15 days/yr
Wind risk 6/10 · Moderate
- Chance of severe wind over 30 yrs
- 27.0%
Air-quality risk 4/10 · Minor
- Unhealthy air days now
- 6 days/yr
- Unhealthy air days in 30 yrs
- 7 days/yr
Risk factors via First Street. Map © Google.
Why this score? — see what drove the B grade
The composite is a weighted blend of 9 inputs, each scored 0–100. Each bar is that input's sub-score; the figure is the points it added to the 100-point composite (weight × sub-score).
- Cash flow +30.0/30.0
- 1% rule +10.0/10.0
- DSCR +10.0/10.0
- ARV discount +7.5/15.0
- Appreciation +4.7/10.0
- Rent growth +3.8/5.0
- Livability +3.8/5.0
- Condition / age +2.5/5.0
- Schools +1.0/10.0
$83,000
🖨 Deal sheet 📄 Offer letter ✓ Due diligence
Listing remarks MLS
PUBLIC ONSITE AUCTION: Wed. Jan 20, 2016 @ 12:35PM. List Price is Suggested Opening Bid Only. 2 Story Townhome in South Clifton Park. Property is Occupied. Believed to Contain: 3BR/1BA. Pre-bid offers accepted. Agents Register Your Clients.
Key facts
- Back patio
- Built 1920
- Listed 32 days
Tags
Property features AI
Finance
- Other: Annual ground rent listed under income/expense
- Financial info: Ownership is Ground Rent; Improvement assessed value reported; Land assessed value reported; Annual taxes reported
Exterior
- Parking: On-street parking
- Utilities: Public water; Public sewer; Electric heating fuel
- Home design: Interior townhouse/rowhouse; Above-grade finished area approximately 1,200 (estimated)
- Construction: Brick construction; Brick/mortar foundation; Other structures above and below grade; Year built estimated
- Exterior features: Ground rent exists (semi‑annual payment of $120)
Interior
- Bedrooms: One bedroom on the main level; Two bedrooms on the first upper level
- Bathrooms: Two full bathrooms (one on the main level, one on the first upper level)
- Heating & cooling: Heat pump with electric backup; Electric hot water
- Interior features: Estimated living area; Unfinished basement
Neighborhood map
What this means for you Summary
Snapshot
- This is a 3-bed/1.0-bath townhouse listed at $83k.
Deal economics
- At list price, monthly cash flow is $852 ($10k/yr) — positive.
- The deal already cash-flows at list — no discount required.
- Meets the 1% rule at list price ($2k rent vs $83k).
- Recommended offer: $81k (3.0% below list) — sets the bar for market timing.
- Cap rate 18.6% vs local median 6.0% in Baltimore — top-decile yield for the area; either an underpriced asset or a hidden risk that comps aren't pricing in. Stress-test before assuming the spread holds.
Location & tenants
- Location reads 76/100 on livability (#90 in MD, #3,396 nationally) — a middle-class / working-renter tenant base. Strengths: amenities A+, commute A+, housing A+; Watch: schools D, crime F.
- Baltimore City Public Schools (urban): math 7% / reading 16% proficiency, ranked #24 of 24 in MD (top 100%) — low school quality limits family demand, transient renter base, plan for 1-2y turnover; 79% free/reduced lunch — lower-income household profile, screen leases tightly.
- Market conditions: Rents rising fast (+5.2%/yr); 319 active listings in the ZIP; 18 comparable units currently listed for rent nearby; rentals at typical pace (median 24d on market — plan ~3-4 weeks tenant-placement turnaround); 1,273 units permitted in Baltimore city in 2024 (1,104 in 5+ unit buildings).
- This rent runs 42% of the median local income ($51k/yr) — at the standard rent-burdened threshold; future hikes will face affordability resistance.
Forward outlook
- In year one you build about $103 of equity ($574 loan paydown + $-471 appreciation (-0.6% local appreciation)).
- Baltimore County population projected to shrink 4% by 2050 — rents likely to lag national; underwrite the cash flow, not the appreciation.
- At projected returns (-0.6% appreciation + 5.2% rent growth), your $23k cash investment doubles in ~3 years — after that, you're playing with house money.
Negotiation context
- It's been on market 33 days — a 3% lower offer ($81k) is reasonable based on typical stale-listing flexibility.
- 6 sale attempts since 11y ago; this cycle's ask has dropped $7k (8%) from the opening price — seller is motivated, your offer sets the floor, not the list.
- Current owner paid $12k; list at $83k implies a 564% gain — meaningful room to come down on a strong offer.
Risks & watch-outs
- Watch-outs: built in 1920 — expect roof / HVAC / electrical / plumbing capex.
- Climate carrying-cost: major wind risk, 27% chance of damaging wind over 30y; extreme-heat days projected 7→15/yr by 2055 (HVAC capex compounding) — expect insurance premiums to compound above CPI over the hold.
Questions for the listing agent
- It's been on market 33 days. Have you received any prior offers? Is the seller open to a 3% concession, seller financing, or rate buy-down credit?
- Built in 1920 — when were the roof, HVAC, electrical panel, plumbing, and water heater last replaced?
- Is there a deadline driving the sale (1031 exchange, divorce, estate, relocation)? That informs how much negotiation room exists.
- Schools are D-rated, which usually means shorter tenancies and higher turnover. Who's the typical renter profile here, and what's been the actual vacancy rate?
- Crime grade is F in this area — have there been break-ins, vandalism, or insurance claims at this property in the last 3 years? What carrier currently insures it and at what premium?
- What's the average days-on-market for RENTAL listings here right now (not sales)? A rising rental-DOM trend means longer vacancies and softer asking-rent achievability than the comps imply.
- What's the recent tenant-quality profile in this submarket — average credit score on applications, eviction rate, late-payment / NSF rate, and stable-employment percentage? A property-management company in the area should have these aggregated.
- How much new for-sale + rental construction is in the pipeline within 1–3 miles? Heavy new supply typically softens prices + rents 12–24 months out; constrained supply supports both.
Investment metrics
- 1% rule
- 2.17% ✓
- Cap rate
- 18.61%
- Cash-on-cash
- 44.00%
- DSCR
- 2.96
- GRM
- 3.8
CMA / ARV
No comps found within radius.
Projected returns pro-forma
-0.57% appreciation · 5.25% rent growth · sell at horizon
- IRR
- 46.7%
- Equity multiple
- 3.32×
- Total profit
- $53,842
- Equity at exit
- $21,770
- IRR
- 51.1%
- Equity multiple
- 7.16×
- Total profit
- $143,226
- Equity at exit
- $24,374
Cash invested: $23,240 (down + closing). Projections, not guarantees.
Landlord ↔ Tenant lean methodology
- Overall (CITY)
- 12 Strongly Tenant-Friendly
- State Maryland
- 27 Tenant-Leaning · D+14
- County
- — inherits STATE
- City Baltimore
- 12 Strongly Tenant-Friendly · D+58
ZIP-level market 21213
- Home prices YoY
- -0.1%
- Rents YoY
- 5.2%
- Active inventory
- 319
- Price-to-rent
- 3.8×
Monthly cashflow live
- Estimated rent
- $1,798 high interval (Pro) →
- Mortgage (P&I)
- −$435
- Tax from tax record
- −$98 /mo · $1,177/yr
- Insurance
- −$35
- HOA
- −$0
- Vacancy / Maint / Mgmt
- −$377
- Net cashflow
- $852
Break-even live
UW: 25.0% down · 7.5% · 30yr · 1.5% tax · 5.0% vac · 8.0% maint · 8.0% mgmt
Financing live
Cash to close
- Down payment
- $20,750
- Closing costs
- $2,490
- Reserves months
- —
- Total cash needed
- —
Loan-product check · same deal, 3 products live
Conventional
25% down · 7.5% · 30yr
- Down + closing
- —
- Monthly P&I
- —
- Monthly cashflow
- —
- DSCR
- —
- Eligible?
- —
Personal DTI + credit; lowest rate.
DSCR
20% down · 8.5% · 30yr
- Down + closing
- —
- Monthly P&I
- —
- Monthly cashflow
- —
- DSCR
- —
- Eligible?
- —
No personal income docs; deal must DSCR.
Hard money
10% down · 12.0% · 12mo
- Down + closing
- —
- Monthly P&I
- —
- Monthly cashflow
- —
- DSCR
- —
- Eligible?
- —
Short-term bridge; refi at stabilization.
Rent comps 18 comps
| Address | Beds | Baths | Sqft | Rent | $/sqft | DOM | Units | Dist |
|---|---|---|---|---|---|---|---|---|
| 2410 E Federal St Baltimore, MD | 4.0 | 2.0 | 720 | $2,200 | $3.06 | 23d | 1 | 0.47mi |
| 2221 E Preston St Baltimore, MD | 2.0 | 1.0 | 658 | $1,200 | $1.82 | 23d | 1 | 0.61mi |
| 1607 Hakesley Pl Baltimore, MD | 3.0 | 1.0 | 720 | $1,400 | $1.94 | 43d | 1 | 0.72mi |
| 3221 The Alameda Unit 2 Baltimore, MD | 2.0 | 1.0 | 750 | $1,200 | $1.60 | 23d | 1 | 0.99mi |
| 2821 Mathews St Unit 27-668 Baltimore, MD | 2.0 | 1.0 | 730 | $1,050 | $1.44 | 23d | 1 | 1.10mi |
| 1708 Latrobe St Baltimore, MD | 2.0 | 1.0 | 750 | $2,250 | $3.00 | 23d | 1 | 1.21mi |
| 231 E North Ave Baltimore, MD | 3.0 | 1.0 | 430 | $1,200 | $2.79 | 16d | 3 | 1.23mi |
| 1100 Greenmount Ave Baltimore, MD | 1.0–3.0 | 1.0–2.0 | 839 | $2,584 | $3.08 | 2d | 1 | 1.23mi |
| 500 N Rose St Baltimore, MD | 3.0 | 2.0 | 520 | $1,200 | $2.31 | 4d | 1 | 1.25mi |
| 1040 E 33rd St Baltimore, MD | 1.0–2.0 | 1.0–2.0 | 775 | $1,525 | $1.97 | 2d | 10 | 1.27mi |
| 520 Somerset St Baltimore, MD | 1.0–2.0 | 1.0–2.0 | 634 | $1,578 | $2.49 | 43d | 1 | 1.34mi |
| 2315 St Paul St Baltimore, MD | 1.0–2.0 | 1.0 | 579 | $1,595 | $2.75 | 1d | 5 | 1.35mi |
| 1312 Guilford Ave Baltimore, MD | 1.0–2.0 | 1.0–2.0 | 1040 | $1,850 | $1.78 | 43d | 6 | 1.35mi |
| 103 E Mt Royal Ave Baltimore, MD | 1.0–3.0 | 1.0–2.0 | 850 | $2,624 | $3.09 | 1d | 17 | 1.40mi |
| 214 E Chase St Unit 2 Baltimore, MD | 2.0 | 1.0 | 600 | $1,185 | $1.98 | 43d | 1 | 1.42mi |
| 1301 Saint Paul St Baltimore, MD | 3.0 | 1.0–3.0 | 1050 | $2,399 | $2.28 | 43d | 1 | 1.45mi |
| 1101 N Calvert St Baltimore, MD | 2.0 | 1.0–2.0 | 910 | $2,274 | $2.50 | 1d | 19 | 1.46mi |
| 9 E Mount Royal Ave Baltimore, MD | 1.0–2.0 | 1.0–2.0 | 724 | $2,495 | $3.44 | 1d | 15 | 1.50mi |
Listing history 27 events
-
2026-06-15days on market $83,000 Active 33 DOM
-
2026-06-13days on market $83,000 Active 31 DOM
-
2026-06-09days on market $83,000 Active 27 DOM
-
2026-06-08days on market $83,000 Active 26 DOM
-
2026-06-07days on market $83,000 Active 25 DOM
-
2026-06-04pricedays on market $83,000 Active 22 DOM
-
2026-06-03days on market $90,000 Active 21 DOM
-
2026-06-02days on market $90,000 Active 20 DOM
-
2026-06-01days on market $90,000 Active 19 DOM
-
2026-05-31days on market $90,000 Active 18 DOM
-
2026-05-19status Active
-
2026-05-14historical Active Under Contract
-
2026-05-08$90,000 Active
-
2026-03-02historical
-
2026-01-17price $104,900
-
2026-01-16status Active
-
2026-01-09historical Active Under Contract
-
2025-12-24price $109,000
-
2025-11-19price $114,900
-
2025-10-23price $115,000
-
2025-10-03$120,000 Active
-
2016-02-15historical 240-char remark
Show marketing remark (240 chars)
PUBLIC ONSITE AUCTION: Wed. Jan 20, 2016 @ 12:35PM. List Price is Suggested Opening Bid Only. 2 Story Townhome in South Clifton Park. Property is Occupied. Believed to Contain: 3BR/1BA. Pre-bid offers accepted. Agents Register Your Clients.
-
2016-02-12soldstatus $12,500 240-char remark
Show marketing remark (240 chars)
PUBLIC ONSITE AUCTION: Wed. Jan 20, 2016 @ 12:35PM. List Price is Suggested Opening Bid Only. 2 Story Townhome in South Clifton Park. Property is Occupied. Believed to Contain: 3BR/1BA. Pre-bid offers accepted. Agents Register Your Clients.
-
2016-02-12soldstatus $12,500 Sold
Show marketing remark (240 chars)
PUBLIC ONSITE AUCTION: Wed. Jan 20, 2016 @ 12:35PM. List Price is Suggested Opening Bid Only. 2 Story Townhome in South Clifton Park. Property is Occupied. Believed to Contain: 3BR/1BA. Pre-bid offers accepted. Agents Register Your Clients.
-
2016-01-20status Contract
-
2015-12-31$10,000 Active
Show marketing remark (240 chars)
PUBLIC ONSITE AUCTION: Wed. Jan 20, 2016 @ 12:35PM. List Price is Suggested Opening Bid Only. 2 Story Townhome in South Clifton Park. Property is Occupied. Believed to Contain: 3BR/1BA. Pre-bid offers accepted. Agents Register Your Clients.
-
2015-12-31$10,000 240-char remark
Show marketing remark (240 chars)
PUBLIC ONSITE AUCTION: Wed. Jan 20, 2016 @ 12:35PM. List Price is Suggested Opening Bid Only. 2 Story Townhome in South Clifton Park. Property is Occupied. Believed to Contain: 3BR/1BA. Pre-bid offers accepted. Agents Register Your Clients.
ⓘ Source: listings_history table (triggers on properties + properties_extension) + one-shot
backfill from property_details.listing_events for pre-trigger history.
Tax reassessment forecast MD · Partial reset (capped growth)
- Current annual tax
- $1,177 · $98/mo
- Projected year-2 tax
- $1,177 · $98/mo
- Expected delta
- $0/yr ($0/mo · 0.0%)
ⓘ Screening estimate from a state-policy table — verify with the county assessor before closing.
Climate risk First Street
- Flood 1/10 Low FEMA zone X (unshaded) · 0% chance over 30 yrs
- Wildfire 1/10 Low
- Heat 8/10 Severe 7 d/yr ≥103°F today · 15 d/yr by 30 yrs out
- Wind 6/10 Major 27% chance of damaging wind over 30 yrs
- Air quality 4/10 Moderate 6 unhealthy d/yr today · 7 by 30 yrs out
Nearby sold comps map
Loading sold comps map…
Walkable amenities ~0.75 mi
Loading nearby amenities…
Taxation est. · year 1
- Rental income
- $21,571
- − Mortgage interest
- −$4,649
- − Property taxes
- −$1,177
- − Insurance
- −$415
- − Repairs & maintenance
- −$1,726
- − Management
- −$1,726
- − Depreciation
- −$2,415
- Taxable income
- $9,464
- Est. tax owed @ 24.0%
- −$2,271
- After-tax cash flow
- $7,955/yr
For passive investors: Depreciation is non-cash, so a rental often shows a tax loss while cash-flowing — sheltering income. Rental losses are passive: they offset passive income freely, and up to $25,000/yr can offset ordinary (W-2) income if you actively participate and your MAGI is under $100k (phasing out to $0 by $150k); unused losses carry forward. On sale, claimed depreciation is recaptured at up to 25%, and gains may owe capital-gains tax (a 1031 exchange can defer both). Figures are a year-1 estimate at your 24.0% rate — not tax advice; consult a CPA.
Schools (NCES district)
- District
- Baltimore City Public Schools
- NCES district ID
- 2400090
- Math proficiency
- 7% ▼ -9.00%
- Reading proficiency
- 16% ▼ -5.00%
- Median HH income
- $42,108
- Composite
- 10.08/100
- National rank
- #9805
- State rank
- #24 of 24 in MD
Livability — Baltimore
- Score
- 76/100
- State rank
- #90
- US rank
- #3396
Category grades
Schools grade is shown separately in the Schools card above.
Census & demographics
- Census place
- Baltimore, MD
- County
- Baltimore City · 558,601 people
- City population
- 588,727
- Metro
- Baltimore-Columbia-Towson, MD
- Population (ZIP)
- 28,058
- Household income
- $51,344
- Rent vs Own
- Severe rent burden
- 1868.0
Population outlook (Baltimore County) Hauer SSP2
- Today (2025)
- 624,249 people
- By 2030
- 621,541 · -0.4%
- By 2040
- 609,756 · -2.3%
- By 2050
- 597,249 · -4.3%
- By 2075
- 552,236 · -11.5%
- By 2100
- 513,934 · -17.7%
Race, ethnicity, and origin ACS 2023
- Neighborhood character
- Predominantly Black (86%)
- Race & ethnicity
- Black 86% White 6% Hispanic / Latino 4% Two or more races 3%
- Foreign-born
- 3% · Canada
- Languages at home
- 96% English-only · Spanish 3%
Political lean MEDSL · Baltimore
- 2024 margin
- Solid D (+73.0) · D 85.2% · R 12.2% · Other 2.6%
- 2008→2024 swing
- -2.5pp toward R · 2008: 75.5pp · 2024: 73.0pp
- All cycles
- 2024: D+73.0 2020: D+76.6 2016: D+74.6 2012: D+76.4 2008: D+75.5
Not yet ingested
- Civics
- —
Market trends
- HPI YoY
- ▼ -0.57%
- Current HPI
- 427.4453
- Rent YoY
- ▲ 5.25%
- Metro
- Baltimore-Columbia-Towson, MD
- State GDP YoY
- ▲ 2.97%
- F500 in state
- 12
Industry mix (Fortune 500 HQ in MD)
| Industry | F500 HQs | Revenue |
|---|---|---|
| Aerospace / Defense | 1 | $71B |
|
||
| Utilities | 1 | $25B |
|
||
| Hotels | 1 | $24B |
|
||
| Consumer Goods | 1 | $7B |
|
||
| Real Estate | 1 | $6B |
|
||
| Chemicals | 1 | $2B |
|
||
Price history
+800.0% since first listed17 events — show timeline
- 2026-05-19 Relisted — BRIGHT MLS
- 2026-05-14 Contingent — BRIGHT MLS
- 2026-05-08 Listed $90,000 BRIGHT MLS
- 2026-03-02 Listing Removed — BRIGHT MLS
- 2026-01-17 Price Changed $104,900 BRIGHT MLS
- 2026-01-16 Relisted — BRIGHT MLS
- 2026-01-09 Contingent — BRIGHT MLS
- 2025-12-24 Price Changed $109,000 BRIGHT MLS
- 2025-11-19 Price Changed $114,900 BRIGHT MLS
- 2025-10-23 Price Changed $115,000 BRIGHT MLS
- 2025-10-03 Listed $120,000 BRIGHT MLS
- 2016-02-15 Listing Removed — BRIGHT MLS
- 2016-02-12 Sold (MLS) $12,500 MRIS
- 2016-02-12 Sold (MLS) $12,500 BRIGHT MLS
- 2016-01-20 Pending — MRIS
- 2015-12-31 Listed $10,000 MRIS
- 2015-12-31 Listed $10,000 BRIGHT MLS
Property tax history
+5.9%/yrLatest (2025): $1,177 · +17.2% YoY. Source: county tax records.
Cash-flow waterfall
monthlySold comps — $/sqft
last 12 mo · ≤1 miLoading sold comps…