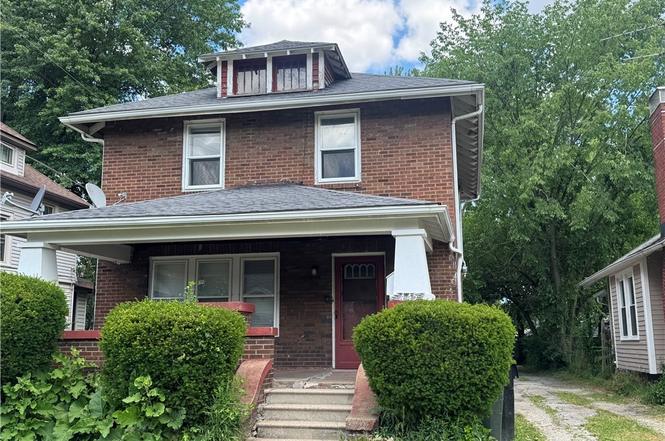
445 10th St · Elyria, OH
Flood risk 1/10 · Minimal
- FEMA flood zone
- X (unshaded)
- Chance of flooding over 30 yrs
- 0.0%
- Est. flood insurance / yr
- $507 – $1,088
Fire risk 1/10 · Minimal
- Est. fire insurance / yr
- $713 – $1,323
Heat risk 3/10 · Minor
- Hot days now (above 98°F)
- 7 days/yr
- Hot days in 30 yrs
- 16 days/yr
Wind risk 1/10 · Minimal
- Chance of severe wind over 30 yrs
- —
Air-quality risk 3/10 · Minor
- Unhealthy air days now
- 2 days/yr
- Unhealthy air days in 30 yrs
- 4 days/yr
Risk factors via First Street. Map © Google.
Why this score? — see what drove the C grade
The composite is a weighted blend of 9 inputs, each scored 0–100. Each bar is that input's sub-score; the figure is the points it added to the 100-point composite (weight × sub-score).
- Cash flow +21.8/30.0
- ARV discount +9.2/15.0
- DSCR +7.0/10.0
- 1% rule +5.4/10.0
- Rent growth +4.2/5.0
- Livability +3.8/5.0
- Condition / age +2.5/5.0
- Schools +2.4/10.0
- Appreciation +0.0/10.0
$125,000
🖨 Deal sheet (PDF) 📄 Offer letter ✓ Due diligence
Listing remarks MLS
Stately, updated brick home combines old world charm with today's modern amenities. Home sits on peaceful street just steps from the Black River with a large front porch. Completely updated in 2023, this home is ready for you to move in! Freshly painted in today's colors. All new cabinets and countertops line the home's kitchen. Cleanup is easy in the new dual sink with high arched faucet. Enjoy cozy meals in the separate eating or prep space with built in pantry. The luxury vinyl plank floors flow from the kitchen into the formal dining room, the perfect space for large family meals and hosting holiday dinners. Keep glassware and special dishes for family celebrations in two built in corner cabinets. The focal point of the living room is the electric fireplace with bookshelves for keeping knick knacks, family photos and precious memories. New carpet in living room 2/2023. Upstairs all three bedrooms have newer carpet. The full bath has been refurbished with shelf surround/tub a
Key facts
- Formal dining room
- Updated kitchen
- Electric fireplace
Tags
Neighborhood map
What this means for you Summary
Snapshot
- This is a 4-bed/1.0-bath single-family listed at $125k.
Deal economics
- At list price, monthly cash flow is $195 ($2k/yr) — positive.
- The deal already cash-flows at list — no discount required.
- Meets the 1% rule at list price ($1k rent vs $125k).
- Cap rate 8.2% vs local median 4.0% in Elyria — top-decile yield for the area; either an underpriced asset or a hidden risk that comps aren't pricing in. Stress-test before assuming the spread holds.
Location & tenants
- Location reads 75/100 on livability (#243 in OH, #3,869 nationally) — a middle-class / working-renter tenant base. Strengths: cost of living A+, housing A+, health & safety A; Watch: employment D, commute F.
- Elyria City Schools (urban): math 21% / reading 37% proficiency, ranked #586 of 656 in OH (top 89%) — low school quality limits family demand, transient renter base, plan for 1-2y turnover.
- Zoned schools: Hamilton Elementary School (math 8% / reading 17%, grade F, #1,434 of 1,584 statewide, top 92%, 421 students, 90% FRL); Eastern Heights Middle School (math 15% / reading 29%, grade F, #602 of 654 statewide, top 93%, 579 students, 100% FRL); Elyria High School (math 20% / reading 47%, grade F, #598 of 781 statewide, top 77%, 1,639 students, 62% FRL) — zoned schools average 84% FRL vs 58% district-wide (26 pts higher); higher-poverty schools than district average — tighter screening recommended.
- Market conditions: Rents rising fast (+6.7%/yr); 361 active listings in the ZIP; 3 comparable units currently listed for rent nearby; rentals leasing fast (median 7d on market — plan ~1-2 weeks tenant-placement turnaround); 1,098 units permitted in Lorain County in 2024 (20 in 5+ unit buildings).
Forward outlook
- Local home prices are declining (-3.0%/yr); year-one equity from $864 of loan paydown is wiped out by about $4k of value loss. Plan a longer hold.
- At projected returns (-3.0% appreciation + 6.7% rent growth), your $35k cash investment doubles in ~10 years — after that, you're playing with house money.
Negotiation context
- Only 2 days on market — expect competitive offers; lowballing is unlikely to land.
- 4 sale attempts since 5y ago with the ask held roughly flat each time — persistent listings suggest the price (not the market) is what's stuck; bring a comps-based counter.
Risks & watch-outs
- Watch-outs: built in 1920 — expect roof / HVAC / electrical / plumbing capex.
Questions for the listing agent
- Built in 1920 — when were the roof, HVAC, electrical panel, plumbing, and water heater last replaced?
- Is there a deadline driving the sale (1031 exchange, divorce, estate, relocation)? That informs how much negotiation room exists.
- What's the average days-on-market for RENTAL listings here right now (not sales)? A rising rental-DOM trend means longer vacancies and softer asking-rent achievability than the comps imply.
- What's the recent tenant-quality profile in this submarket — average credit score on applications, eviction rate, late-payment / NSF rate, and stable-employment percentage? A property-management company in the area should have these aggregated.
- How much new for-sale + rental construction is in the pipeline within 1–3 miles? Heavy new supply typically softens prices + rents 12–24 months out; constrained supply supports both.
Investment metrics
- 1% rule
- 1.04% ✓
- Cap rate
- 8.17%
- Cash-on-cash
- 6.70%
- DSCR
- 1.30
- GRM
- 8.0
CMA / ARV
- ARV (on-the-fly)
- $129,792
- Comps found
- 12
Show comp detail 12 sales within ~0.75 mi
| Address | Dist | Beds/Ba | Sqft | Sold | Price | $/sf | Match |
|---|---|---|---|---|---|---|---|
| 1101 West Ave | 0.14mi | 3/2.0 (-1) | 1,306 (+5%) | 2mo | $168,000 | $129 | 75 |
| 508 12th St | 0.22mi | 3/1.5 (-1) | 1,291 (+3%) | 3mo | $134,050 | $104 | 75 |
| 426 11th St | 0.11mi | 4/1.5 | 1,147 (-8%) | 6mo | $152,000 | $133 | 75 |
| 1122 West Ave | 0.20mi | 4/1.5 | 1,392 (+12%) | 4mo | $140,000 | $101 | 66 |
| 1307 West Ave | 0.29mi | 3/1.5 (-1) | 1,192 (-4%) | 7mo | $137,500 | $115 | 66 |
| 238 George St | 0.39mi | 3/1.0 (-1) | 1,311 (+5%) | 7mo | $135,000 | $103 | 63 |
| 480 10th St | 0.08mi | 3/1.0 (-1) | 1,087 (-13%) | 9mo | $129,900 | $120 | 62 |
| 225 George St | 0.40mi | 4/1.0 | 1,344 (+8%) | 8mo | $91,000 | $68 | 62 |
| 348 11th Ave | 0.20mi | 3/1.0 (-1) | 1,418 (+14%) | 3mo | $75,000 | $53 | 61 |
| 213 Gates Ave | 0.41mi | 3/1.0 (-1) | 1,368 (+10%) | 4mo | $100,000 | $73 | 56 |
| 210 E 15th St | 0.52mi | 3/1.5 (-1) | 1,117 (-10%) | 2mo | $130,000 | $116 | 50 |
| 142 4th St | 0.67mi | 3/1.0 (-1) | 1,428 (+14%) | 4mo | $120,000 | $84 | 36 |
Match score weights: distance 35% · size 25% · config 20% · recency 20%. Top-matched comps best support the ARV.
Projected returns pro-forma
-3.0% appreciation · 6.74% rent growth · sell at horizon
- IRR
- -2.0%
- Equity multiple
- 0.92×
- Total profit
- $-2,738
- Equity at exit
- $18,638
- IRR
- 11.3%
- Equity multiple
- 2.03×
- Total profit
- $36,120
- Equity at exit
- $10,808
Cash invested: $35,000 (down + closing). Projections, not guarantees.
Landlord ↔ Tenant lean methodology
- Overall (STATE)
- 73 Landlord-Friendly
- State Ohio
- 73 Landlord-Friendly · R+6
- County
- — inherits STATE
- City
- — inherits STATE
ZIP-level market 44035
- Rents YoY
- 6.7%
- Active inventory
- 361
- Price-to-rent
- 8.0×
Monthly cashflow live
- Estimated rent
- $1,299 medium interval (Pro) →
- Mortgage (P&I)
- −$656
- Tax from tax record
- −$123 /mo · $1,478/yr
- Insurance
- −$52
- HOA
- −$0
- Lot rent
- −$0
- Vacancy / Maint / Mgmt
- −$273
- Net cashflow
- $195
Break-even live
Sensitivity live
| Price | -10% $266 | -5% $231 | +0% $195 | +5% $160 | +10% $125 |
|---|---|---|---|---|---|
| Rent | -10% $93 | -5% $144 | +0% $195 | +5% $247 | +10% $298 |
| Rate | -1.0pp $258 | -0.5pp $227 | base $195 | +0.5pp $163 | +1.0pp $130 |
UW: 25.0% down · 7.5% · 30yr · 1.5% tax · 5.0% vac · 8.0% maint · 8.0% mgmt
Financing live
Cash to close
- Down payment
- $31,250
- Closing costs
- $3,750
- Reserves months
- —
- Total cash needed
- —
Loan-product check · same deal, 3 products live
Conventional
25% down · 7.5% · 30yr
- Down + closing
- —
- Monthly P&I
- —
- Monthly cashflow
- —
- DSCR
- —
- Eligible?
- —
Personal DTI + credit; lowest rate.
DSCR
20% down · 8.5% · 30yr
- Down + closing
- —
- Monthly P&I
- —
- Monthly cashflow
- —
- DSCR
- —
- Eligible?
- —
No personal income docs; deal must DSCR.
Hard money
10% down · 12.0% · 12mo
- Down + closing
- —
- Monthly P&I
- —
- Monthly cashflow
- —
- DSCR
- —
- Eligible?
- —
Short-term bridge; refi at stabilization.
Rent comps 3 comps
| Address | Beds | Baths | Sqft | Rent | $/sqft | DOM | Units | Dist |
|---|---|---|---|---|---|---|---|---|
| 518 Lake Ave Unit 100 Rush Elyria, OH | 3.0 | 1.0 | 1248 | $1,099 | $0.88 | 6d | 1 | 1.32mi |
| 100 Rush St Elyria, OH | 3.0 | 1.0 | 1248 | $1,099 | $0.88 | 10d | 1 | 1.32mi |
| 10425 Middle Ave Elyria, OH | 3.0–4.0 | 2.0 | 1424 | $1,469 | $1.03 | 0d | 1 | 1.40mi |
Listing history 4 events
-
2026-06-19status $125,000 Pending 2 DOM
-
2026-06-18days on market $125,000 Active 2 DOM
-
2026-06-17remarks 699-char remark
-
2026-06-17$125,000 Active 1 DOM
ⓘ Source: listings_history table (triggers on properties + properties_extension) + one-shot
backfill from property_details.listing_events for pre-trigger history.
Tax reassessment forecast OH · Partial reset (capped growth)
- Current annual tax
- $1,478 · $123/mo
- Projected year-2 tax
- $1,714 · $143/mo
- Expected delta
- +$236/yr (+$20/mo · 16.0%)
ⓘ Screening estimate from a state-policy table — verify with the county assessor before closing.
Climate risk First Street
- Flood 1/10 Low FEMA zone X (unshaded) · 0% chance over 30 yrs
- Wildfire 1/10 Low
- Heat 3/10 Moderate 7 d/yr ≥98°F today · 16 d/yr by 30 yrs out
- Wind 1/10 Low
- Air quality 3/10 Moderate 2 unhealthy d/yr today · 4 by 30 yrs out
Nearby sold comps map
Loading sold comps map…
Walkable amenities ~0.75 mi
Loading nearby amenities…
Taxation est. · year 1
- Rental income
- $15,588
- − Mortgage interest
- −$7,002
- − Property taxes
- −$1,478
- − Insurance
- −$625
- − Repairs & maintenance
- −$1,247
- − Management
- −$1,247
- − Depreciation
- −$3,636
- Taxable income
- $352
- Est. tax owed @ 24.0%
- −$85
- After-tax cash flow
- $2,261/yr
For passive investors: Depreciation is non-cash, so a rental often shows a tax loss while cash-flowing — sheltering income. Rental losses are passive: they offset passive income freely, and up to $25,000/yr can offset ordinary (W-2) income if you actively participate and your MAGI is under $100k (phasing out to $0 by $150k); unused losses carry forward. On sale, claimed depreciation is recaptured at up to 25%, and gains may owe capital-gains tax (a 1031 exchange can defer both). Figures are a year-1 estimate at your 24.0% rate — not tax advice; consult a CPA.
Schools (NCES district)
- District
- Elyria City Schools
- NCES district ID
- 3904394
- Math proficiency
- 21% ▼ -25.00%
- Reading proficiency
- 37% ▼ -15.00%
- Median HH income
- $40,992
- Composite
- 24.45/100
- National rank
- #7670
- State rank
- #586 of 656 in OH
Livability — Elyria
- Score
- 75/100
- State rank
- #243
- US rank
- #3869
Category grades
Schools grade is shown separately in the Schools card above.
Census & demographics
- Census place
- Elyria, OH
- County
- Lorain County · 219,437 people
- City population
- 62,179
- Metro
- Cleveland-Elyria, OH
- Population (ZIP)
- 62,179
- Household income
- $56,408
- Rent vs Own
- Severe rent burden
- 2229.0
Population outlook (Lorain County) Hauer SSP2
- Today (2025)
- 314,924 people
- By 2030
- 317,546 · +0.8%
- By 2040
- 317,962 · +1.0%
- By 2050
- 312,872 · -0.7%
- By 2075
- 301,806 · -4.2%
- By 2100
- 278,271 · -11.6%
Race, ethnicity, and origin ACS 2023
- Neighborhood character
- Predominantly White (70%)
- Race & ethnicity
- White 70% Two or more races 12% Black 11% Hispanic / Latino 10% Asian 1%
- Hispanic origin (detail)
- Mexican 2% Puerto Rican 6%
- Common ancestry
- Romanian 5% Slovak 2% Lithuanian 2%
- Foreign-born
- 2% · China, Canada
- Languages at home
- 94% English-only · Spanish 4% Chinese 1%
Political lean MEDSL · Lorain
- 2024 margin
- Lean R (+5.7) · D 46.7% · R 52.4%
- 2008→2024 swing
- -23.6pp toward R · 2008: 17.9pp · 2024: -5.7pp
- All cycles
- 2024: R+5.7 2020: R+2.5 2016: R+0.3 2012: D+14.4 2008: D+17.9
Not yet ingested
- Civics
- —
Market trends
- HPI YoY
- ▼ -139.09%
- Current HPI
- 199.7354
- Rent YoY
- ▲ 6.74%
- Metro
- Cleveland-Elyria, OH
- State GDP YoY
- ▲ 1.98%
- F500 in state
- 48
Industry mix (Fortune 500 HQ in OH)
| Industry | F500 HQs | Revenue |
|---|---|---|
| Insurance | 3 | $145B |
|
||
| Industrial Machinery | 3 | $49B |
|
||
| Financial Services | 3 | $24B |
|
||
| Consumer Goods | 2 | $93B |
|
||
| Aerospace / Defense | 2 | $47B |
|
||
| Utilities | 2 | $33B |
|
||
Price history
+92.3% since first listed12 events — show timeline
- 2026-06-16 Listed $125,000 MLSNOW
- 2023-04-24 Sold (Public Records) $115,000 Public Records
- 2023-04-12 Pending — MLSNOW
- 2023-04-11 Sold (MLS) $115,000 MLSNOW
- 2023-03-06 Contingent — MLSNOW
- 2023-03-01 Listed $115,000 MLSNOW
- 2021-10-07 Sold (Public Records) $48,000 Public Records
- 2021-10-06 Sold (MLS) $48,000 MLSNOW
- 2021-09-24 Pending — MLSNOW
- 2021-07-13 Relisted — MLSNOW
- 2021-06-28 Pending — MLSNOW
- 2021-05-18 Listed $65,000 MLSNOW
Property tax history
+1.3%/yrLatest (2025): $1,478 · -0.5% YoY. Source: county tax records.
Cash-flow waterfall
monthlySold comps — $/sqft
last 12 mo · ≤1 miLoading sold comps…