78 Shadom Ln · Springs, NY
Flood risk 1/10 · Minimal
- FEMA flood zone
- X (unshaded)
- Chance of flooding over 30 yrs
- 0.0%
- Est. flood insurance / yr
- $473 – $860
Fire risk 1/10 · Minimal
- Est. fire insurance / yr
- $691 – $1,283
Heat risk 4/10 · Minor
- Hot days now (above 89°F)
- 7 days/yr
- Hot days in 30 yrs
- 19 days/yr
Wind risk 8/10 · Major
- Chance of severe wind over 30 yrs
- 80.0%
Air-quality risk 3/10 · Minor
- Unhealthy air days now
- 2 days/yr
- Unhealthy air days in 30 yrs
- 3 days/yr
Risk factors via First Street. Map © Google.
Why this score? — see what drove the B- grade
The composite is a weighted blend of 9 inputs, each scored 0–100. Each bar is that input's sub-score; the figure is the points it added to the 100-point composite (weight × sub-score).
- Cash flow +23.8/30.0
- ARV discount +15.0/15.0
- DSCR +7.7/10.0
- 1% rule +5.3/10.0
- Schools +5.1/10.0
- Rent growth +5.0/5.0
- Livability +3.2/5.0
- Condition / age +2.5/5.0
- Appreciation +0.0/10.0
$1,950,000
🖨 Deal sheet 📄 Offer letter ✓ Due diligence
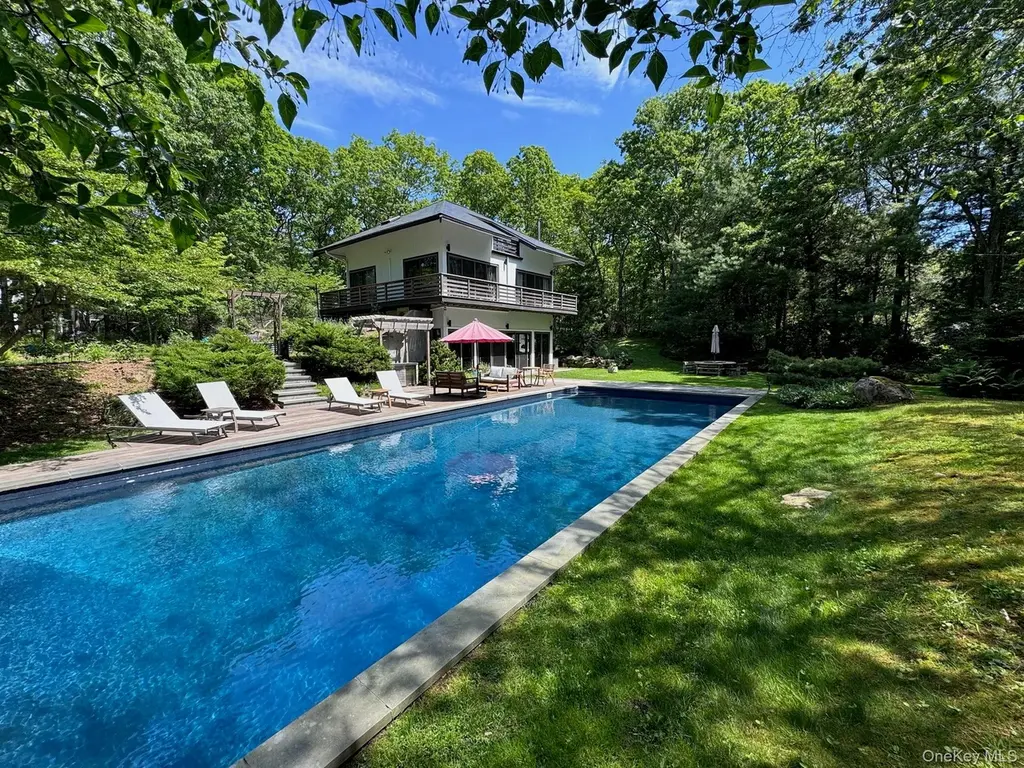
Listing remarks
At the end of a private driveway, set back from the road and surrounded by trees on nearly a full acre, this modern three-story home offers rare privacy minutes from the village and beaches. The grounds center on a large 20x50 ft heated pool with a diving-depth deep end, wrapped by an IPE deck, with a pergola, and a barbecue area. The second floor includes a wrap-around deck, and with a third-floor balcony, there is plenty of outdoor space. Inside: sliding glass doors for that outside-in feel, hardwood floors, and a Danish wood-burning stove for cozy winter nights. The kitchen was rebuilt around a central island with an induction cooktop. Mini-split systems handle year-round heating and coo
Key facts
- Ipe deck
- Barbecue area
- Private driveway
Tags
Property features AI
Exterior
- Parking: Parking for 4 vehicles; Driveway access; Off-street parking; Private parking; Shared driveway; Unpaved parking areas
- Security: Smoke detectors
- Utilities: Electric service by PSEG; Septic tank; Electricity connected; Phone connected; Private trash collection; Solar energy generation
- Home design: Single family residence; Updated/remodeled condition; Three or more levels; Slab foundation; Not waterfront
- Construction: Cedar siding with wood construction; Fiberglass insulation; Vinyl in-ground pool with electric heat
- Exterior features: Wrap-around deck and patio; Balcony; Fire pit; Garden; Rain gutters; Pergola; Full fencing; Back and front yard; Landscaped grounds; Private setting; Level lot; Partially wooded; Front sprinklers
Interior
- Kitchen: Convection oven; Cooktop; Dishwasher; Refrigerator; Freezer; Stainless steel appliances; Kitchen island
- Bedrooms: Total rooms include 7 (bedroom count not specified)
- Flooring: Hardwood; Wood; Ceramic tile; Carpet
- Bathrooms: 2 full bathrooms; 1 half bathroom
- Heating & cooling: Heat pump and wood heating; Ductless and zoned cooling
- Interior features: Ceiling fans; High ceilings; High-speed internet; Kitchen island; Open floorplan with open kitchen; Primary bathroom; Quartz/quartzite counters; Recessed lighting; Storage
- Laundry & utility: Washer and dryer included; Laundry located inside the home, in the kitchen area
Neighborhood map
What this means for you Summary
Snapshot
- This is a 3-bed/2.5-bath single-family listed at $1.95M.
Deal economics
- At list price, monthly cash flow is $4k ($45k/yr) — positive.
- The deal already cash-flows at list — no discount required.
- Meets the 1% rule at list price ($20k rent vs $1.95M).
- Cap rate 8.6% vs local median 11.1% in Springs — below-typical yield; the buyer is paying a premium for something (appreciation thesis, condition, location) that the cap rate doesn't capture.
Location & tenants
- Location reads 63/100 on livability (#809 in NY) — a middle-class / working-renter tenant base. Strengths: crime A+, employment A+; Watch: housing C-, amenities F, commute F.
- Springs Union Free School District (town): math 55% / reading 60% proficiency, ranked #239 of 590 in NY (top 40%) — acceptable for families but not a draw, mixed tenant base, ~2y average lease; only 9% free/reduced lunch — higher-income household profile.
- Zoned schools: Springs School (math 55% / reading 60%, grade C+, #839 of 2,108 statewide, top 40%, 689 students, 0% FRL).
- Market conditions: Rents rising fast (+12.3%/yr); 135 active listings in the ZIP; 10 comparable units currently listed for rent nearby; rentals lingering (median 44d on market — plan ~5-8 weeks vacancy on turnover, expect pricing pressure); 60% of comp listings sitting > 30 days — soft ceiling on asking rent; high-income renter base; 1,366 units permitted in Suffolk County in 2024 (216 in 5+ unit buildings).
- At $20,082/mo this rent would consume 186% of the median local household income ($130k/yr) (locally 896% of renters already pay >50% of income on rent) — very limited rent-growth headroom before tenants either downsize or default.
Forward outlook
- Local home prices are declining (-3.0%/yr); year-one equity from $13k of loan paydown is wiped out by about $58k of value loss. Plan a longer hold.
- Suffolk County population projected to shrink 5% by 2050 — rents likely to lag national; underwrite the cash flow, not the appreciation.
- At projected returns (-3.0% appreciation + 8.0% rent growth), your $546k cash investment doubles in ~8 years — after that, you're playing with house money.
Negotiation context
- Only 9 days on market — expect competitive offers; lowballing is unlikely to land.
- Current owner paid $890k; list at $1.95M implies a 119% gain — meaningful room to come down on a strong offer.
Risks & watch-outs
- Climate carrying-cost: severe wind risk, 80% chance of damaging wind over 30y — expect insurance premiums to compound above CPI over the hold.
Questions for the listing agent
- Is there a deadline driving the sale (1031 exchange, divorce, estate, relocation)? That informs how much negotiation room exists.
- Schools are D-rated, which usually means shorter tenancies and higher turnover. Who's the typical renter profile here, and what's been the actual vacancy rate?
- What's the average days-on-market for RENTAL listings here right now (not sales)? A rising rental-DOM trend means longer vacancies and softer asking-rent achievability than the comps imply.
- What's the recent tenant-quality profile in this submarket — average credit score on applications, eviction rate, late-payment / NSF rate, and stable-employment percentage? A property-management company in the area should have these aggregated.
- How much new for-sale + rental construction is in the pipeline within 1–3 miles? Heavy new supply typically softens prices + rents 12–24 months out; constrained supply supports both.
Investment metrics
- 1% rule
- 1.03% ✓
- Cap rate
- 8.61%
- Cash-on-cash
- 8.26%
- DSCR
- 1.37
- GRM
- 8.1
CMA / ARV
- ARV (on-the-fly)
- $2,746,458
- Comps found
- 3
Show comp detail 3 sales within ~0.75 mi
| Address | Dist | Beds/Ba | Sqft | Sold | Price | $/sf | Match |
|---|---|---|---|---|---|---|---|
| 14 Hill Side Ln | 0.18mi | 3/2.5 | 2,211 (+2%) | 6mo | $2,160,000 | $977 | 84 |
| 25 Oyster Shores Rd | 0.64mi | 4/4.5 (+1) | 2,202 (+1%) | 10mo | $3,700,000 | $1,680 | 47 |
| 17 Island Rd | 0.66mi | 4/3.0 (+1) | 2,300 (+6%) | 24mo | $2,900,000 | $1,261 | 33 |
Match score weights: distance 35% · size 25% · config 20% · recency 20%. Top-matched comps best support the ARV.
Projected returns pro-forma
-3.0% appreciation · 8.0% rent growth · sell at horizon
- IRR
- 1.3%
- Equity multiple
- 1.05×
- Total profit
- $29,012
- Equity at exit
- $290,751
- IRR
- 15.1%
- Equity multiple
- 2.49×
- Total profit
- $814,377
- Equity at exit
- $168,600
Cash invested: $546,000 (down + closing). Projections, not guarantees.
Landlord ↔ Tenant lean methodology
- Overall (STATE)
- 15 Strongly Tenant-Friendly
- State New York
- 15 Strongly Tenant-Friendly · D+10
- County
- — inherits STATE
- City
- — inherits STATE
ZIP-level market 11937
- Rents YoY
- 12.3%
- Active inventory
- 135
- Price-to-rent
- 8.1×
Monthly cashflow live
- Estimated rent
- $20,082 medium interval (Pro) →
- Mortgage (P&I)
- −$10,226
- Tax from tax record
- −$1,067 /mo · $12,805/yr
- Insurance
- −$812
- HOA
- −$0
- Vacancy / Maint / Mgmt
- −$4,217
- Net cashflow
- $3,759
Break-even live
UW: 25.0% down · 7.5% · 30yr · 1.5% tax · 5.0% vac · 8.0% maint · 8.0% mgmt
Financing live
Cash to close
- Down payment
- $487,500
- Closing costs
- $58,500
- Reserves months
- —
- Total cash needed
- —
Loan-product check · same deal, 3 products live
Conventional
25% down · 7.5% · 30yr
- Down + closing
- —
- Monthly P&I
- —
- Monthly cashflow
- —
- DSCR
- —
- Eligible?
- —
Personal DTI + credit; lowest rate.
DSCR
20% down · 8.5% · 30yr
- Down + closing
- —
- Monthly P&I
- —
- Monthly cashflow
- —
- DSCR
- —
- Eligible?
- —
No personal income docs; deal must DSCR.
Hard money
10% down · 12.0% · 12mo
- Down + closing
- —
- Monthly P&I
- —
- Monthly cashflow
- —
- DSCR
- —
- Eligible?
- —
Short-term bridge; refi at stabilization.
Rent comps 10 comps
| Address | Beds | Baths | Sqft | Rent | $/sqft | DOM | Units | Dist |
|---|---|---|---|---|---|---|---|---|
| 20 Howard St East Hampton, NY | 3.0 | 2.5 | 2000 | $75,000 | $37.50 | 22d | 1 | 0.11mi |
| 3 Birdie Ln East Hampton, NY | 3.0 | 2.5 | 2000 | $15,000 | $7.50 | 1d | 1 | 0.53mi |
| 15 Rivers Rd East Hampton, NY | 3.0 | 4.0 | 2400 | $45,000 | $18.75 | 44d | 1 | 0.81mi |
| 202 Treescape Dr Unit 10B East Hampton, NY | 4.0 | 3.0 | 2200 | $50,000 | $22.73 | 24d | 1 | 1.11mi |
| 210 Treescape Dr East Hampton, NY | 3.0 | 2.0 | 2400 | $25,000 | $10.42 | 44d | 1 | 1.13mi |
| 3 Forest Ct East Hampton, NY | 3.0 | 2.0 | 1750 | $50,000 | $28.57 | 24d | 1 | 1.13mi |
| 117 Woodbine Dr East Hampton, NY | 3.0 | 2.0 | 1496 | $65,000 | $43.45 | 44d | 1 | 1.18mi |
| 17 Joshua Edwards Ct East Hampton, NY | 3.0 | 2.0 | 1800 | $40,000 | $22.22 | 44d | 1 | 1.20mi |
| 289 Three Mile Harbor Hog Creek Rd East Hampton, NY | 3.0 | 3.0 | 1600 | $45,600 | $28.50 | 44d | 1 | 1.40mi |
| 23 Wooded Oak Ln East Hampton, NY | 3.0 | 2.0 | 1560 | $25,000 | $16.03 | 44d | 1 | 1.43mi |
Listing history 8 events
-
2026-06-18days on market $1,950,000 Active 9 DOM
-
2026-06-17days on market $1,950,000 Active 8 DOM
-
2026-06-16days on market $1,950,000 Active 7 DOM
-
2026-06-15days on market $1,950,000 Active 6 DOM
-
2026-06-13days on market $1,950,000 Active 4 DOM
-
2026-06-13days on market $1,950,000 Active 3 DOM
-
2026-06-10remarks 699-char remark
-
2026-06-10$1,950,000 Active 1 DOM
ⓘ Source: listings_history table (triggers on properties + properties_extension) + one-shot
backfill from property_details.listing_events for pre-trigger history.
Tax reassessment forecast NY · Partial reset (capped growth)
- Current annual tax
- $12,805 · $1,067/mo
- Projected year-2 tax
- $22,880 · $1,907/mo
- Expected delta
- +$10,075/yr (+$840/mo · 78.7%)
ⓘ Screening estimate from a state-policy table — verify with the county assessor before closing.
Climate risk First Street
- Flood 1/10 Low FEMA zone X (unshaded) · 0% chance over 30 yrs
- Wildfire 1/10 Low
- Heat 4/10 Moderate 7 d/yr ≥89°F today · 19 d/yr by 30 yrs out
- Wind 8/10 Severe 80% chance of damaging wind over 30 yrs
- Air quality 3/10 Moderate 2 unhealthy d/yr today · 3 by 30 yrs out
Nearby sold comps map
Loading sold comps map…
Walkable amenities ~0.75 mi
Loading nearby amenities…
Taxation est. · year 1
- Rental income
- $240,980
- − Mortgage interest
- −$109,230
- − Property taxes
- −$12,805
- − Insurance
- −$9,750
- − Repairs & maintenance
- −$19,278
- − Management
- −$19,278
- − Depreciation
- −$56,727
- Taxable income
- $13,911
- Est. tax owed @ 24.0%
- −$3,339
- After-tax cash flow
- $41,769/yr
For passive investors: Depreciation is non-cash, so a rental often shows a tax loss while cash-flowing — sheltering income. Rental losses are passive: they offset passive income freely, and up to $25,000/yr can offset ordinary (W-2) income if you actively participate and your MAGI is under $100k (phasing out to $0 by $150k); unused losses carry forward. On sale, claimed depreciation is recaptured at up to 25%, and gains may owe capital-gains tax (a 1031 exchange can defer both). Figures are a year-1 estimate at your 24.0% rate — not tax advice; consult a CPA.
Schools (NCES district)
- District
- Springs Union Free School District
- NCES district ID
- 3627900
- Math proficiency
- 55% ▲ 6.00%
- Reading proficiency
- 60% ▲ 10.00%
- Median HH income
- $75,413
- Composite
- 51.42/100
- National rank
- #1728
- State rank
- #239 of 590 in NY
Livability — Springs
- Score
- 63/100
- State rank
- #809
- US rank
- #15666
Category grades
Schools grade is shown separately in the Schools card above.
Census & demographics
- Census place
- Springs, NY
- County
- Suffolk County · 679,920 people
- Metro
- New York-Newark-Jersey City, NY-NJ-PA
- Population (ZIP)
- 21,882
- Household income
- $129,883
- Rent vs Own
- Severe rent burden
- 896.0
Population outlook (Suffolk County) Hauer SSP2
- Today (2025)
- 1,505,262 people
- By 2030
- 1,498,318 · -0.5%
- By 2040
- 1,471,101 · -2.3%
- By 2050
- 1,424,848 · -5.3%
- By 2075
- 1,337,157 · -11.2%
- By 2100
- 1,217,720 · -19.1%
Race, ethnicity, and origin ACS 2023
- Neighborhood character
- Majority White (61%)
- Race & ethnicity
- White 61% Hispanic / Latino 32% Two or more races 23% Black 2% Asian 2%
- Hispanic origin (detail)
- Mexican 2% Puerto Rican 1%
- Common ancestry
- Romanian 5% Scotch-Irish 4% Italian 2%
- Foreign-born
- 25% · Canada, Guatemala, Jamaica
- Languages at home
- 68% English-only · Spanish 28% Other Indo-European 1% Russian/Polish/Slavic 1%
Political lean MEDSL · Suffolk
- 2024 margin
- Lean R (+10.0) · D 45.0% · R 55.0%
- 2008→2024 swing
- -16.0pp toward R · 2008: 6.0pp · 2024: -10.0pp
- All cycles
- 2024: R+10.0 2020: R+0.0 2016: R+8.2 2012: D+2.9 2008: D+6.0
Not yet ingested
- Civics
- —
Market trends
- HPI YoY
- ▼ -285.21%
- Current HPI
- 444.1499
- Rent YoY
- ▲ 12.28%
- Metro
- New York-Newark-Jersey City, NY-NJ-PA
- State GDP YoY
- ▲ 2.60%
- F500 in state
- 92
Industry mix (Fortune 500 HQ in NY)
| Industry | F500 HQs | Revenue |
|---|---|---|
| Financial Services | 10 | $950B |
|
||
| Consumer Goods | 9 | $162B |
|
||
| Insurance | 4 | $225B |
|
||
| Telecommunications | 2 | $144B |
|
||
| Pharmaceuticals | 2 | $112B |
|
||
| Media / Entertainment | 2 | $69B |
|
||
Price history
+139.3% since first listed4 events — show timeline
- 2026-06-08 Listed $1,950,000 OneKey® MLS as Distributed by MLS Grid
- 2016-12-23 Sold (Public Records) $890,000 Public Records
- 2013-09-23 Sold (Public Records) $855,000 Public Records
- 2006-01-20 Sold (Public Records) $815,000 Public Records
Property tax history
+1.0%/yrLatest (2025): $12,805 · +0.0% YoY. Source: county tax records.
Cash-flow waterfall
monthlySold comps — $/sqft
last 12 mo · ≤1 miLoading sold comps…