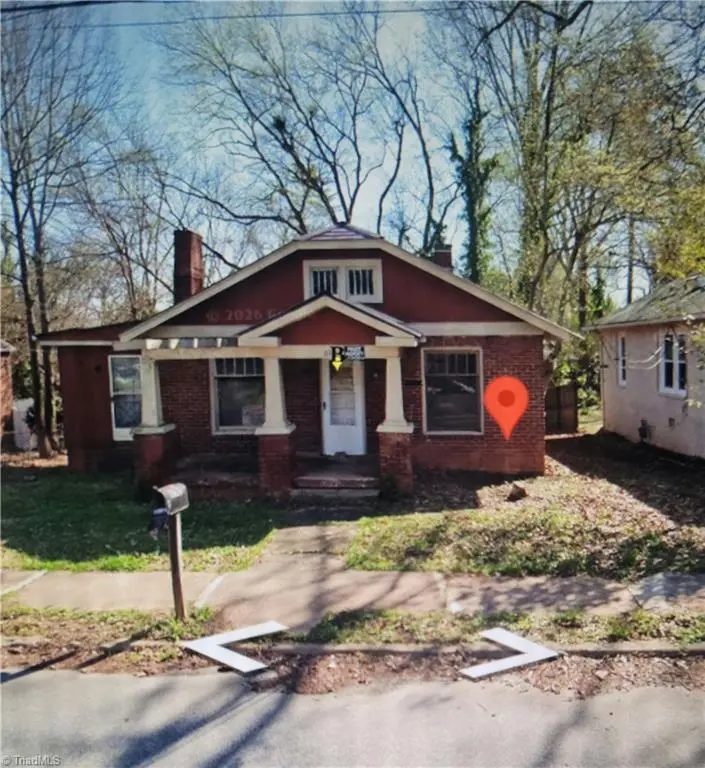
613 Westside Dr · Lexington, NC
Flood risk 1/10 · Minimal
- FEMA flood zone
- X (unshaded)
- Chance of flooding over 30 yrs
- 0.0%
- Est. flood insurance / yr
- $473 – $860
Fire risk 1/10 · Minimal
- Est. fire insurance / yr
- $906 – $1,684
Heat risk 6/10 · Moderate
- Hot days now (above 104°F)
- 7 days/yr
- Hot days in 30 yrs
- 17 days/yr
Wind risk 4/10 · Minor
- Chance of severe wind over 30 yrs
- 13.0%
Air-quality risk 2/10 · Minimal
- Unhealthy air days now
- 1 days/yr
- Unhealthy air days in 30 yrs
- 2 days/yr
Risk factors via First Street. Map © Google.
Why this score? — see what drove the B grade
The composite is a weighted blend of 9 inputs, each scored 0–100. Each bar is that input's sub-score; the figure is the points it added to the 100-point composite (weight × sub-score).
- Cash flow +29.4/30.0
- ARV discount +15.0/15.0
- DSCR +10.0/10.0
- 1% rule +7.5/10.0
- Livability +3.6/5.0
- Rent growth +2.8/5.0
- Schools +2.8/10.0
- Condition / age +2.5/5.0
- Appreciation +0.0/10.0
$106,000
🖨 Deal sheet 📄 Offer letter ✓ Due diligence
Listing remarks
* Sold as is * New listing price reflects seller's minimum acceptable by seller Great opportunity for investors or first time home buyer, rehab loans, etc Seller has never lived in the home all info to be verified by buyer and buyer's agent. NO POWER AND WATER.
Key facts
- 6,534 sq ft lot
- Built 1932
- Listed 56 days
Property features AI
Finance
- HOA & community: No association; Subdivision: Oak Crest
Exterior
- Parking: Driveway
- Utilities: Public sewer; Water heater: Unknown
- Home design: Residential stick/site-built house; One story; Built in 1932; Existing structure
- Construction: Brick construction; See remarks regarding construction details; Crawl space foundation
- Exterior features: Public maintained road access; Public water
Interior
- Kitchen: Kitchen on the main level
- Bedrooms: Bedrooms located on the main level
- Bathrooms: 1 full bathroom
- Heating & cooling: Cooling: Other; Heating: See remarks
- Interior features: Primary bedroom located on the main level
Neighborhood map
What this means for you Summary
Snapshot
- This is a 3-bed/1.0-bath single-family listed at $106k.
Deal economics
- At list price, monthly cash flow is $377 ($5k/yr) — positive.
- The deal already cash-flows at list — no discount required.
- Meets the 1% rule at list price ($1k rent vs $106k).
- Recommended offer: $103k (3.0% below list) — sets the bar for market timing.
- Cap rate 10.6% vs local median 3.5% in Lexington — top-decile yield for the area; either an underpriced asset or a hidden risk that comps aren't pricing in. Stress-test before assuming the spread holds.
Location & tenants
- Location reads 72/100 on livability (#89 in NC) — a middle-class / working-renter tenant base. Strengths: commute A+, cost of living A+, health & safety A+; Watch: schools D, crime F, amenities D-.
- Lexington City Schools (suburban): math 32% / reading 38% proficiency, ranked #136 of 178 in NC (top 76%) — families likely to look elsewhere, expect single-tenant / working-renter base with shorter leases; 78% free/reduced lunch — lower-income household profile, screen leases tightly.
- Market conditions: Rents rising (+1.4%/yr); 400 active listings in the ZIP; 8 comparable units currently listed for rent nearby; rentals at typical pace (median 22d on market — plan ~3-4 weeks tenant-placement turnaround); 990 units permitted in Davidson County in 2024 (54 in 5+ unit buildings).
Forward outlook
- Local home prices are declining (-3.0%/yr); year-one equity from $733 of loan paydown is wiped out by about $3k of value loss. Plan a longer hold.
- Davidson County population projected to shrink 6% by 2050 — rents likely to lag national; underwrite the cash flow, not the appreciation.
- At projected returns (-3.0% appreciation + 1.4% rent growth), your $30k cash investment doubles in ~10 years — after that, you're playing with house money.
Negotiation context
- It's been on market 56 days — a 3% lower offer ($103k) is reasonable based on typical stale-listing flexibility.
- Current owner paid $8k; list at $106k implies a 1147% gain — meaningful room to come down on a strong offer.
Risks & watch-outs
- Watch-outs: built in 1932 — expect roof / HVAC / electrical / plumbing capex.
- Climate carrying-cost: extreme-heat days projected 7→17/yr by 2055 (HVAC capex compounding) — expect insurance premiums to compound above CPI over the hold.
Questions for the listing agent
- It's been on market 56 days. Have you received any prior offers? Is the seller open to a 3% concession, seller financing, or rate buy-down credit?
- Built in 1932 — when were the roof, HVAC, electrical panel, plumbing, and water heater last replaced?
- Is there a deadline driving the sale (1031 exchange, divorce, estate, relocation)? That informs how much negotiation room exists.
- Schools are D-rated, which usually means shorter tenancies and higher turnover. Who's the typical renter profile here, and what's been the actual vacancy rate?
- Crime grade is F in this area — have there been break-ins, vandalism, or insurance claims at this property in the last 3 years? What carrier currently insures it and at what premium?
- What's the average days-on-market for RENTAL listings here right now (not sales)? A rising rental-DOM trend means longer vacancies and softer asking-rent achievability than the comps imply.
- What's the recent tenant-quality profile in this submarket — average credit score on applications, eviction rate, late-payment / NSF rate, and stable-employment percentage? A property-management company in the area should have these aggregated.
- How much new for-sale + rental construction is in the pipeline within 1–3 miles? Heavy new supply typically softens prices + rents 12–24 months out; constrained supply supports both.
Investment metrics
- 1% rule
- 1.25% ✓
- Cap rate
- 10.56%
- Cash-on-cash
- 15.22%
- DSCR
- 1.68
- GRM
- 6.7
CMA / ARV
- ARV (on-the-fly)
- $209,142
- Comps found
- 12
Show comp detail 12 sales within ~0.75 mi
| Address | Dist | Beds/Ba | Sqft | Sold | Price | $/sf | Match |
|---|---|---|---|---|---|---|---|
| 827 Ford St | 0.40mi | 3/1.5 | 1,252 (-3%) | 6mo | $167,000 | $133 | 70 |
| 718 W 4th Ave | 0.34mi | 3/2.0 | 1,332 (+3%) | 7mo | $215,900 | $162 | 69 |
| 704 Archdale Dr | 0.49mi | 3/2.0 | 1,334 (+3%) | 1mo | $285,000 | $214 | 67 |
| 408 W 4th Ave | 0.08mi | 3/1.0 | 1,117 (-14%) | 10mo | $185,000 | $166 | 65 |
| 997 Robbins Cir | 0.56mi | 3/2.0 | 1,254 (-3%) | 0mo | $170,000 | $136 | 65 |
| 304 Salem St | 0.54mi | 3/1.0 | 1,240 (-4%) | 6mo | $90,000 | $73 | 63 |
| 13 Pickard Cir | 0.65mi | 3/2.0 | 1,262 (-2%) | 2mo | $217,000 | $172 | 60 |
| 101 Booker Ave | 0.66mi | 3/2.0 | 1,246 (-4%) | 4mo | $195,000 | $157 | 56 |
| 820 Hargrave St | 0.39mi | 3/2.0 | 1,455 (+13%) | 9mo | $202,500 | $139 | 49 |
| 507 Quail Ln | 0.68mi | 3/2.0 | 1,400 (+8%) | 2mo | $261,500 | $187 | 48 |
| 226 Westover Dr | 0.67mi | 2/2.0 (-1) | 1,410 (+9%) | 9mo | $192,000 | $136 | 37 |
| 505 Hunters Way | 0.73mi | 3/2.0 | 1,451 (+12%) | 9mo | $280,500 | $193 | 34 |
Match score weights: distance 35% · size 25% · config 20% · recency 20%. Top-matched comps best support the ARV.
Projected returns pro-forma
-3.0% appreciation · 1.37% rent growth · sell at horizon
- IRR
- 4.1%
- Equity multiple
- 1.16×
- Total profit
- $4,652
- Equity at exit
- $15,805
- IRR
- 12.1%
- Equity multiple
- 1.89×
- Total profit
- $26,378
- Equity at exit
- $9,165
Cash invested: $29,680 (down + closing). Projections, not guarantees.
Landlord ↔ Tenant lean methodology
- Overall (STATE)
- 85 Strongly Landlord-Friendly
- State North Carolina
- 85 Strongly Landlord-Friendly · R+3
- County
- — inherits STATE
- City
- — inherits STATE
ZIP-level market 27292
- Home prices YoY
- -22.1%
- Rents YoY
- 1.4%
- Active inventory
- 400
- Price-to-rent
- 6.7×
Monthly cashflow live
- Estimated rent
- $1,322 high interval (Pro) →
- Mortgage (P&I)
- −$556
- Tax from tax record
- −$68 /mo · $816/yr
- Insurance
- −$44
- HOA
- −$0
- Vacancy / Maint / Mgmt
- −$278
- Net cashflow
- $377
Break-even live
UW: 25.0% down · 7.5% · 30yr · 1.5% tax · 5.0% vac · 8.0% maint · 8.0% mgmt
Financing live
Cash to close
- Down payment
- $26,500
- Closing costs
- $3,180
- Reserves months
- —
- Total cash needed
- —
Loan-product check · same deal, 3 products live
Conventional
25% down · 7.5% · 30yr
- Down + closing
- —
- Monthly P&I
- —
- Monthly cashflow
- —
- DSCR
- —
- Eligible?
- —
Personal DTI + credit; lowest rate.
DSCR
20% down · 8.5% · 30yr
- Down + closing
- —
- Monthly P&I
- —
- Monthly cashflow
- —
- DSCR
- —
- Eligible?
- —
No personal income docs; deal must DSCR.
Hard money
10% down · 12.0% · 12mo
- Down + closing
- —
- Monthly P&I
- —
- Monthly cashflow
- —
- DSCR
- —
- Eligible?
- —
Short-term bridge; refi at stabilization.
Rent comps 8 comps
| Address | Beds | Baths | Sqft | Rent | $/sqft | DOM | Units | Dist |
|---|---|---|---|---|---|---|---|---|
| 420 Salem St Unit H Lexington, NC | 2.0 | 1.5 | 1100 | $875 | $0.80 | 19d | 1 | 0.69mi |
| 301 Williamson St Unit B Lexington, NC | 2.0 | 1.0 | 896 | $1,000 | $1.12 | 23d | 1 | 1.24mi |
| 500 Rylee Ln Lexington, NC | 3.0 | 2.0 | 1200 | $1,550 | $1.29 | 14d | 1 | 1.34mi |
| 812 Fairview Dr Apt 200D Lexington, NC | 2.0 | 1.5 | 976 | $1,249 | $1.28 | 21d | 1 | 1.35mi |
| 812 Fairview Dr Apt 450A Lexington, NC | 2.0 | 1.5 | 976 | $1,450 | $1.49 | 23d | 1 | 1.35mi |
| 206 Crane Creek Way Lexington, NC | 3.0 | 2.5 | 1588 | $1,650 | $1.04 | 23d | 1 | 1.38mi |
| 6 London Ct Lexington, NC | 1.0–4.0 | 1.0–1.5 | 875 | $1,457 | $1.66 | 14d | 1 | 1.48mi |
| 1305 White St Unit 1315-A Lexington, NC | 2.0 | 1.5 | 900 | $875 | $0.97 | 14d | 1 | 1.48mi |
Listing history 18 events
-
2026-06-18days on market $106,000 Active 56 DOM
-
2026-06-17days on market $106,000 Active 55 DOM
-
2026-06-16days on market $106,000 Active 54 DOM
-
2026-06-15days on market $106,000 Active 53 DOM
-
2026-06-14days on market $106,000 Active 51 DOM
-
2026-06-10days on market $106,000 Active 48 DOM
-
2026-06-09days on market $106,000 Active 47 DOM
-
2026-06-08days on market $106,000 Active 46 DOM
-
2026-06-07days on market $106,000 Active 45 DOM
-
2026-06-05days on market $106,000 Active 42 DOM
-
2026-06-03days on market $106,000 Active 41 DOM
-
2026-06-02days on market $106,000 Active 40 DOM
-
2026-06-01days on market $106,000 Active 39 DOM
-
2026-05-31days on market $106,000 Active 38 DOM
-
2026-05-31days on market $106,000 Active 37 DOM
-
2026-04-28price $106,000
-
2026-04-23$75,000 Active
-
2003-01-17soldstatus $8,500
ⓘ Source: listings_history table (triggers on properties + properties_extension) + one-shot
backfill from property_details.listing_events for pre-trigger history.
Tax reassessment forecast NC · Resets to sale price
- Current annual tax
- $816 · $68/mo
- Projected year-2 tax
- $869 · $72/mo
- Expected delta
- +$53/yr (+$4/mo · 6.5%)
ⓘ Screening estimate from a state-policy table — verify with the county assessor before closing.
Climate risk First Street
- Flood 1/10 Low FEMA zone X (unshaded) · 0% chance over 30 yrs
- Wildfire 1/10 Low
- Heat 6/10 Major 7 d/yr ≥104°F today · 17 d/yr by 30 yrs out
- Wind 4/10 Moderate 13% chance of damaging wind over 30 yrs
- Air quality 2/10 Low 1 unhealthy d/yr today · 2 by 30 yrs out
Nearby sold comps map
Loading sold comps map…
Walkable amenities ~0.75 mi
Loading nearby amenities…
Taxation est. · year 1
- Rental income
- $15,867
- − Mortgage interest
- −$5,938
- − Property taxes
- −$816
- − Insurance
- −$530
- − Repairs & maintenance
- −$1,269
- − Management
- −$1,269
- − Depreciation
- −$3,084
- Taxable income
- $2,961
- Est. tax owed @ 24.0%
- −$711
- After-tax cash flow
- $3,808/yr
For passive investors: Depreciation is non-cash, so a rental often shows a tax loss while cash-flowing — sheltering income. Rental losses are passive: they offset passive income freely, and up to $25,000/yr can offset ordinary (W-2) income if you actively participate and your MAGI is under $100k (phasing out to $0 by $150k); unused losses carry forward. On sale, claimed depreciation is recaptured at up to 25%, and gains may owe capital-gains tax (a 1031 exchange can defer both). Figures are a year-1 estimate at your 24.0% rate — not tax advice; consult a CPA.
Schools (NCES district)
- District
- Lexington City Schools
- NCES district ID
- 3702640
- Math proficiency
- 32% ▲ 3.00%
- Reading proficiency
- 38% ▲ 6.00%
- Median HH income
- $27,758
- Composite
- 28.2/100
- National rank
- #6807
- State rank
- #136 of 178 in NC
Livability — Lexington
- Score
- 72/100
- State rank
- #89
- US rank
- #6051
Category grades
Schools grade is shown separately in the Schools card above.
Census & demographics
- Census place
- Lexington, NC
- County
- Davidson County · 129,088 people
- City population
- 79,578
- Metro
- Winston-Salem, NC
- Population (ZIP)
- 40,311
- Household income
- $57,264
- Rent vs Own
- Severe rent burden
- 1001.0
Population outlook (Davidson County) Hauer SSP2
- Today (2025)
- 167,156 people
- By 2030
- 167,216 · +0.0%
- By 2040
- 164,524 · -1.6%
- By 2050
- 157,229 · -5.9%
- By 2075
- 138,084 · -17.4%
- By 2100
- 112,729 · -32.6%
Race, ethnicity, and origin ACS 2023
- Neighborhood character
- Predominantly White (72%)
- Race & ethnicity
- White 72% Black 13% Two or more races 9% Hispanic / Latino 9% Asian 2%
- Hispanic origin (detail)
- Mexican 7%
- Common ancestry
- Romanian 1% Slovak 1% Serbian 1%
- Foreign-born
- 5% · Canada, Vietnam
- Languages at home
- 91% English-only · Spanish 8%
Political lean MEDSL · Davidson
- 2024 margin
- Solid R (+47.1) · D 25.9% · R 73.0% · Other 1.1%
- 2008→2024 swing
- -13.5pp toward R · 2008: -33.5pp · 2024: -47.1pp
- All cycles
- 2024: R+47.1 2020: R+47.5 2016: R+49.4 2012: R+40.9 2008: R+33.5
Not yet ingested
- Civics
- —
Market trends
- HPI YoY
- ▼ -75.79%
- Current HPI
- 267.074
- Rent YoY
- ▲ 1.37%
- Metro
- Winston-Salem, NC
- State GDP YoY
- ▲ 3.28%
- F500 in state
- 26
Industry mix (Fortune 500 HQ in NC)
| Industry | F500 HQs | Revenue |
|---|---|---|
| Financial Services | 2 | $213B |
|
||
| Retail | 2 | $95B |
|
||
| Industrial Conglomerate | 1 | $38B |
|
||
| Metals / Steel | 1 | $35B |
|
||
| Utilities | 1 | $30B |
|
||
| Industrial Machinery | 1 | $19B |
|
||
Price history
+1147.1% since first listed3 events — show timeline
- 2026-04-28 Price Changed $106,000 Triad MLS
- 2026-04-23 Listed $75,000 Triad MLS
- 2003-01-17 Sold (Public Records) $8,500 Public Records
Property tax history
+1.0%/yrLatest (2025): $816 · +0.0% YoY. Source: county tax records.
Cash-flow waterfall
monthlySold comps — $/sqft
last 12 mo · ≤1 miLoading sold comps…