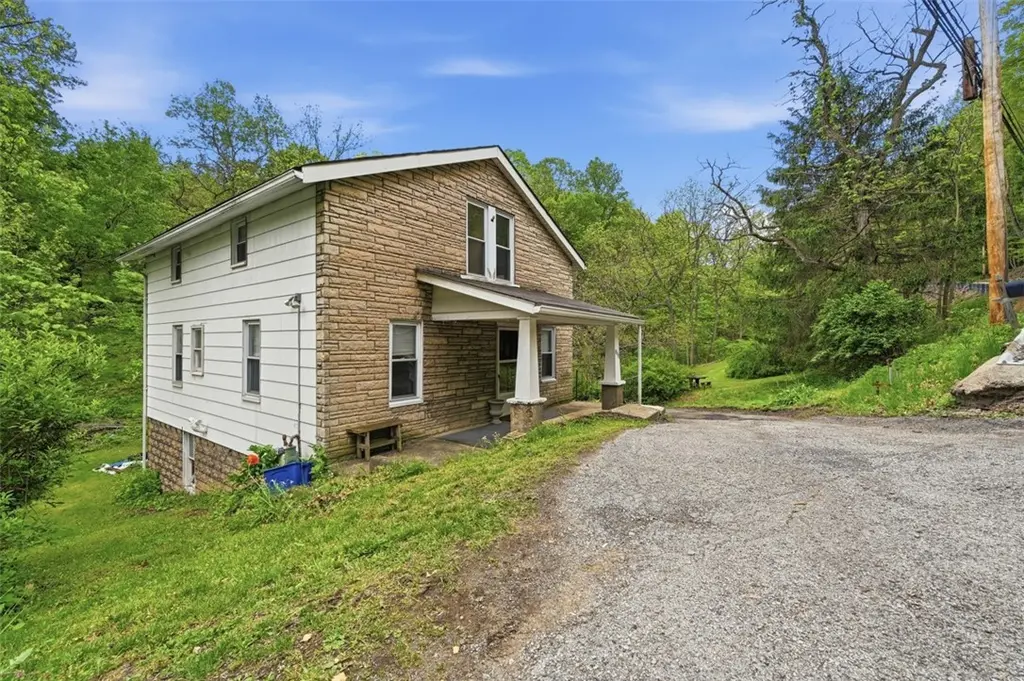
898 Geyer Rd · Millvale, PA
Flood risk 9/10 · Severe
- FEMA flood zone
- X (unshaded)
- Chance of flooding over 30 yrs
- 0.99%
- Est. flood insurance / yr
- $473 – $860
Fire risk 1/10 · Minimal
- Est. fire insurance / yr
- $511 – $949
Heat risk 3/10 · Minor
- Hot days now (above 98°F)
- 7 days/yr
- Hot days in 30 yrs
- 17 days/yr
Wind risk 2/10 · Minimal
- Chance of severe wind over 30 yrs
- —
Air-quality risk 4/10 · Minor
- Unhealthy air days now
- 4 days/yr
- Unhealthy air days in 30 yrs
- 5 days/yr
Risk factors via First Street. Map © Google.
Why this score? — see what drove the B grade
The composite is a weighted blend of 9 inputs, each scored 0–100. Each bar is that input's sub-score; the figure is the points it added to the 100-point composite (weight × sub-score).
- Cash flow +30.0/30.0
- 1% rule +10.0/10.0
- DSCR +10.0/10.0
- ARV discount +7.5/15.0
- Livability +4.2/5.0
- Schools +4.1/10.0
- Rent growth +3.8/5.0
- Condition / age +2.5/5.0
- Appreciation +0.0/10.0
$112,000
🖨 Deal sheet (PDF) 📄 Offer letter ✓ Due diligence
Listing remarks
If you are looking for privacy and land we, have you covered! This Reserve twp. 4-bedroom, 2-full bath home that sitting on 1.2 acres provides an excellent opportunity! The property needs work but has a ton of potential for an investor or owner occupant. You have two covered porches and 2 covered parking/storage spots outside. Inside on the main level you have some flexibility for use of space. The Kitchen is large enough as an eat in kitchen, leaving a Livingroom, dining room or flex use for a work from home space, full bath and a bedroom. The upper level as 4 rooms and a full bath. You can use 3 as bedrooms with a den or flex space. The basement is open with a laundry area and plenty of w
Key facts
- 1.21 acre lot
- 2 parking spots
- Built 1920
Property features AI
Finance
- HOA & community: Public transportation access
Exterior
- Parking: Covered parking; 2 parking spaces (total)
- Utilities: Public water; Septic tank sewer
- Home design: 2-story frame home; Asphalt roof; Resale property
- Construction: Frame construction; Asphalt roof
- Exterior features: Lot dimensions approx. 472 x 85 x 485 x 284; Public transportation nearby
Interior
- Kitchen: Kitchen on main level (13x12); Refrigerator; Stove
- Bedrooms: Bedroom 2 on upper level (13x11); Bedroom 3 on upper level (12x12); Bedroom 4 on upper level (11x10)
- Flooring: Carpet; Laminate
- Bathrooms: 2 full bathrooms
- Heating & cooling: Forced air heating; Gas heating
- Interior features: Full basement with walk-out access; 9 total rooms
- Laundry & utility: Laundry room on lower level; Washer; Dryer
Neighborhood map
What this means for you Summary
Snapshot
- This is a 3-bed/2.0-bath single-family listed at $112k.
Deal economics
- At list price, monthly cash flow is $659 ($8k/yr) — positive.
- The deal already cash-flows at list — no discount required.
- Meets the 1% rule at list price ($2k rent vs $112k).
Location & tenants
- Location reads 85/100 on livability (#75 in PA, #544 nationally) — a professional / high-income tenant draw. Strengths: commute A+, cost of living A+, housing A+; Watch: employment C-.
- Shaler Area SD (suburban): math 36% / reading 59% proficiency, ranked #208 of 539 in PA (top 39%) — families likely to look elsewhere, expect single-tenant / working-renter base with shorter leases.
- Zoned schools: Shaler Area Hs (math 61% / reading 10%, grade F, #308 of 437 statewide, top 71%, 1,225 students, 36% FRL).
- Zoned-school proficiency averages 36% at this address vs 48% district-wide (-12 pts) — the specific schools serving this property underperform the Shaler Area SD average; the district grade overstates school quality for this exact location.
- Market conditions: Rents rising fast (+5.3%/yr); 27 active listings in the ZIP; 3 comparable units currently listed for rent nearby; rentals lingering (median 46d on market — plan ~5-8 weeks vacancy on turnover, expect pricing pressure); 67% of comp listings sitting > 30 days — soft ceiling on asking rent; solid renter incomes; 2,996 units permitted in Allegheny County in 2024 (1,588 in 5+ unit buildings).
Forward outlook
- Local home prices are declining (-3.0%/yr); year-one equity from $774 of loan paydown is wiped out by about $3k of value loss. Plan a longer hold.
- At projected returns (-3.0% appreciation + 5.3% rent growth), your $31k cash investment doubles in ~5 years — after that, you're playing with house money.
Negotiation context
- Only 4 days on market — expect competitive offers; lowballing is unlikely to land.
Risks & watch-outs
- Watch-outs: flood insurance adds $56/mo; built in 1920 — expect roof / HVAC / electrical / plumbing capex.
- Climate carrying-cost: severe flood risk — expect insurance premiums to compound above CPI over the hold.
Questions for the listing agent
- Built in 1920 — when were the roof, HVAC, electrical panel, plumbing, and water heater last replaced?
- What's the actual annual flood-insurance premium (NFIP or private), and is the property in a SFHA with mandatory coverage?
- Is there a deadline driving the sale (1031 exchange, divorce, estate, relocation)? That informs how much negotiation room exists.
- What's the average days-on-market for RENTAL listings here right now (not sales)? A rising rental-DOM trend means longer vacancies and softer asking-rent achievability than the comps imply.
- What's the recent tenant-quality profile in this submarket — average credit score on applications, eviction rate, late-payment / NSF rate, and stable-employment percentage? A property-management company in the area should have these aggregated.
- How much new for-sale + rental construction is in the pipeline within 1–3 miles? Heavy new supply typically softens prices + rents 12–24 months out; constrained supply supports both.
Investment metrics
- 1% rule
- 1.68% ✓
- Cap rate
- 13.95%
- Cash-on-cash
- 27.34%
- DSCR
- 2.22
- GRM
- 5.0
CMA / ARV
- ARV (on-the-fly)
- $300,083
- Comps found
- 3
Show comp detail 3 sales within ~0.75 mi
| Address | Dist | Beds/Ba | Sqft | Sold | Price | $/sf | Match |
|---|---|---|---|---|---|---|---|
| 898 Geyer Rd | 0.00mi | 4/2.0 (+1) | 1,841 (0%) | 0mo | $95,000 | $52 | 95 |
| 114 Biscayne | 0.60mi | 3/2.0 | 1,700 (-8%) | 13mo | $305,000 | $179 | 48 |
| 104 Bonita Ter | 0.63mi | 2/2.0 (-1) | 1,675 (-9%) | 8mo | $272,500 | $163 | 44 |
Match score weights: distance 35% · size 25% · config 20% · recency 20%. Top-matched comps best support the ARV.
Projected returns pro-forma
-3.0% appreciation · 5.31% rent growth · sell at horizon
- IRR
- 21.5%
- Equity multiple
- 1.90×
- Total profit
- $28,356
- Equity at exit
- $16,700
- IRR
- 31.1%
- Equity multiple
- 4.13×
- Total profit
- $98,225
- Equity at exit
- $9,684
Cash invested: $31,360 (down + closing). Projections, not guarantees.
Landlord ↔ Tenant lean methodology
- Overall (STATE)
- 62 Landlord-Friendly
- State Pennsylvania
- 62 Landlord-Friendly · EVEN
- County
- — inherits STATE
- City
- — inherits STATE
ZIP-level market 15209
- Home prices YoY
- -27.7%
- Rents YoY
- 5.3%
- Active inventory
- 27
- Price-to-rent
- 5.0×
Monthly cashflow live
- Estimated rent
- $1,881 medium interval (Pro) →
- Mortgage (P&I)
- −$587
- Tax from tax record
- −$137 /mo · $1,648/yr
- Insurance
- −$47
- Flood insurance flood zone
- −$56 /mo · $666/yr
- HOA
- −$0
- Vacancy / Maint / Mgmt
- −$395
- Net cashflow
- $659
Break-even live
Sensitivity live
| Price | -10% $722 | -5% $691 | +0% $659 | +5% $627 | +10% $596 |
|---|---|---|---|---|---|
| Rent | -10% $510 | -5% $585 | +0% $659 | +5% $733 | +10% $808 |
| Rate | -1.0pp $715 | -0.5pp $687 | base $659 | +0.5pp $630 | +1.0pp $600 |
UW: 25.0% down · 7.5% · 30yr · 1.5% tax · 5.0% vac · 8.0% maint · 8.0% mgmt
Financing live
Cash to close
- Down payment
- $28,000
- Closing costs
- $3,360
- Reserves months
- —
- Total cash needed
- —
Loan-product check · same deal, 3 products live
Conventional
25% down · 7.5% · 30yr
- Down + closing
- —
- Monthly P&I
- —
- Monthly cashflow
- —
- DSCR
- —
- Eligible?
- —
Personal DTI + credit; lowest rate.
DSCR
20% down · 8.5% · 30yr
- Down + closing
- —
- Monthly P&I
- —
- Monthly cashflow
- —
- DSCR
- —
- Eligible?
- —
No personal income docs; deal must DSCR.
Hard money
10% down · 12.0% · 12mo
- Down + closing
- —
- Monthly P&I
- —
- Monthly cashflow
- —
- DSCR
- —
- Eligible?
- —
Short-term bridge; refi at stabilization.
Rent comps 3 comps
| Address | Beds | Baths | Sqft | Rent | $/sqft | DOM | Units | Dist |
|---|---|---|---|---|---|---|---|---|
| 17 Cambria Pt Pittsburgh, PA | 3.0 | 4.0 | 1692 | $1,995 | $1.18 | 45d | 1 | 0.99mi |
| 404 Reetz St Pittsburgh, PA | 4.0 | 1.0 | 1500 | $2,050 | $1.37 | 18d | 1 | 1.35mi |
| 107 Shoup St #2 Pittsburgh, PA | 2.0 | 1.0 | 2064 | $2,000 | $0.97 | 45d | 1 | 1.46mi |
Listing history 2 events
-
2026-05-14status Pending
-
2026-05-10$112,000 Active
ⓘ Source: listings_history table (triggers on properties + properties_extension) + one-shot
backfill from property_details.listing_events for pre-trigger history.
Tax reassessment forecast PA · Partial reset (capped growth)
- Current annual tax
- $1,648 · $137/mo
- Projected year-2 tax
- $1,709 · $142/mo
- Expected delta
- +$61/yr (+$5/mo · 3.7%)
ⓘ Screening estimate from a state-policy table — verify with the county assessor before closing.
Climate risk First Street
- Flood 9/10 Extreme FEMA zone X (unshaded) · 99% chance over 30 yrs
- Wildfire 1/10 Low
- Heat 3/10 Moderate 7 d/yr ≥98°F today · 17 d/yr by 30 yrs out
- Wind 2/10 Low
- Air quality 4/10 Moderate 4 unhealthy d/yr today · 5 by 30 yrs out
Nearby sold comps map
Loading sold comps map…
Walkable amenities ~0.75 mi
Loading nearby amenities…
Taxation est. · year 1
- Rental income
- $22,570
- − Mortgage interest
- −$6,274
- − Property taxes
- −$1,648
- − Insurance
- −$1,226
- − Repairs & maintenance
- −$1,806
- − Management
- −$1,806
- − Depreciation
- −$3,258
- Taxable income
- $6,553
- Est. tax owed @ 24.0%
- −$1,573
- After-tax cash flow
- $6,335/yr
For passive investors: Depreciation is non-cash, so a rental often shows a tax loss while cash-flowing — sheltering income. Rental losses are passive: they offset passive income freely, and up to $25,000/yr can offset ordinary (W-2) income if you actively participate and your MAGI is under $100k (phasing out to $0 by $150k); unused losses carry forward. On sale, claimed depreciation is recaptured at up to 25%, and gains may owe capital-gains tax (a 1031 exchange can defer both). Figures are a year-1 estimate at your 24.0% rate — not tax advice; consult a CPA.
Schools (NCES district)
- District
- Shaler Area SD
- NCES district ID
- 4221200
- Math proficiency
- 36% ▼ -16.00%
- Reading proficiency
- 59% ▼ -15.00%
- Median HH income
- $57,411
- Composite
- 41.33/100
- National rank
- #3506
- State rank
- #208 of 539 in PA
Livability — Millvale
- Score
- 85/100
- State rank
- #75
- US rank
- #544
Category grades
Schools grade is shown separately in the Schools card above.
Census & demographics
- County
- Allegheny County · 1,022,028 people
- Metro
- Pittsburgh, PA
- Population (ZIP)
- 12,328
- Household income
- $85,542
- Rent vs Own
- Severe rent burden
- 356.0
Population outlook (Allegheny County) Hauer SSP2
- Today (2025)
- 1,250,282 people
- By 2030
- 1,256,482 · +0.5%
- By 2040
- 1,256,318 · +0.5%
- By 2050
- 1,244,169 · -0.5%
- By 2075
- 1,197,693 · -4.2%
- By 2100
- 1,093,187 · -12.6%
Race, ethnicity, and origin ACS 2023
- Neighborhood character
- Predominantly White (90%)
- Race & ethnicity
- White 90% Hispanic / Latino 3% Black 3% Two or more races 2% Asian 1%
- Common ancestry
- Romanian 13% Serbian 2% Italian 2%
- Foreign-born
- 3% · Canada
- Languages at home
- 96% English-only · Spanish 2% Other Indo-European 1% Arabic 1%
Political lean MEDSL · Allegheny
- 2024 margin
- Strong D (+20.3) · D 59.7% · R 39.4%
- 2008→2024 swing
- +4.8pp toward D · 2008: 15.5pp · 2024: 20.3pp
- All cycles
- 2024: D+20.3 2020: D+20.4 2016: D+16.4 2012: D+14.4 2008: D+15.5
Not yet ingested
- Civics
- —
Market trends
- HPI YoY
- ▼ -117.81%
- Current HPI
- 307.7796
- Rent YoY
- ▲ 5.31%
- Metro
- Pittsburgh, PA
- State GDP YoY
- ▲ 1.68%
- F500 in state
- 34
Industry mix (Fortune 500 HQ in PA)
| Industry | F500 HQs | Revenue |
|---|---|---|
| Healthcare | 2 | $309B |
|
||
| Insurance | 2 | $27B |
|
||
| Telecommunications / Media | 1 | $124B |
|
||
| Industrial Distribution | 1 | $22B |
|
||
| Financial Services | 1 | $20B |
|
||
| Chemicals / Materials | 1 | $18B |
|
||
Price history
2 events — show timeline
- 2026-05-14 Pending — West Penn MLS
- 2026-05-10 Listed $112,000 West Penn MLS
Property tax history
-4.1%/yrLatest (2026): $1,648 · +0.0% YoY. Source: county tax records.
Cash-flow waterfall
monthlySold comps — $/sqft
last 12 mo · ≤1 miLoading sold comps…