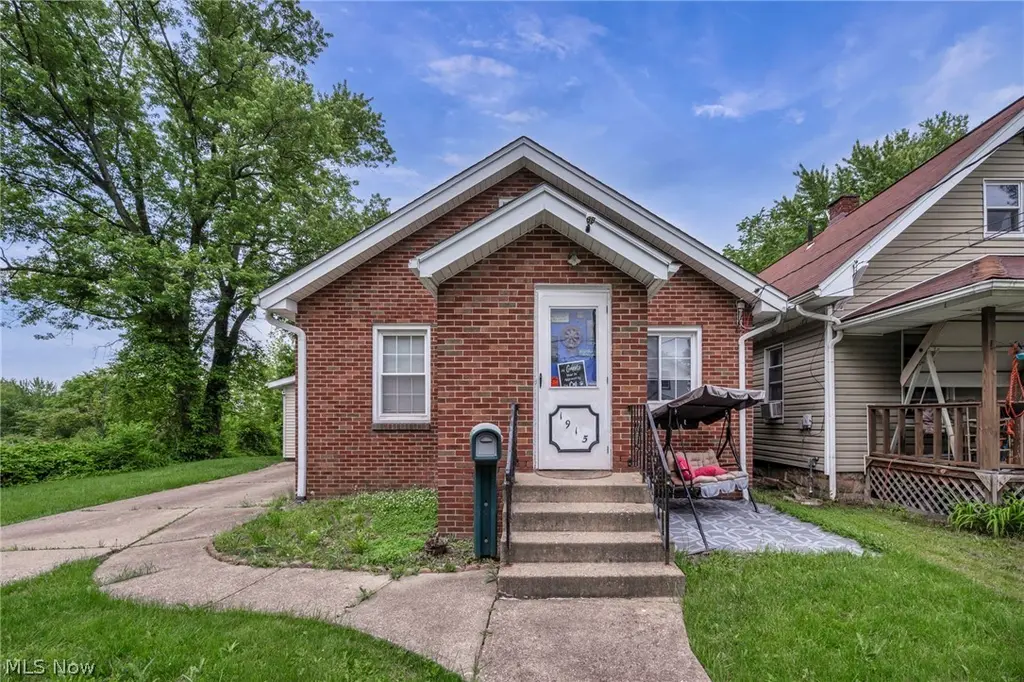
1915 4th St NE · Canton, OH
Flood risk 1/10 · Minimal
- FEMA flood zone
- X (unshaded)
- Chance of flooding over 30 yrs
- 0.0%
- Est. flood insurance / yr
- $473 – $860
Fire risk 1/10 · Minimal
- Est. fire insurance / yr
- $713 – $1,323
Heat risk 3/10 · Minor
- Hot days now (above 96°F)
- 7 days/yr
- Hot days in 30 yrs
- 16 days/yr
Wind risk 1/10 · Minimal
- Chance of severe wind over 30 yrs
- —
Air-quality risk 2/10 · Minimal
- Unhealthy air days now
- 0 days/yr
- Unhealthy air days in 30 yrs
- 1 days/yr
Risk factors via First Street. Map © Google.
Why this score? — see what drove the D+ grade
The composite is a weighted blend of 9 inputs, each scored 0–100. Each bar is that input's sub-score; the figure is the points it added to the 100-point composite (weight × sub-score).
- Cash flow +14.1/30.0
- Appreciation +8.1/10.0
- ARV discount +7.5/15.0
- DSCR +4.3/10.0
- Livability +3.6/5.0
- 1% rule +2.8/10.0
- Rent growth +2.5/5.0
- Condition / age +2.5/5.0
- Schools +1.7/10.0
$132,900
🖨 Deal sheet (PDF) 📄 Offer letter ✓ Due diligence
Listing remarks MLS
If you want to stop renting this is the house to see! Situated on two parcels with a partially fenced backyard, this all brick bungalow is the perfect choice for a 1st time buyer. Inside, the classic floor plan offers a living room, a spacious kitchen with lots of cabinet storage, and easy to maintain laminate flooring that flows into the dining room with knotty pine paneling. Two of the bedrooms and a refreshed full bath on the main floor with a 3rd bedroom with a tall ceiling upstairs. The full basement adds a laundry area plus plenty of space to store your personal belongings. Call to see this affordable move-in ready home today!
Key facts
- Brick bungalow
- Newer flooring
- Newer roof
Tags
Property features AI
Exterior
- Parking: Attached garage (1 car)
- Utilities: Public water; Public sewer
- Home design: Two-story home; Built according to public records
- Construction: Block foundation; Asphalt/fiberglass roof
- Exterior features: Brick exterior; Patio; Fire pit
Interior
- Kitchen: Range; Microwave; Refrigerator; Dishwasher
- Bedrooms: Two main-level bedrooms
- Bathrooms: One full bathroom on the main level
- Heating & cooling: Forced-air gas heating
- Interior features: Double-pane windows; Full, unfinished basement
- Laundry & utility: Washer and dryer located in the basement
Neighborhood map
What this means for you Summary
Snapshot
- This is a 3-bed/1.0-bath single-family listed at $133k.
Deal economics
- At list price, monthly cash flow is $19 ($231/yr) — positive.
- The deal already cash-flows at list — no discount required.
- To meet the 1% rule (rent ≥ 1% of price), the offer needs to be $104k (22.1% below list).
- Recommended offer: $104k (22.1% below list) — sets the bar for 1% rule.
- Cap rate 6.5% vs local median 4.9% in Canton — top-decile yield for the area; either an underpriced asset or a hidden risk that comps aren't pricing in. Stress-test before assuming the spread holds.
Location & tenants
- Location reads 71/100 on livability (#441 in OH) — a middle-class / working-renter tenant base. Strengths: commute A+, cost of living A+, housing A; Watch: crime F, employment F.
- Canton City (urban): math 17% / reading 26% proficiency, ranked #627 of 656 in OH (top 96%) — low school quality limits family demand, transient renter base, plan for 1-2y turnover; 76% free/reduced lunch — lower-income household profile, screen leases tightly.
- Zoned schools: Stephanie Rushin Patrick Elementary School (390 students, 0% FRL); Crenshaw Middle School (math 10% / reading 19%, grade F, #630 of 654 statewide, top 97%, 774 students, 0% FRL); Mckinley High School (math 8% / reading 29%, grade F, #683 of 781 statewide, top 88%, 2,154 students, 0% FRL) — zoned schools average 0% FRL vs 76% district-wide (76 pts lower); this property's tenant base skews higher-income than the district average.
- Market conditions: 20 active listings in the ZIP; 14 comparable units currently listed for rent nearby; rentals at typical pace (median 23d on market — plan ~3-4 weeks tenant-placement turnaround); lower-income renter base — watch delinquency; 528 units permitted in Stark County in 2024 (84 in 5+ unit buildings).
Forward outlook
- In year one you build about $9k of equity ($919 loan paydown + $8k appreciation (6.2% local appreciation)).
- Stark County population projected to shrink 8% by 2050 — rents likely to lag national; underwrite the cash flow, not the appreciation.
- At projected returns (6.2% appreciation + 3.0% rent growth), your $37k cash investment doubles in ~4 years — after that, you're playing with house money.
- By year 4, paydown + projected appreciation supports a ~$31k cash-out refi (75% LTV) — recoverable capital for the next deal without selling this one.
Negotiation context
- It's been on market 20 days — a 2% lower offer ($131k) is reasonable based on typical stale-listing flexibility.
- 6 sale attempts since 3y ago with the ask held roughly flat each time — persistent listings suggest the price (not the market) is what's stuck; bring a comps-based counter.
- Current owner paid $70k; list at $133k implies a 90% gain — meaningful room to come down on a strong offer.
Risks & watch-outs
- Watch-outs: built in 1927 — expect roof / HVAC / electrical / plumbing capex.
Questions for the listing agent
- Built in 1927 — when were the roof, HVAC, electrical panel, plumbing, and water heater last replaced?
- Is there a deadline driving the sale (1031 exchange, divorce, estate, relocation)? That informs how much negotiation room exists.
- Crime grade is F in this area — have there been break-ins, vandalism, or insurance claims at this property in the last 3 years? What carrier currently insures it and at what premium?
- The area grade is low — what's the realistic commute time and amenity access for the typical tenant pool here? Any planned neighborhood developments (good or bad) we should know about?
- What's the average days-on-market for RENTAL listings here right now (not sales)? A rising rental-DOM trend means longer vacancies and softer asking-rent achievability than the comps imply.
- What's the recent tenant-quality profile in this submarket — average credit score on applications, eviction rate, late-payment / NSF rate, and stable-employment percentage? A property-management company in the area should have these aggregated.
- How much new for-sale + rental construction is in the pipeline within 1–3 miles? Heavy new supply typically softens prices + rents 12–24 months out; constrained supply supports both.
Investment metrics
- 1% rule
- 0.78% ✗
- Cap rate
- 6.47%
- Cash-on-cash
- 0.62%
- DSCR
- 1.03
- GRM
- 10.7
CMA / ARV
- ARV (on-the-fly)
- $67,204
- Comps found
- 12
Show comp detail 12 sales within ~0.75 mi
| Address | Dist | Beds/Ba | Sqft | Sold | Price | $/sf | Match |
|---|---|---|---|---|---|---|---|
| 515 Flamos Cir NE | 0.08mi | 3/1.5 | 1,300 (+2%) | 2mo | $119,000 | $92 | 88 |
| 1817 Penn Pl NE | 0.23mi | 3/1.0 | 1,389 (+10%) | 10mo | $59,900 | $43 | 65 |
| 2002 Penn Pl NE | 0.23mi | 2/1.0 (-1) | 1,164 (-8%) | 8mo | $40,000 | $34 | 64 |
| 1718 4th St NE | 0.19mi | 2/1.0 (-1) | 1,128 (-11%) | 5mo | $25,250 | $22 | 63 |
| 425 Girard Ave NE | 0.29mi | 3/1.0 | 1,144 (-10%) | 12mo | $104,900 | $92 | 60 |
| 2306 3rd St NE | 0.45mi | 3/2.0 | 1,319 (+4%) | 11mo | $129,900 | $98 | 59 |
| 1316 4th St NE | 0.50mi | 2/1.0 (-1) | 1,152 (-9%) | 2mo | $58,000 | $50 | 55 |
| 2026 2nd St NE | 0.24mi | 2/1.5 (-1) | 1,131 (-11%) | 12mo | $60,000 | $53 | 54 |
| 1434 2nd St NE | 0.42mi | 2/1.0 (-1) | 1,136 (-10%) | 10mo | $85,750 | $75 | 50 |
| 2001 3rd St SE | 0.32mi | 3/1.0 | 1,456 (+15%) | 13mo | $126,000 | $87 | 50 |
| 920 Ojays Pkwy NE | 0.58mi | 2/2.0 (-1) | 1,202 (-5%) | 15mo | $45,000 | $37 | 43 |
| 1935 5th St SE | 0.46mi | 3/2.0 | 1,442 (+14%) | 13mo | $52,777 | $37 | 41 |
Match score weights: distance 35% · size 25% · config 20% · recency 20%. Top-matched comps best support the ARV.
Projected returns pro-forma
6.17% appreciation · 3.0% rent growth · sell at horizon
- IRR
- 16.2%
- Equity multiple
- 2.10×
- Total profit
- $40,875
- Equity at exit
- $84,968
- IRR
- 16.1%
- Equity multiple
- 4.19×
- Total profit
- $118,814
- Equity at exit
- $155,326
Cash invested: $37,212 (down + closing). Projections, not guarantees.
Landlord ↔ Tenant lean methodology
- Overall (STATE)
- 73 Landlord-Friendly
- State Ohio
- 73 Landlord-Friendly · R+6
- County
- — inherits STATE
- City
- — inherits STATE
ZIP-level market 44704
- Home prices YoY
- 7.2%
- Active inventory
- 20
- Price-to-rent
- 10.7×
Monthly cashflow live
- Estimated rent
- $1,036 high interval (Pro) →
- Mortgage (P&I)
- −$697
- Tax from tax record
- −$47 /mo · $561/yr
- Insurance
- −$55
- HOA
- −$0
- Lot rent
- −$0
- Vacancy / Maint / Mgmt
- −$218
- Net cashflow
- $19
Break-even live
Sensitivity live
| Price | -10% $94 | -5% $57 | +0% $19 | +5% $-18 | +10% $-56 |
|---|---|---|---|---|---|
| Rent | -10% $-63 | -5% $-22 | +0% $19 | +5% $60 | +10% $101 |
| Rate | -1.0pp $86 | -0.5pp $53 | base $19 | +0.5pp $-15 | +1.0pp $-50 |
UW: 25.0% down · 7.5% · 30yr · 1.5% tax · 5.0% vac · 8.0% maint · 8.0% mgmt
Financing live
Cash to close
- Down payment
- $33,225
- Closing costs
- $3,987
- Reserves months
- —
- Total cash needed
- —
Loan-product check · same deal, 3 products live
Conventional
25% down · 7.5% · 30yr
- Down + closing
- —
- Monthly P&I
- —
- Monthly cashflow
- —
- DSCR
- —
- Eligible?
- —
Personal DTI + credit; lowest rate.
DSCR
20% down · 8.5% · 30yr
- Down + closing
- —
- Monthly P&I
- —
- Monthly cashflow
- —
- DSCR
- —
- Eligible?
- —
No personal income docs; deal must DSCR.
Hard money
10% down · 12.0% · 12mo
- Down + closing
- —
- Monthly P&I
- —
- Monthly cashflow
- —
- DSCR
- —
- Eligible?
- —
Short-term bridge; refi at stabilization.
Rent comps 14 comps
| Address | Beds | Baths | Sqft | Rent | $/sqft | DOM | Units | Dist |
|---|---|---|---|---|---|---|---|---|
| 1946 Otto Pl NE Canton, OH | 3.0 | 1.0 | 1499 | $28,000 | $18.68 | 16d | 1 | 0.06mi |
| 1906 6th St NE Unit 1906-002 Canton, OH | 3.0 | 1.0 | 906 | $1,000 | $1.10 | 16d | 1 | 0.09mi |
| 2048 2nd St NE Unit 2048 Canton, OH | 2.0 | 1.0 | 1092 | $950 | $0.87 | 16d | 1 | 0.25mi |
| 1511 2nd St NE Canton, OH | 3.0 | 1.0 | 1129 | $1,250 | $1.11 | 46d | 1 | 0.41mi |
| 316 Young Ave NE Canton, OH | 4.0 | 1.0 | 1268 | $1,050 | $0.83 | 16d | 1 | 0.48mi |
| 1206 Lawrence Rd NE Apt 3 Canton, OH | 2.0 | 1.0 | 900 | $950 | $1.06 | 23d | 1 | 0.86mi |
| 924 Spring Ave NE Canton, OH | 4.0 | 1.5 | 1407 | $1,395 | $0.99 | 23d | 1 | 0.93mi |
| 1504 14th St SE Canton, OH | 3.0 | 1.0 | 924 | $1,120 | $1.21 | 16d | 1 | 0.94mi |
| 1304 Cole Ave SE Canton, OH | 2.0 | 1.0 | 984 | $650 | $0.66 | 16d | 1 | 1.01mi |
| 2213 17th St NE Canton, OH | 2.0 | 1.0 | 1132 | $1,100 | $0.97 | 46d | 1 | 1.34mi |
| 1220 Market Ave N Unit 4 Canton, OH | 3.0 | 1.0 | 1400 | $1,100 | $0.79 | 46d | 1 | 1.35mi |
| 1000 Market Ave S Canton, OH | 1.0–2.0 | 1.0–2.0 | 1500 | $4,505 | $3.00 | 15d | 12 | 1.35mi |
| 1613 Spring Ave NE Canton, OH | 3.0 | 1.0 | 1320 | $1,095 | $0.83 | 23d | 1 | 1.47mi |
| 1629 Spring Ave NE Unit Na Canton, OH | 2.0 | 1.0 | 1100 | $836 | $0.76 | 23d | 1 | 1.49mi |
Listing history 16 events
-
2026-06-21days on market $132,900 Active 20 DOM
-
2026-06-18days on market $132,900 Active 17 DOM
-
2026-06-17days on market $132,900 Active 16 DOM
-
2026-06-16days on market $132,900 Active 15 DOM
-
2026-06-15price $132,900 Active 14 DOM
-
2026-06-15days on market $134,900 Active 14 DOM
-
2026-06-14days on market $134,900 Active 12 DOM
-
2026-06-13days on market $134,900 Active 11 DOM
-
2026-06-10days on market $134,900 Active 9 DOM
-
2026-06-09days on market $134,900 Active 8 DOM
-
2026-06-08days on market $134,900 Active 7 DOM
-
2026-06-07days on market $134,900 Active 6 DOM
-
2026-06-05days on market $134,900 Active 3 DOM
-
2026-06-03days on market $134,900 Active 2 DOM
-
2026-06-01remarks 625-char remark
-
2026-06-01$134,900 Active 1 DOM
ⓘ Source: listings_history table (triggers on properties + properties_extension) + one-shot
backfill from property_details.listing_events for pre-trigger history.
Tax reassessment forecast OH · Partial reset (capped growth)
- Current annual tax
- $561 · $47/mo
- Projected year-2 tax
- $1,317 · $110/mo
- Expected delta
- +$756/yr (+$63/mo · 134.9%)
ⓘ Screening estimate from a state-policy table — verify with the county assessor before closing.
Climate risk First Street
- Flood 1/10 Low FEMA zone X (unshaded) · 0% chance over 30 yrs
- Wildfire 1/10 Low
- Heat 3/10 Moderate 7 d/yr ≥96°F today · 16 d/yr by 30 yrs out
- Wind 1/10 Low
- Air quality 2/10 Low 0 unhealthy d/yr today · 1 by 30 yrs out
Nearby sold comps map
Loading sold comps map…
Walkable amenities ~0.75 mi
Loading nearby amenities…
Taxation est. · year 1
- Rental income
- $12,430
- − Mortgage interest
- −$7,444
- − Property taxes
- −$561
- − Insurance
- −$664
- − Repairs & maintenance
- −$994
- − Management
- −$994
- − Depreciation
- −$3,866
- Taxable loss
- −$2,095
- Est. tax savings @ 24.0%
- +$503
- After-tax cash flow
- $734/yr
For passive investors: Depreciation is non-cash, so a rental often shows a tax loss while cash-flowing — sheltering income. Rental losses are passive: they offset passive income freely, and up to $25,000/yr can offset ordinary (W-2) income if you actively participate and your MAGI is under $100k (phasing out to $0 by $150k); unused losses carry forward. On sale, claimed depreciation is recaptured at up to 25%, and gains may owe capital-gains tax (a 1031 exchange can defer both). Figures are a year-1 estimate at your 24.0% rate — not tax advice; consult a CPA.
Schools (NCES district)
- District
- Canton City
- NCES district ID
- 3904371
- Math proficiency
- 17% ▼ -17.00%
- Reading proficiency
- 26% ▼ -12.00%
- Median HH income
- $28,825
- Composite
- 17.1/100
- National rank
- #9116
- State rank
- #627 of 656 in OH
Livability — Canton
- Score
- 71/100
- State rank
- #441
- US rank
- #7259
Category grades
Schools grade is shown separately in the Schools card above.
Census & demographics
- Census place
- Canton, OH
- County
- Stark · 366,688 people
- City population
- 103,614
- Metro
- Canton-Massillon, OH
- Population (ZIP)
- 3,583
- Household income
- $34,063
- Rent vs Own
- Severe rent burden
- 10.1
Population outlook (Stark County) Hauer SSP2
- Today (2025)
- 373,708 people
- By 2030
- 371,245 · -0.7%
- By 2040
- 361,331 · -3.3%
- By 2050
- 345,290 · -7.6%
- By 2075
- 302,669 · -19.0%
- By 2100
- 238,870 · -36.1%
Race, ethnicity, and origin ACS 2023
- Neighborhood character
- Diverse neighborhood (Simpson 0.56)
- Race & ethnicity
- Black 58% White 33% Two or more races 7% Hispanic / Latino 2%
- Common ancestry
- Hispanic 3% Romanian 1% Polish 1%
Political lean MEDSL · Stark
- 2024 margin
- Strong R (+21.9) · D 38.6% · R 60.5%
- 2008→2024 swing
- -27.4pp toward R · 2008: 5.5pp · 2024: -21.9pp
- All cycles
- 2024: R+21.9 2020: R+18.5 2016: R+17.4 2012: R+0.4 2008: D+5.5
Not yet ingested
- Civics
- —
Market trends
- HPI YoY
- ▲ 6.17%
- Current HPI
- 91.3426
- Rent YoY
- —
- Metro
- —
- State GDP YoY
- ▲ 1.98%
- F500 in state
- 48
Industry mix (Fortune 500 HQ in OH)
| Industry | F500 HQs | Revenue |
|---|---|---|
| Insurance | 3 | $145B |
|
||
| Industrial Machinery | 3 | $49B |
|
||
| Financial Services | 3 | $24B |
|
||
| Consumer Goods | 2 | $93B |
|
||
| Aerospace / Defense | 2 | $47B |
|
||
| Utilities | 2 | $33B |
|
||
Price history
+574.5% since first listed15 events — show timeline
- 2026-06-01 Listed $134,900 MLSNOW
- 2024-11-29 Listing Removed — MLSNOW
- 2024-11-25 Listed $85,000 MLSNOW
- 2023-08-18 Sold (Public Records) $70,000 Public Records
- 2023-08-18 Sold (MLS) $70,000 MLSNOW
- 2023-07-22 Pending — MLSNOW
- 2023-07-19 Contingent — MLSNOW
- 2023-06-24 Relisted — MLSNOW
- 2023-06-20 Contingent — MLSNOW
- 2023-06-16 Relisted — MLSNOW
- 2023-06-07 Contingent — MLSNOW
- 2023-05-30 Relisted — MLSNOW
- 2023-04-26 Contingent — MLSNOW
- 2023-04-21 Listed $79,900 MLSNOW
- 2022-08-30 Sold (Public Records) $20,000 Public Records
Property tax history
+35.9%/yrLatest (2024): $561 · +0.7% YoY. Source: county tax records.
Cash-flow waterfall
monthlySold comps — $/sqft
last 12 mo · ≤1 miLoading sold comps…