 🏷️ Likely Rental
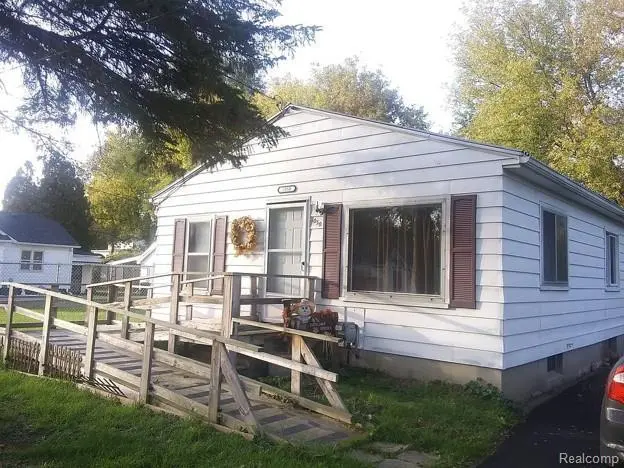
1050 W Mclean Ave · Flint, MI
Flood risk 1/10 · Minimal
- FEMA flood zone
- X (unshaded)
- Chance of flooding over 30 yrs
- 0.0%
- Est. flood insurance / yr
- $473 – $860
Fire risk 1/10 · Minimal
- Est. fire insurance / yr
- $784 – $1,456
Heat risk 2/10 · Minimal
- Hot days now (above 96°F)
- 7 days/yr
- Hot days in 30 yrs
- 15 days/yr
Wind risk 2/10 · Minimal
- Chance of severe wind over 30 yrs
- —
Air-quality risk 3/10 · Minor
- Unhealthy air days now
- 3 days/yr
- Unhealthy air days in 30 yrs
- 4 days/yr
Risk factors via First Street. Map © Google.
Why this score? — see what drove the B+ grade
The composite is a weighted blend of 9 inputs, each scored 0–100. Each bar is that input's sub-score; the figure is the points it added to the 100-point composite (weight × sub-score).
- Cash flow +30.0/30.0
- ARV discount +15.0/15.0
- 1% rule +10.0/10.0
- DSCR +10.0/10.0
- Livability +3.7/5.0
- Condition / age +2.5/5.0
- Rent growth +2.2/5.0
- Schools +1.7/10.0
- Appreciation +0.0/10.0
$64,900
🖨 Deal sheet 📄 Offer letter ✓ Due diligence
Listing remarks MLS
Strong cash-flow opportunity with reliable tenant already in place. This 2-bedroom home sits on an oversized double lot in a convenient Flint Twp location near I-75, I-475 & I-69. Features include private well (no water bill), unfinished basement for added storage, ramp accessibility, and included stove/refrigerator. Large yard offers added tenant appeal with plenty of room for parking, outdoor living, or future improvements. Professionally managed and tenant occupied - ideal turnkey addition to an investment portfolio with immediate rental income potential. Licensed agent must be physically present for all showings, please use caution during showings BATVAI
Key facts
- Private well
- Unfinished basement
- Double lot
Tags
Property features AI
Exterior
- Parking: No garage
- Utilities: Private well water; Public sewer
- Home design: Single-family residence; One level with ground-level entry
- Construction: Aluminum siding; Block foundation
- Exterior features: Paved road access; Lot approximately 0.21 acres (90 x 100)
Interior
- Bedrooms: Total of 4 rooms (includes living areas and bedrooms)
- Bathrooms: 1 full bathroom
- Heating & cooling: Forced-air heating (natural gas); No cooling
- Interior features: Unfinished basement
Neighborhood map
What this means for you Summary
Snapshot
- This is a 2-bed/1.0-bath single-family listed at $65k.
Deal economics
- At list price, monthly cash flow is $273 ($3k/yr) — positive.
- The deal already cash-flows at list — no discount required.
- Meets the 1% rule at list price ($998 rent vs $65k).
- Recommended offer: $64k (1.5% below list) — sets the bar for market timing.
Location & tenants
- Location reads 74/100 on livability (#196 in MI, #4,946 nationally) — a middle-class / working-renter tenant base. Strengths: commute A+, cost of living A+, housing A+; Watch: schools F, crime F, employment F.
- Carman-Ainsworth Community Schools (suburban): math 12% / reading 28% proficiency, ranked #468 of 540 in MI (top 87%) — low school quality limits family demand, transient renter base, plan for 1-2y turnover; 64% free/reduced lunch — lower-income household profile, screen leases tightly.
- Market conditions: Rents soft (-1.0%/yr); 206 active listings in the ZIP; 4 comparable units currently listed for rent nearby; rentals leasing fast (median 13d on market — plan ~1-2 weeks tenant-placement turnaround); 419 units permitted in Genesee County in 2024 (68 in 5+ unit buildings).
Forward outlook
- Local home prices are declining (-3.0%/yr); year-one equity from $449 of loan paydown is wiped out by about $2k of value loss. Plan a longer hold.
- Genesee County population projected at -27% by 2050 — secular population decline; favor cash flow + early exit over multi-decade hold.
- At projected returns (-3.0% appreciation + 0.0% rent growth), your $18k cash investment doubles in ~10 years — after that, you're playing with house money.
Negotiation context
- It's been on market 22 days — a 2% lower offer ($64k) is reasonable based on typical stale-listing flexibility.
- 9 sale attempts since 31y ago with the ask held roughly flat each time — persistent listings suggest the price (not the market) is what's stuck; bring a comps-based counter.
- Current owner paid $5k; list at $65k implies a 1173% gain — meaningful room to come down on a strong offer.
Risks & watch-outs
- Watch-outs: property tax is 2.7% of price; built in 1950 — expect roof / HVAC / electrical / plumbing capex.
Questions for the listing agent
- Built in 1950 — when were the roof, HVAC, electrical panel, plumbing, and water heater last replaced?
- Property tax is high relative to price — has the assessment been appealed recently, and will the sale trigger a re-assessment?
- Is there a deadline driving the sale (1031 exchange, divorce, estate, relocation)? That informs how much negotiation room exists.
- Schools are F-rated, which usually means shorter tenancies and higher turnover. Who's the typical renter profile here, and what's been the actual vacancy rate?
- Crime grade is F in this area — have there been break-ins, vandalism, or insurance claims at this property in the last 3 years? What carrier currently insures it and at what premium?
- What's the average days-on-market for RENTAL listings here right now (not sales)? A rising rental-DOM trend means longer vacancies and softer asking-rent achievability than the comps imply.
- What's the recent tenant-quality profile in this submarket — average credit score on applications, eviction rate, late-payment / NSF rate, and stable-employment percentage? A property-management company in the area should have these aggregated.
- How much new for-sale + rental construction is in the pipeline within 1–3 miles? Heavy new supply typically softens prices + rents 12–24 months out; constrained supply supports both.
Investment metrics
- 1% rule
- 1.54% ✓
- Cap rate
- 11.34%
- Cash-on-cash
- 18.02%
- DSCR
- 1.80
- GRM
- 5.4
CMA / ARV
- ARV (on-the-fly)
- $82,368
- Comps found
- 12
Show comp detail 12 sales within ~0.75 mi
| Address | Dist | Beds/Ba | Sqft | Sold | Price | $/sf | Match |
|---|---|---|---|---|---|---|---|
| 1096 W Buder Ave | 0.10mi | 3/1.0 (+1) | 906 (-3%) | 10mo | $80,000 | $88 | 77 |
| 1081 W Parkwood Ave | 0.13mi | 3/1.0 (+1) | 900 (-4%) | 9mo | $48,500 | $54 | 75 |
| 1073 Schumacher St | 0.24mi | 2/1.0 | 972 (+4%) | 15mo | $92,000 | $95 | 70 |
| 1122 W Scottwood Ave | 0.17mi | 3/1.0 (+1) | 888 (-5%) | 15mo | $77,500 | $87 | 66 |
| 4076 Carmanwood Dr | 0.48mi | 2/1.0 | 925 (-1%) | 12mo | $125,000 | $135 | 66 |
| 4172 Fenton Rd | 0.08mi | 1/1.0 (-1) | 819 (-12%) | 11mo | $14,200 | $17 | 61 |
| 1066 W Boatfield Ave | 0.25mi | 2/1.0 | 843 (-10%) | 16mo | $50,000 | $59 | 58 |
| 1119 W Decamp St | 0.65mi | 1/1.0 (-1) | 961 (+3%) | 8mo | $88,600 | $92 | 54 |
| 3415 Hull Ave | 0.56mi | 2/1.0 | 1,028 (+10%) | 7mo | $44,500 | $43 | 51 |
| 4243 Moulton Dr | 0.66mi | 2/1.0 | 864 (-8%) | 8mo | $155,000 | $179 | 50 |
| 4436 Carmanwood Dr | 0.66mi | 3/1.0 (+1) | 994 (+6%) | 10mo | $165,000 | $166 | 45 |
| 1165 Carman St | 0.73mi | 2/1.0 | 852 (-9%) | 11mo | $75,001 | $88 | 42 |
Match score weights: distance 35% · size 25% · config 20% · recency 20%. Top-matched comps best support the ARV.
Projected returns pro-forma
-3.0% appreciation · 0.0% rent growth · sell at horizon
- IRR
- 5.9%
- Equity multiple
- 1.22×
- Total profit
- $3,993
- Equity at exit
- $9,677
- IRR
- 12.1%
- Equity multiple
- 1.81×
- Total profit
- $14,777
- Equity at exit
- $5,611
Cash invested: $18,172 (down + closing). Projections, not guarantees.
Landlord ↔ Tenant lean methodology
- Overall (STATE)
- 62 Landlord-Friendly
- State Michigan
- 62 Landlord-Friendly · EVEN
- County
- — inherits STATE
- City
- — inherits STATE
ZIP-level market 48507
- Rents YoY
- -1.0%
- Active inventory
- 206
- Price-to-rent
- 5.4×
Monthly cashflow live
- Estimated rent
- $998 medium interval (Pro) →
- Mortgage (P&I)
- −$340
- Tax from tax record
- −$149 /mo · $1,783/yr
- Insurance
- −$27
- HOA
- −$0
- Vacancy / Maint / Mgmt
- −$210
- Net cashflow
- $273
Break-even live
UW: 25.0% down · 7.5% · 30yr · 1.5% tax · 5.0% vac · 8.0% maint · 8.0% mgmt
Financing live
Cash to close
- Down payment
- $16,225
- Closing costs
- $1,947
- Reserves months
- —
- Total cash needed
- —
Loan-product check · same deal, 3 products live
Conventional
25% down · 7.5% · 30yr
- Down + closing
- —
- Monthly P&I
- —
- Monthly cashflow
- —
- DSCR
- —
- Eligible?
- —
Personal DTI + credit; lowest rate.
DSCR
20% down · 8.5% · 30yr
- Down + closing
- —
- Monthly P&I
- —
- Monthly cashflow
- —
- DSCR
- —
- Eligible?
- —
No personal income docs; deal must DSCR.
Hard money
10% down · 12.0% · 12mo
- Down + closing
- —
- Monthly P&I
- —
- Monthly cashflow
- —
- DSCR
- —
- Eligible?
- —
Short-term bridge; refi at stabilization.
Rent comps 4 comps
| Address | Beds | Baths | Sqft | Rent | $/sqft | DOM | Units | Dist |
|---|---|---|---|---|---|---|---|---|
| 4400 Kings Ln Burton, MI | 1.0–2.0 | 1.0–2.0 | 666 | $960 | $1.44 | 13d | 19 | 0.79mi |
| 5800 Maplebrook Ln Flint, MI | 1.0–3.0 | 1.0–1.5 | 837 | $1,245 | $1.49 | 13d | 70 | 0.97mi |
| 813 Alvord Ave Flint, MI | 2.0 | 1.0 | 724 | $850 | $1.17 | 13d | 1 | 1.19mi |
| 1426 Pettibone Ave Flint, MI | 2.0 | 1.0 | 750 | $900 | $1.20 | 21d | 1 | 1.47mi |
Listing history 35 events
-
2026-06-18days on market $64,900 Active 22 DOM
-
2026-06-17days on market $64,900 Active 21 DOM
-
2026-06-16days on market $64,900 Active 20 DOM
-
2026-06-15days on market $64,900 Active 19 DOM
-
2026-06-14days on market $64,900 Active 17 DOM
-
2026-06-13days on market $64,900 Active 16 DOM
-
2026-06-10days on market $64,900 Active 14 DOM
-
2026-06-09days on market $64,900 Active 13 DOM
-
2026-06-08days on market $64,900 Active 12 DOM
-
2026-06-07days on market $64,900 Active 11 DOM
-
2026-06-05days on market $64,900 Active 8 DOM
-
2026-06-02days on market $64,900 Active 6 DOM
-
2026-06-01days on market $64,900 Active 5 DOM
-
2026-05-31days on market $64,900 Active 4 DOM
-
2026-05-30days on market $64,900 Active 3 DOM
-
2026-05-27$64,900 Active
Show marketing remark (672 chars)
Strong cash-flow opportunity with reliable tenant already in place. This 2-bedroom home sits on an oversized double lot in a convenient Flint Twp location near I-75, I-475 & I-69. Features include private well (no water bill), unfinished basement for added storage, ramp accessibility, and included stove/refrigerator. Large yard offers added tenant appeal with plenty of room for parking, outdoor living, or future improvements. Professionally managed and tenant occupied - ideal turnkey addition to an investment portfolio with immediate rental income potential. Licensed agent must be physically present for all showings, please use caution during showings BATVAI
-
2026-05-27$64,900 Active 672-char remark
Show marketing remark (672 chars)
Strong cash-flow opportunity with reliable tenant already in place. This 2-bedroom home sits on an oversized double lot in a convenient Flint Twp location near I-75, I-475 & I-69. Features include private well (no water bill), unfinished basement for added storage, ramp accessibility, and included stove/refrigerator. Large yard offers added tenant appeal with plenty of room for parking, outdoor living, or future improvements. Professionally managed and tenant occupied - ideal turnkey addition to an investment portfolio with immediate rental income potential. Licensed agent must be physically present for all showings, please use caution during showings BATVAI
-
2025-10-25historical $825
-
2025-09-19price $825
-
2025-08-06$900
-
2010-10-19soldstatus $5,100 220-char remark
Show marketing remark (220 chars)
Hud Home. Sold 'as Is' By Elec Bid Only. For Prop. Conditions, Forms, Lbp, Discl, Avail See Web In Agnt Rmks. Bids Due By 7-20-10 11:59 Pm Or Daily Until Sold. McB/No Warr Curr/Fut Mold In Prop & Not Liable Effects
-
2010-10-19soldstatus $5,100
Show marketing remark (220 chars)
Hud Home. Sold 'as Is' By Elec Bid Only. For Prop. Conditions, Forms, Lbp, Discl, Avail See Web In Agnt Rmks. Bids Due By 7-20-10 11:59 Pm Or Daily Until Sold. McB/No Warr Curr/Fut Mold In Prop & Not Liable Effects
-
2010-07-21historical
-
2010-05-21$8,000 220-char remark
Show marketing remark (220 chars)
Hud Home. Sold 'as Is' By Elec Bid Only. For Prop. Conditions, Forms, Lbp, Discl, Avail See Web In Agnt Rmks. Bids Due By 7-20-10 11:59 Pm Or Daily Until Sold. McB/No Warr Curr/Fut Mold In Prop & Not Liable Effects
-
2010-05-21$8,000
Show marketing remark (220 chars)
Hud Home. Sold 'as Is' By Elec Bid Only. For Prop. Conditions, Forms, Lbp, Discl, Avail See Web In Agnt Rmks. Bids Due By 7-20-10 11:59 Pm Or Daily Until Sold. McB/No Warr Curr/Fut Mold In Prop & Not Liable Effects
-
2000-01-27soldstatus $37,005
-
2000-01-27soldstatus $37,005
-
1999-12-08historical
-
1999-12-03$35,000
-
1999-12-03$35,000
-
1995-11-20soldstatus $37,550
-
1995-11-20soldstatus $37,550
-
1995-10-18historical
-
1995-10-10$34,500
-
1995-10-10$34,500
ⓘ Source: listings_history table (triggers on properties + properties_extension) + one-shot
backfill from property_details.listing_events for pre-trigger history.
Tax reassessment forecast MI · Partial reset (capped growth)
- Current annual tax
- $1,783 · $149/mo
- Projected year-2 tax
- $1,783 · $149/mo
- Expected delta
- $0/yr ($0/mo · 0.0%)
ⓘ Screening estimate from a state-policy table — verify with the county assessor before closing.
Climate risk First Street
- Flood 1/10 Low FEMA zone X (unshaded) · 0% chance over 30 yrs
- Wildfire 1/10 Low
- Heat 2/10 Low 7 d/yr ≥96°F today · 15 d/yr by 30 yrs out
- Wind 2/10 Low
- Air quality 3/10 Moderate 3 unhealthy d/yr today · 4 by 30 yrs out
Nearby sold comps map
Loading sold comps map…
Walkable amenities ~0.75 mi
Loading nearby amenities…
Taxation est. · year 1
- Rental income
- $11,982
- − Mortgage interest
- −$3,635
- − Property taxes
- −$1,783
- − Insurance
- −$324
- − Repairs & maintenance
- −$959
- − Management
- −$959
- − Depreciation
- −$1,888
- Taxable income
- $2,434
- Est. tax owed @ 24.0%
- −$584
- After-tax cash flow
- $2,690/yr
For passive investors: Depreciation is non-cash, so a rental often shows a tax loss while cash-flowing — sheltering income. Rental losses are passive: they offset passive income freely, and up to $25,000/yr can offset ordinary (W-2) income if you actively participate and your MAGI is under $100k (phasing out to $0 by $150k); unused losses carry forward. On sale, claimed depreciation is recaptured at up to 25%, and gains may owe capital-gains tax (a 1031 exchange can defer both). Figures are a year-1 estimate at your 24.0% rate — not tax advice; consult a CPA.
Schools (NCES district)
- District
- Carman-Ainsworth Community Schools
- NCES district ID
- 2607890
- Math proficiency
- 12% ▼ -14.00%
- Reading proficiency
- 28% ▼ -8.00%
- Median HH income
- $39,394
- Composite
- 16.84/100
- National rank
- #9149
- State rank
- #468 of 540 in MI
Livability — Flint
- Score
- 74/100
- State rank
- #196
- US rank
- #4946
Category grades
Schools grade is shown separately in the Schools card above.
Census & demographics
- County
- Genesee County · 221,329 people
- City population
- 93,814
- Metro
- Flint, MI
- Population (ZIP)
- 28,723
- Household income
- $46,554
- Rent vs Own
- Severe rent burden
- 1534.0
Population outlook (Genesee County) Hauer SSP2
- Today (2025)
- 381,312 people
- By 2030
- 362,731 · -4.9%
- By 2040
- 321,550 · -15.7%
- By 2050
- 279,212 · -26.8%
- By 2075
- 193,336 · -49.3%
- By 2100
- 128,118 · -66.4%
Race, ethnicity, and origin ACS 2023
- Neighborhood character
- Diverse neighborhood (Simpson 0.57)
- Race & ethnicity
- White 59% Black 28% Two or more races 10% Hispanic / Latino 5%
- Common ancestry
- Lithuanian 4% Romanian 3% Slovak 2%
- Foreign-born
- 1% · Canada
- Languages at home
- 97% English-only · Spanish 1% Other Asian/Pacific 1%
Political lean MEDSL · Genesee
- 2024 margin
- Toss-up / Even · D 51.4% · R 47.2% · Other 1.4%
- 2008→2024 swing
- -28.3pp toward R · 2008: 32.5pp · 2024: 4.2pp
- All cycles
- 2024: D+4.2 2020: D+9.3 2016: D+9.5 2012: D+28.2 2008: D+32.5
Not yet ingested
- Civics
- —
Market trends
- HPI YoY
- ▼ -154.90%
- Current HPI
- 132.3632
- Rent YoY
- ▼ -1.04%
- Metro
- Flint, MI
- State GDP YoY
- ▲ 1.37%
- F500 in state
- 28
Industry mix (Fortune 500 HQ in MI)
| Industry | F500 HQs | Revenue |
|---|---|---|
| Automotive Parts | 3 | $48B |
|
||
| Automotive | 2 | $372B |
|
||
| Chemicals | 1 | $45B |
|
||
| Automotive Retail | 1 | $29B |
|
||
| Healthcare / Medical Devices | 1 | $23B |
|
||
| Automotive Technology | 1 | $20B |
|
||
Price history
+88.1% since first listed20 events — show timeline
- 2026-05-27 Listed $64,900 REALCOMP
- 2026-05-27 Listed $64,900 MiRealSource-MiMLS
- 2025-10-25 Rental Removed $825 APPFOLIO
- 2025-09-19 Price Changed $825 APPFOLIO
- 2025-08-06 Listed for Rent $900 APPFOLIO
- 2010-10-19 Sold (MLS) $5,100 MiRealSource-MiMLS
- 2010-10-19 Sold (MLS) $5,100 REALCOMP
- 2010-07-21 Listing Removed — MiRealSource-MiMLS
- 2010-05-21 Listed $8,000 MiRealSource-MiMLS
- 2010-05-21 Listed $8,000 REALCOMP
- 2000-01-27 Sold (MLS) $37,005 MiRealSource-MiMLS
- 2000-01-27 Sold (MLS) $37,005 REALCOMP
- 1999-12-08 Listing Removed — MiRealSource-MiMLS
- 1999-12-03 Listed $35,000 MiRealSource-MiMLS
- 1999-12-03 Listed $35,000 REALCOMP
- 1995-11-20 Sold (MLS) $37,550 MiRealSource-MiMLS
- 1995-11-20 Sold (MLS) $37,550 REALCOMP
- 1995-10-18 Listing Removed — MiRealSource-MiMLS
- 1995-10-10 Listed $34,500 MiRealSource-MiMLS
- 1995-10-10 Listed $34,500 REALCOMP
Property tax history
+1.7%/yrLatest (2025): $1,783 · -12.7% YoY. Source: county tax records.
Cash-flow waterfall
monthlySold comps — $/sqft
last 12 mo · ≤1 miLoading sold comps…