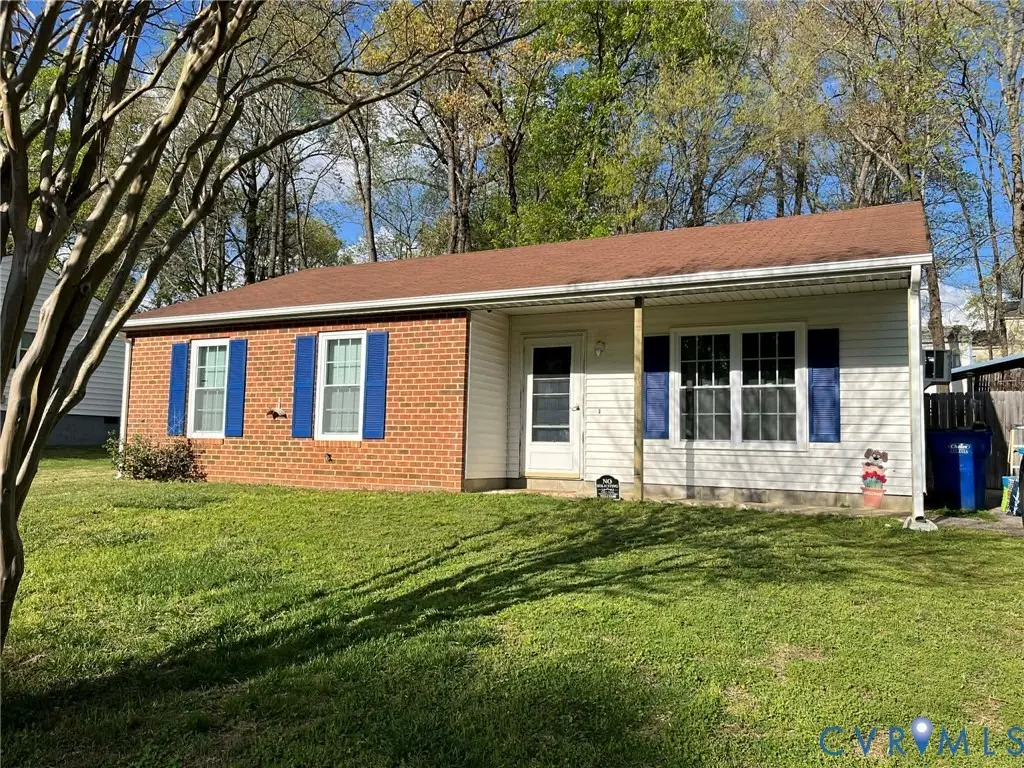
8907 Talon Ln · Meadowbrook, VA
Flood risk 6/10 · Moderate
- FEMA flood zone
- X (unshaded)
- Chance of flooding over 30 yrs
- 0.74%
- Est. flood insurance / yr
- $507 – $1,088
Fire risk 2/10 · Minimal
- Est. fire insurance / yr
- $666 – $1,236
Heat risk 7/10 · Major
- Hot days now (above 106°F)
- 7 days/yr
- Hot days in 30 yrs
- 16 days/yr
Wind risk 6/10 · Moderate
- Chance of severe wind over 30 yrs
- 27.0%
Air-quality risk 2/10 · Minimal
- Unhealthy air days now
- 0 days/yr
- Unhealthy air days in 30 yrs
- 1 days/yr
Risk factors via First Street. Map © Google.
Why this score? — see what drove the D grade
The composite is a weighted blend of 9 inputs, each scored 0–100. Each bar is that input's sub-score; the figure is the points it added to the 100-point composite (weight × sub-score).
- Cash flow +13.8/30.0
- ARV discount +8.2/15.0
- Schools +5.2/10.0
- DSCR +4.2/10.0
- Livability +3.7/5.0
- 1% rule +3.1/10.0
- Rent growth +2.5/5.0
- Condition / age +2.5/5.0
- Appreciation +0.0/10.0
$265,000
🖨 Deal sheet (PDF) 📄 Offer letter ✓ Due diligence
Listing remarks MLS
Come check out this nice 3 bedroom 2 bath home. The interior features an open family room and kitchen. There is a built-in custom bar between the family room and kitchen. There is a large utility room with custom shelving for storage. The three bedrooms are spacious. There are newer vinyl replacement windows and the roof is only a couple years old. The backyard is fenced with a patio. There is a storage shed that conveys as well.
Key facts
- 0.24 acre lot
- Built 1986
- Listed 16 days
Property features AI
Exterior
- Parking: No garage; Off-street parking
- Utilities: Public water; Public sewer; Electric water heater
- Home design: Single-story home; Resale property
- Construction: Brick and frame construction with vinyl siding; Composition shingle roof; Slab foundation; Built previously (actual year built not specified)
- Exterior features: Rear porch; Patio; Outbuilding / storage shed; Fenced backyard with wood privacy fencing
Interior
- Kitchen: Open kitchen to great room; Dishwasher; Electric cooking; Oven; Refrigerator; Stove
- Bedrooms: Bedroom 2 (first level) — new carpet, fresh paint; Bedroom 3 (first level) — new carpet, fresh paint; Additional bedroom/great room area (first level) with new carpet and fresh paint
- Flooring: Carpet; Vinyl
- Bathrooms: 1 full bathroom with tub and shower
- Heating & cooling: Electric baseboard heating; Window and wall cooling units
- Interior features: Bedroom on main level; Main level primary
- Laundry & utility: First-level laundry room
Neighborhood map
What this means for you Summary
Snapshot
- This is a 3-bed/1.0-bath single-family listed at $265k.
Deal economics
- At list price, monthly cash flow is $24 ($288/yr) — positive.
- The deal already cash-flows at list — no discount required.
- To meet the 1% rule (rent ≥ 1% of price), the offer needs to be $214k (19.1% below list).
- Recommended offer: $214k (19.1% below list) — sets the bar for 1% rule.
- Cap rate 6.4% vs local median 3.9% in Meadowbrook — top-decile yield for the area; either an underpriced asset or a hidden risk that comps aren't pricing in. Stress-test before assuming the spread holds.
Location & tenants
- Location reads 73/100 on livability (#161 in VA) — a middle-class / working-renter tenant base. Strengths: housing A+, health & safety A+, cost of living A-; Watch: amenities F, commute F.
- Chesterfield County Public School District (suburban): math 52% / reading 64% proficiency, ranked #57 of 131 in VA (top 44%) — acceptable for families but not a draw, mixed tenant base, ~2y average lease.
- Zoned schools: Beulah Elementary (math 30% / reading 49%, grade F, #900 of 1,108 statewide, top 83%, 989 students, 80% FRL); Salem Church Middle (math 34% / reading 44%, grade F, #309 of 342 statewide, top 91%, 910 students, 80% FRL); Lloyd C. Bird High (math 40% / reading 73%, grade C, #270 of 319 statewide, top 86%, 2,031 students, 79% FRL) — zoned schools average 80% FRL vs 26% district-wide (53 pts higher); higher-poverty schools than district average — tighter screening recommended.
- Zoned-school proficiency averages 45% at this address vs 58% district-wide (-13 pts) — the specific schools serving this property underperform the Chesterfield County Public School District average; the district grade overstates school quality for this exact location.
- Market conditions: 136 active listings in the ZIP; 4 comparable units currently listed for rent nearby; rentals lingering (median 46d on market — plan ~5-8 weeks vacancy on turnover, expect pricing pressure); 50% of comp listings sitting > 30 days — soft ceiling on asking rent; solid renter incomes; 2,307 units permitted in Chesterfield County in 2024 (462 in 5+ unit buildings).
- This rent runs 32% of the median local income ($80k/yr) — at the standard rent-burdened threshold; future hikes will face affordability resistance.
Forward outlook
- Local home prices are declining (-3.0%/yr); year-one equity from $2k of loan paydown is wiped out by about $8k of value loss. Plan a longer hold.
- Chesterfield County population projected at +20% by 2050 — long-run rental-demand tailwind backs the buy-and-hold thesis.
Negotiation context
- It's been on market 16 days — a 2% lower offer ($261k) is reasonable based on typical stale-listing flexibility.
- 6 sale attempts since 24y ago with the ask held roughly flat each time — persistent listings suggest the price (not the market) is what's stuck; bring a comps-based counter.
- Current owner paid $75k; list at $265k implies a 253% gain — meaningful room to come down on a strong offer.
Risks & watch-outs
- Climate carrying-cost: major flood risk; major wind risk, 27% chance of damaging wind over 30y; extreme-heat days projected 7→16/yr by 2055 (HVAC capex compounding) — expect insurance premiums to compound above CPI over the hold.
Questions for the listing agent
- Is there a deadline driving the sale (1031 exchange, divorce, estate, relocation)? That informs how much negotiation room exists.
- Schools are B-rated — typically a magnet for longer-tenancy family renters. What's the average tenant stay here, and is there a school-zone premium baked into asking?
- The area grade is low — what's the realistic commute time and amenity access for the typical tenant pool here? Any planned neighborhood developments (good or bad) we should know about?
- What's the average days-on-market for RENTAL listings here right now (not sales)? A rising rental-DOM trend means longer vacancies and softer asking-rent achievability than the comps imply.
- What's the recent tenant-quality profile in this submarket — average credit score on applications, eviction rate, late-payment / NSF rate, and stable-employment percentage? A property-management company in the area should have these aggregated.
- How much new for-sale + rental construction is in the pipeline within 1–3 miles? Heavy new supply typically softens prices + rents 12–24 months out; constrained supply supports both.
Investment metrics
- 1% rule
- 0.81% ✗
- Cap rate
- 6.40%
- Cash-on-cash
- 0.39%
- DSCR
- 1.02
- GRM
- 10.3
CMA / ARV
- ARV (on-the-fly)
- $269,336
- Comps found
- 12
Show comp detail 12 sales within ~0.75 mi
| Address | Dist | Beds/Ba | Sqft | Sold | Price | $/sf | Match |
|---|---|---|---|---|---|---|---|
| 8907 Talon Ln | 0.00mi | 3/1.0 | 1,048 (0%) | 1mo | $265,000 | $253 | 99 |
| 4271 Laurel Oak Rd | 0.32mi | 3/2.0 | 1,056 (+1%) | 6mo | $288,000 | $273 | 75 |
| 9100 Hopkins Rd | 0.30mi | 3/1.5 | 1,056 (+1%) | 14mo | $181,250 | $172 | 71 |
| 4317 Laurel Oak Rd | 0.42mi | 3/1.5 | 1,056 (+1%) | 8mo | $274,500 | $260 | 70 |
| 4139 Laurel Oak Rd | 0.19mi | 3/1.5 | 996 (-5%) | 19mo | $260,000 | $261 | 65 |
| 4244 Laurel Oak Rd | 0.23mi | 3/2.0 | 1,188 (+13%) | 2mo | $320,000 | $269 | 61 |
| 8718 Firethorne Ln | 0.54mi | 3/1.5 | 1,056 (+1%) | 14mo | $255,000 | $241 | 60 |
| 9009 Laurel Oaks | 0.27mi | 3/1.0 | 954 (-9%) | 16mo | $257,800 | $270 | 59 |
| 9006 Blue Oak Ct | 0.26mi | 3/2.0 | 1,175 (+12%) | 20mo | $302,000 | $257 | 47 |
| 8719 Firethorne Ln | 0.57mi | 3/2.0 | 1,166 (+11%) | 7mo | $270,000 | $232 | 45 |
| 8901 Firethorne Ln | 0.55mi | 3/2.0 | 1,202 (+15%) | 5mo | $275,500 | $229 | 42 |
| 9232 Lost Forest Dr | 0.75mi | 3/1.5 | 1,120 (+7%) | 17mo | $268,000 | $239 | 37 |
Match score weights: distance 35% · size 25% · config 20% · recency 20%. Top-matched comps best support the ARV.
Projected returns pro-forma
-3.0% appreciation · 3.0% rent growth · sell at horizon
- IRR
- -15.7%
- Equity multiple
- 0.44×
- Total profit
- $-41,479
- Equity at exit
- $39,512
- IRR
- -7.3%
- Equity multiple
- 0.54×
- Total profit
- $-34,420
- Equity at exit
- $22,912
Cash invested: $74,200 (down + closing). Projections, not guarantees.
Landlord ↔ Tenant lean methodology
- Overall (STATE)
- 55 Moderately Landlord-Leaning
- State Virginia
- 55 Moderately Landlord-Leaning · D+2
- County
- — inherits STATE
- City
- — inherits STATE
ZIP-level market 23237
- Active inventory
- 136
- Price-to-rent
- 10.3×
Monthly cashflow live
- Estimated rent
- $2,145 medium interval (Pro) →
- Mortgage (P&I)
- −$1,390
- Tax from tax record
- −$170 /mo · $2,045/yr
- Insurance
- −$110
- HOA
- −$0
- Vacancy / Maint / Mgmt
- −$450
- Net cashflow
- $24
Break-even live
Sensitivity live
| Price | -10% $174 | -5% $99 | +0% $24 | +5% $-51 | +10% $-126 |
|---|---|---|---|---|---|
| Rent | -10% $-145 | -5% $-61 | +0% $24 | +5% $109 | +10% $193 |
| Rate | -1.0pp $157 | -0.5pp $91 | base $24 | +0.5pp $-45 | +1.0pp $-115 |
UW: 25.0% down · 7.5% · 30yr · 1.5% tax · 5.0% vac · 8.0% maint · 8.0% mgmt
Financing live
Cash to close
- Down payment
- $66,250
- Closing costs
- $7,950
- Reserves months
- —
- Total cash needed
- —
Loan-product check · same deal, 3 products live
Conventional
25% down · 7.5% · 30yr
- Down + closing
- —
- Monthly P&I
- —
- Monthly cashflow
- —
- DSCR
- —
- Eligible?
- —
Personal DTI + credit; lowest rate.
DSCR
20% down · 8.5% · 30yr
- Down + closing
- —
- Monthly P&I
- —
- Monthly cashflow
- —
- DSCR
- —
- Eligible?
- —
No personal income docs; deal must DSCR.
Hard money
10% down · 12.0% · 12mo
- Down + closing
- —
- Monthly P&I
- —
- Monthly cashflow
- —
- DSCR
- —
- Eligible?
- —
Short-term bridge; refi at stabilization.
Rent comps 4 comps
| Address | Beds | Baths | Sqft | Rent | $/sqft | DOM | Units | Dist |
|---|---|---|---|---|---|---|---|---|
| 5106 Chesswood Dr North Chesterfield, VA | 3.0 | 2.0 | 1096 | $1,995 | $1.82 | 25d | 1 | 0.77mi |
| 5401 Bellmeadows Rd North Chesterfield, VA | 3.0 | 1.5 | 1152 | $2,095 | $1.82 | 45d | 1 | 1.21mi |
| 5712 Sara Kay Dr North Chesterfield, VA | 3.0 | 2.0 | 1008 | $2,200 | $2.18 | 45d | 1 | 1.36mi |
| 5712 Sara Kay Dr North Chesterfield, VA | 3.0 | 2.0 | 1008 | $2,100 | $2.08 | 25d | 1 | 1.36mi |
Listing history 17 events
-
2026-04-30status Pending
-
2026-04-15$265,000 Active
-
2026-04-08historical $265,000
-
2014-06-30soldstatus $75,000
-
2014-06-27soldstatus $75,000 433-char remark
Show marketing remark (433 chars)
Come check out this nice 3 bedroom 2 bath home. The interior features an open family room and kitchen. There is a built-in custom bar between the family room and kitchen. There is a large utility room with custom shelving for storage. The three bedrooms are spacious. There are newer vinyl replacement windows and the roof is only a couple years old. The backyard is fenced with a patio. There is a storage shed that conveys as well.
-
2014-02-25historical 433-char remark
Show marketing remark (433 chars)
Come check out this nice 3 bedroom 2 bath home. The interior features an open family room and kitchen. There is a built-in custom bar between the family room and kitchen. There is a large utility room with custom shelving for storage. The three bedrooms are spacious. There are newer vinyl replacement windows and the roof is only a couple years old. The backyard is fenced with a patio. There is a storage shed that conveys as well.
-
2014-02-08$75,000 433-char remark
Show marketing remark (433 chars)
Come check out this nice 3 bedroom 2 bath home. The interior features an open family room and kitchen. There is a built-in custom bar between the family room and kitchen. There is a large utility room with custom shelving for storage. The three bedrooms are spacious. There are newer vinyl replacement windows and the roof is only a couple years old. The backyard is fenced with a patio. There is a storage shed that conveys as well.
-
2008-08-08historical
-
2008-08-08historical
-
2008-06-23$140,000
-
2008-06-23$140,000
-
2002-05-31soldstatus $87,500
-
2002-05-31soldstatus $87,500
-
2002-03-23$87,500
-
2002-03-23$87,500
-
1994-05-09soldstatus $54,950
-
1986-01-15soldstatus $51,480
ⓘ Source: listings_history table (triggers on properties + properties_extension) + one-shot
backfill from property_details.listing_events for pre-trigger history.
Tax reassessment forecast VA · Resets to sale price
- Current annual tax
- $2,045 · $170/mo
- Projected year-2 tax
- $2,173 · $181/mo
- Expected delta
- +$128/yr (+$11/mo · 6.2%)
ⓘ Screening estimate from a state-policy table — verify with the county assessor before closing.
Climate risk First Street
- Flood 6/10 Major FEMA zone X (unshaded) · 74% chance over 30 yrs
- Wildfire 2/10 Low
- Heat 7/10 Severe 7 d/yr ≥106°F today · 16 d/yr by 30 yrs out
- Wind 6/10 Major 27% chance of damaging wind over 30 yrs
- Air quality 2/10 Low 0 unhealthy d/yr today · 1 by 30 yrs out
Nearby sold comps map
Loading sold comps map…
Walkable amenities ~0.75 mi
Loading nearby amenities…
Taxation est. · year 1
- Rental income
- $25,740
- − Mortgage interest
- −$14,844
- − Property taxes
- −$2,045
- − Insurance
- −$1,325
- − Repairs & maintenance
- −$2,059
- − Management
- −$2,059
- − Depreciation
- −$7,709
- Taxable loss
- −$4,302
- Est. tax savings @ 24.0%
- +$1,032
- After-tax cash flow
- $1,321/yr
For passive investors: Depreciation is non-cash, so a rental often shows a tax loss while cash-flowing — sheltering income. Rental losses are passive: they offset passive income freely, and up to $25,000/yr can offset ordinary (W-2) income if you actively participate and your MAGI is under $100k (phasing out to $0 by $150k); unused losses carry forward. On sale, claimed depreciation is recaptured at up to 25%, and gains may owe capital-gains tax (a 1031 exchange can defer both). Figures are a year-1 estimate at your 24.0% rate — not tax advice; consult a CPA.
Schools (NCES district)
- District
- Chesterfield County Public School District
- NCES district ID
- 5100840
- Math proficiency
- 52% ▼ -30.00%
- Reading proficiency
- 64% ▼ -15.00%
- Median HH income
- $72,821
- Composite
- 51.56/100
- National rank
- #1712
- State rank
- #57 of 131 in VA
Livability — Meadowbrook
- Score
- 73/100
- State rank
- #161
- US rank
- #5004
Category grades
Schools grade is shown separately in the Schools card above.
Census & demographics
- County
- Chesterfield County · 406,988 people
- City population
- 46,284
- Metro
- Richmond, VA
- Population (ZIP)
- 27,126
- Household income
- $79,606
- Rent vs Own
- Severe rent burden
- 706.0
Population outlook (Chesterfield County) Hauer SSP2
- Today (2025)
- 377,190 people
- By 2030
- 395,710 · +4.9%
- By 2040
- 427,694 · +13.4%
- By 2050
- 452,706 · +20.0%
- By 2075
- 505,533 · +34.0%
- By 2100
- 521,282 · +38.2%
Race, ethnicity, and origin ACS 2023
- Neighborhood character
- Diverse neighborhood (Simpson 0.69)
- Race & ethnicity
- White 41% Black 28% Hispanic / Latino 25% Two or more races 8% Asian 2%
- Hispanic origin (detail)
- Mexican 6% Puerto Rican 1%
- Common ancestry
- Slovak 2% Italian 1% Lithuanian 1%
- Foreign-born
- 15% · Canada, China, Jamaica
- Languages at home
- 76% English-only · Spanish 21% French/Haitian/Cajun 1%
Political lean MEDSL · Chesterfield
- 2024 margin
- Lean D (+9.0) · D 53.8% · R 44.8% · Other 1.4%
- 2008→2024 swing
- +16.4pp toward D · 2008: -7.5pp · 2024: 9.0pp
- All cycles
- 2024: D+9.0 2020: D+6.7 2016: R+2.2 2012: R+7.1 2008: R+7.5
Not yet ingested
- Civics
- —
Market trends
- HPI YoY
- ▼ -248.73%
- Current HPI
- 303.329
- Rent YoY
- —
- Metro
- Richmond, VA
- State GDP YoY
- ▲ 2.40%
- F500 in state
- 50
Industry mix (Fortune 500 HQ in VA)
| Industry | F500 HQs | Revenue |
|---|---|---|
| Aerospace / Defense | 4 | $236B |
|
||
| Technology / Defense | 3 | $32B |
|
||
| Financial Services | 2 | $176B |
|
||
| Utilities | 2 | $27B |
|
||
| Insurance | 2 | $25B |
|
||
| Technology | 2 | $15B |
|
||
Price history
+414.8% since first listed17 events — show timeline
- 2026-04-30 Pending — CVRMLS
- 2026-04-15 Listed $265,000 CVRMLS
- 2026-04-08 Coming Soon $265,000 CVRMLS
- 2014-06-30 Sold (Public Records) $75,000 Public Records
- 2014-06-27 Sold (MLS) $75,000 CVRMLS
- 2014-02-25 Listing Removed — CVRMLS
- 2014-02-08 Listed $75,000 CVRMLS
- 2008-08-08 Listing Removed — CVRMLS
- 2008-08-08 Listing Removed — CVRMLS
- 2008-06-23 Listed $140,000 CVRMLS
- 2008-06-23 Listed $140,000 CVRMLS
- 2002-05-31 Sold (Public Records) $87,500 Public Records
- 2002-05-31 Sold (MLS) $87,500 CVRMLS
- 2002-03-23 Listed $87,500 CVRMLS
- 2002-03-23 Listed $87,500 CVRMLS
- 1994-05-09 Sold (Public Records) $54,950 Public Records
- 1986-01-15 Sold (Public Records) $51,480 Public Records
Property tax history
+4.5%/yrLatest (2025): $2,045 · +4.9% YoY. Source: county tax records.
Cash-flow waterfall
monthlySold comps — $/sqft
last 12 mo · ≤1 miLoading sold comps…