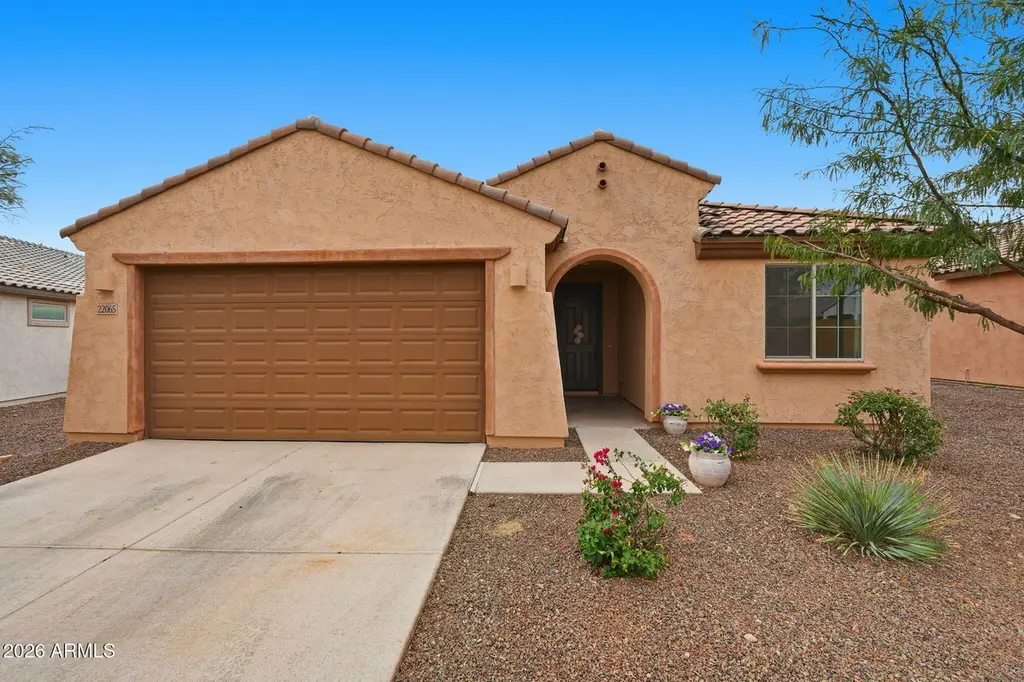
22065 N 259th Ave · Buckeye, AZ
Flood risk 1/10 · Minimal
- FEMA flood zone
- X (shaded)
- Chance of flooding over 30 yrs
- 0.0%
- Est. flood insurance / yr
- $507 – $1,088
Fire risk 5/10 · Moderate
- Est. fire insurance / yr
- $610 – $1,132
Heat risk 9/10 · Severe
- Hot days now (above 111°F)
- 7 days/yr
- Hot days in 30 yrs
- 18 days/yr
Wind risk 1/10 · Minimal
- Chance of severe wind over 30 yrs
- —
Air-quality risk 2/10 · Minimal
- Unhealthy air days now
- 0 days/yr
- Unhealthy air days in 30 yrs
- 1 days/yr
Risk factors via First Street. Map © Google.
Why this score? — see what drove the D grade
The composite is a weighted blend of 9 inputs, each scored 0–100. Each bar is that input's sub-score; the figure is the points it added to the 100-point composite (weight × sub-score).
- Cash flow +11.8/30.0
- ARV discount +11.1/15.0
- DSCR +3.5/10.0
- Rent growth +3.4/5.0
- Livability +3.4/5.0
- 1% rule +2.9/10.0
- Schools +2.9/10.0
- Condition / age +2.5/5.0
- Appreciation +0.0/10.0
$360,000
🖨 Deal sheet 📄 Offer letter ✓ Due diligence
Listing remarks
Move-in ready 2021 home with modern upgrades--no builder wait. Open-concept great room flows into a stylish kitchen with upgraded cabinetry, enhanced lighting, and generous counter space, ideal for entertaining and everyday living. Split-bedroom floor plan offers privacy, plus a versatile den perfect for a home office, gym, or flex space. Spacious primary suite features a walk-in closet and private bath. Enjoy a covered patio and oversized grass backyard with room to relax or host. Located near parks, splash pad, and greenbelts with easy access to shopping, dining, and commuting routes--this home delivers comfort, function, and long-term value.
Key facts
- Covered patio
- Large grass backyard
- Open-concept layout
Tags
Property features AI
Finance
- Financial info: Conventional financing available
- HOA & community: HOA with monthly fee of $125 covering grounds maintenance; Community playground; Biking/walking paths; Association rules prohibit visible trucks, trailers, RVs, and boats
Exterior
- Parking: 2 covered parking spaces; 2 open parking spaces; 2-car garage
- Utilities: City water; Public sewer
- Home design: Single family residence; Fee simple ownership
- Construction: Stucco and wood frame construction; Painted exterior
- Exterior features: Desert front yard; Grass in back yard; Automatic irrigation with timers front and back; Block fencing; Tile roof
Interior
- Kitchen: Built-in microwave; Reverse osmosis; Dishwasher; Garbage disposal; Kitchen island; Pantry; Granite counters
- Bedrooms: Up to 4 bedrooms possible
- Flooring: Carpet; Tile
- Bathrooms: 2 full bathrooms
- Heating & cooling: Natural gas heating; Central air; Ceiling fans; Programmable thermostat
- Interior features: Granite counters; Double vanity; Full bath in primary bedroom; Kitchen island; Pantry; Dual pane windows
- Laundry & utility: Inside laundry
Neighborhood map
What this means for you Summary
Snapshot
- This is a 3-bed/3.0-bath single-family listed at $360k.
Deal economics
- At list price, monthly cash flow is $-99 ($-1k/yr) — negative.
- To cash-flow at today's rent, offer at most $342k (4.9% below list).
- To meet the 1% rule (rent ≥ 1% of price), the offer needs to be $283k (21.3% below list).
- Recommended offer: $283k (21.3% below list) — sets the bar for 1% rule.
- Cap rate 6.0% vs local median 3.1% in Buckeye — top-decile yield for the area; either an underpriced asset or a hidden risk that comps aren't pricing in. Stress-test before assuming the spread holds.
Location & tenants
- Location reads 68/100 on livability (#53 in AZ) — a middle-class / working-renter tenant base. Strengths: employment A+, housing A+, crime A; Watch: amenities F, commute F, health & safety F.
- Wickenburg Unified District (4236) (rural): math 33% / reading 35% proficiency, ranked #92 of 249 in AZ (top 37%) — families likely to look elsewhere, expect single-tenant / working-renter base with shorter leases.
- Zoned schools: Festival Foothills Elementary School (math 47% / reading 47%, grade D-, #308 of 1,109 statewide, top 29%, 314 students, 31% FRL); Wickenburg High School (math 27% / reading 32%, grade F, #120 of 381 statewide, top 34%, 460 students, 40% FRL).
- Market conditions: Rents rising (+3.4%/yr); 939 active listings in the ZIP; 13 comparable units currently listed for rent nearby; rentals leasing fast (median 5d on market — plan ~1-2 weeks tenant-placement turnaround); high-income renter base; 36,011 units permitted in Maricopa County in 2024 (12,801 in 5+ unit buildings).
Forward outlook
- Local home prices are declining (-3.0%/yr); year-one equity from $2k of loan paydown is wiped out by about $11k of value loss. Plan a longer hold.
- Maricopa County population projected at +38% by 2050 — long-run rental-demand tailwind backs the buy-and-hold thesis.
Negotiation context
- It's been on market 113 days — a 9% lower offer ($328k) is reasonable based on typical stale-listing flexibility.
Risks & watch-outs
- Climate carrying-cost: moderate wildfire risk; extreme-heat days projected 7→18/yr by 2055 (HVAC capex compounding) — expect insurance premiums to compound above CPI over the hold.
Questions for the listing agent
- What do current leases actually rent for vs. the listed asking? Can we see a recent rent roll and the last 12 months of T-12 income?
- It's been on market 113 days. Have you received any prior offers? Is the seller open to a 21% concession, seller financing, or rate buy-down credit?
- What does the HOA fee cover, when was the last increase, and are there any pending special assessments or reserve-fund shortfalls?
- Why hasn't it sold? Are there any deal-killer items the seller is aware of (foundation, flood, title, zoning, code violations)?
- Is there a deadline driving the sale (1031 exchange, divorce, estate, relocation)? That informs how much negotiation room exists.
- Schools are D-rated, which usually means shorter tenancies and higher turnover. Who's the typical renter profile here, and what's been the actual vacancy rate?
- The area grade is low — what's the realistic commute time and amenity access for the typical tenant pool here? Any planned neighborhood developments (good or bad) we should know about?
- What's the average days-on-market for RENTAL listings here right now (not sales)? A rising rental-DOM trend means longer vacancies and softer asking-rent achievability than the comps imply.
- What's the recent tenant-quality profile in this submarket — average credit score on applications, eviction rate, late-payment / NSF rate, and stable-employment percentage? A property-management company in the area should have these aggregated.
- How much new for-sale + rental construction is in the pipeline within 1–3 miles? Heavy new supply typically softens prices + rents 12–24 months out; constrained supply supports both.
Investment metrics
- 1% rule
- 0.79% ✗
- Cap rate
- 5.96%
- Cash-on-cash
- -1.18%
- DSCR
- 0.95
- GRM
- 10.6
CMA / ARV
- ARV (on-the-fly)
- $391,045
- Comps found
- 12
Show comp detail 12 sales within ~0.75 mi
| Address | Dist | Beds/Ba | Sqft | Sold | Price | $/sf | Match |
|---|---|---|---|---|---|---|---|
| 22065 N 259th Ave | 0.00mi | 3/2.0 | 1,985 (0%) | 1mo | $355,000 | $179 | 95 |
| 25915 W Tina Ln | 0.14mi | 3/2.0 | 1,993 (+0%) | 1mo | $365,000 | $183 | 88 |
| 25967 W Sands Dr | 0.11mi | 3/2.0 | 2,172 (+9%) | 3mo | $395,000 | $182 | 73 |
| 21912 N 259th Ln | 0.19mi | 4/2.0 (+1) | 2,129 (+7%) | 0mo | $375,000 | $176 | 70 |
| 25965 W Via Del Sol Dr | 0.26mi | 4/2.0 (+1) | 1,879 (-5%) | 2mo | $370,000 | $197 | 68 |
| 25927 W Swilling Rd | 0.20mi | 4/2.0 (+1) | 1,879 (-5%) | 7mo | $357,000 | $190 | 67 |
| 25915 W Deer Valley Rd | 0.31mi | 3/2.0 | 2,137 (+8%) | 3mo | $485,000 | $227 | 66 |
| 21893 N 261st Ave N | 0.29mi | 2/2.0 (-1) | 1,819 (-8%) | 4mo | $395,900 | $218 | 60 |
| 21157 N 259th Ave | 0.65mi | 3/2.0 | 2,061 (+4%) | 6mo | $485,000 | $235 | 54 |
| 21139 N 259th Ave | 0.66mi | 3/2.0 | 1,783 (-10%) | 2mo | $372,400 | $209 | 47 |
| 26456 W Cat Balue Dr | 0.74mi | 2/2.0 (-1) | 1,829 (-8%) | 2mo | $380,000 | $208 | 42 |
| 25974 W Horsham Dr | 0.56mi | 4/3.0 (+1) | 2,270 (+14%) | 6mo | $378,000 | $167 | 40 |
Match score weights: distance 35% · size 25% · config 20% · recency 20%. Top-matched comps best support the ARV.
Projected returns pro-forma
-3.0% appreciation · 3.41% rent growth · sell at horizon
- IRR
- -17.8%
- Equity multiple
- 0.37×
- Total profit
- $-63,541
- Equity at exit
- $53,677
- IRR
- -9.3%
- Equity multiple
- 0.42×
- Total profit
- $-58,829
- Equity at exit
- $31,126
Cash invested: $100,800 (down + closing). Projections, not guarantees.
Landlord ↔ Tenant lean methodology
- Overall (STATE)
- 87 Strongly Landlord-Friendly
- State Arizona
- 87 Strongly Landlord-Friendly · R+3
- County
- — inherits STATE
- City
- — inherits STATE
ZIP-level market 85396
- Home prices YoY
- -18.8%
- Rents YoY
- 3.4%
- Active inventory
- 939
- Price-to-rent
- 10.6×
Monthly cashflow live
- Estimated rent
- $2,832 high interval (Pro) →
- Mortgage (P&I)
- −$1,888
- Tax from tax record
- −$174 /mo · $2,084/yr
- Insurance
- −$150
- HOA
- −$125
- Vacancy / Maint / Mgmt
- −$595
- Net cashflow
- $-99
Break-even live
UW: 25.0% down · 7.5% · 30yr · 1.5% tax · 5.0% vac · 8.0% maint · 8.0% mgmt
Financing live
Cash to close
- Down payment
- $90,000
- Closing costs
- $10,800
- Reserves months
- —
- Total cash needed
- —
Loan-product check · same deal, 3 products live
Conventional
25% down · 7.5% · 30yr
- Down + closing
- —
- Monthly P&I
- —
- Monthly cashflow
- —
- DSCR
- —
- Eligible?
- —
Personal DTI + credit; lowest rate.
DSCR
20% down · 8.5% · 30yr
- Down + closing
- —
- Monthly P&I
- —
- Monthly cashflow
- —
- DSCR
- —
- Eligible?
- —
No personal income docs; deal must DSCR.
Hard money
10% down · 12.0% · 12mo
- Down + closing
- —
- Monthly P&I
- —
- Monthly cashflow
- —
- DSCR
- —
- Eligible?
- —
Short-term bridge; refi at stabilization.
Rent comps 13 comps
| Address | Beds | Baths | Sqft | Rent | $/sqft | DOM | Units | Dist |
|---|---|---|---|---|---|---|---|---|
| 26208 W Tina Ln Buckeye, AZ | 2.0 | 2.0 | 1612 | $1,999 | $1.24 | 12d | 1 | 0.40mi |
| 26195 W Via del Sol Dr Buckeye, AZ | 2.0 | 2.0 | 1493 | $3,300 | $2.21 | 1d | 1 | 0.41mi |
| 26197 W Vista North Dr Buckeye, AZ | 2.0 | 2.0 | 1375 | $2,850 | $2.07 | 10d | 1 | 0.45mi |
| 26197 W Vista North Dr Buckeye, AZ | 2.0 | 2.0 | 1375 | $2,900 | $2.11 | 1d | 1 | 0.45mi |
| 26028 W Matthew Dr Unit NA Buckeye, AZ | 3.0 | 2.0 | 2000 | $2,750 | $1.38 | 43d | 1 | 0.70mi |
| 26237 W Matthew Dr Buckeye, AZ | 2.0 | 2.0 | 1646 | $3,500 | $2.13 | 1d | 1 | 0.82mi |
| 26043 W Potter Dr Buckeye, AZ | 3.0 | 2.5 | 2025 | $1,900 | $0.94 | 2d | 1 | 0.95mi |
| 26653 W Firehawk Dr Unit 1302342P Buckeye, AZ | 2.0 | 2.0 | 1883 | $2,459 | $1.31 | 1d | 1 | 0.98mi |
| 26477 W Ross Ave Buckeye, AZ | 3.0 | 2.0 | 1375 | $1,500 | $1.09 | 43d | 1 | 1.14mi |
| 20493 N 264th Ave Buckeye, AZ | 2.0 | 2.0 | 1961 | $4,200 | $2.14 | 1d | 1 | 1.25mi |
| 20669 N 266th Ave Buckeye, AZ | 3.0 | 2.0 | 1612 | $4,200 | $2.61 | 24d | 1 | 1.27mi |
| 26824 W Potter Dr Buckeye, AZ | 2.0 | 2.0 | 2092 | $3,500 | $1.67 | 43d | 1 | 1.45mi |
| 26766 W Mohawk Ln Buckeye, AZ | 2.0 | 2.0 | 1375 | $2,500 | $1.82 | 4d | 1 | 1.47mi |
HOA detail
- Monthly dues
- $125 · $1,500/yr
- Likely covers
- gym
Listing history 4 events
-
2026-05-01status Pending
-
2026-04-07price $360,000
-
2026-02-27price $375,000
-
2026-01-07$385,000 Active
ⓘ Source: listings_history table (triggers on properties + properties_extension) + one-shot
backfill from property_details.listing_events for pre-trigger history.
Tax reassessment forecast AZ · Resets to sale price
- Current annual tax
- $2,084 · $174/mo
- Projected year-2 tax
- $2,376 · $198/mo
- Expected delta
- +$292/yr (+$24/mo · 14.0%)
ⓘ Screening estimate from a state-policy table — verify with the county assessor before closing.
Climate risk First Street
- Flood 1/10 Low FEMA zone X (shaded) · 0% chance over 30 yrs
- Wildfire 5/10 Major
- Heat 9/10 Extreme 7 d/yr ≥111°F today · 18 d/yr by 30 yrs out
- Wind 1/10 Low
- Air quality 2/10 Low 0 unhealthy d/yr today · 1 by 30 yrs out
Nearby sold comps map
Loading sold comps map…
Walkable amenities ~0.75 mi
Loading nearby amenities…
Taxation est. · year 1
- Rental income
- $33,983
- − Mortgage interest
- −$20,166
- − Property taxes
- −$2,084
- − Insurance
- −$1,800
- − Repairs & maintenance
- −$2,719
- − Management
- −$2,719
- − HOA
- −$1,500
- − Depreciation
- −$10,473
- Taxable loss
- −$7,477
- Est. tax savings @ 24.0%
- +$1,794
- After-tax cash flow
- $602/yr
For passive investors: Depreciation is non-cash, so a rental often shows a tax loss while cash-flowing — sheltering income. Rental losses are passive: they offset passive income freely, and up to $25,000/yr can offset ordinary (W-2) income if you actively participate and your MAGI is under $100k (phasing out to $0 by $150k); unused losses carry forward. On sale, claimed depreciation is recaptured at up to 25%, and gains may owe capital-gains tax (a 1031 exchange can defer both). Figures are a year-1 estimate at your 24.0% rate — not tax advice; consult a CPA.
Schools (NCES district)
- District
- Wickenburg Unified District (4236)
- NCES district ID
- 0409190
- Math proficiency
- 33% ▼ -10.00%
- Reading proficiency
- 35% ▼ -7.00%
- Median HH income
- $47,369
- Composite
- 29.27/100
- National rank
- #6560
- State rank
- #92 of 249 in AZ
Livability — Buckeye
- Score
- 68/100
- State rank
- #53
- US rank
- #9428
Category grades
Schools grade is shown separately in the Schools card above.
Census & demographics
- Census place
- Buckeye, AZ
- County
- Maricopa County · 4,537,380 people
- City population
- 117,540
- Metro
- Phoenix-Mesa-Chandler, AZ
- Population (ZIP)
- 42,181
- Household income
- $114,056
- Rent vs Own
- Severe rent burden
- 156.0
Population outlook (Maricopa County) Hauer SSP2
- Today (2025)
- 4,979,203 people
- By 2030
- 5,378,229 · +8.0%
- By 2040
- 6,156,598 · +23.6%
- By 2050
- 6,872,376 · +38.0%
- By 2075
- 8,401,270 · +68.7%
- By 2100
- 9,247,439 · +85.7%
Race, ethnicity, and origin ACS 2023
- Neighborhood character
- Diverse neighborhood (Simpson 0.56)
- Race & ethnicity
- White 59% Hispanic / Latino 31% Two or more races 18% Black 4% Asian 2% Native American 1%
- Hispanic origin (detail)
- Mexican 25%
- Common ancestry
- Slovak 4% Portuguese 2% Italian 2%
- Foreign-born
- 8% · Canada, Vietnam
- Languages at home
- 85% English-only · Spanish 12% German/W. Germanic 1% Other Indo-European 1%
Political lean MEDSL · Maricopa
- 2024 margin
- Toss-up / Even · D 47.7% · R 51.2% · Other 1.1%
- 2008→2024 swing
- +7.1pp toward D · 2008: -10.6pp · 2024: -3.5pp
- All cycles
- 2024: R+3.5 2020: D+2.2 2016: R+3.5 2012: R+12.0 2008: R+10.6
Not yet ingested
- Civics
- —
Market trends
- HPI YoY
- ▼ -56.97%
- Current HPI
- 246.4705
- Rent YoY
- ▲ 3.41%
- Metro
- Phoenix-Mesa-Chandler, AZ
- State GDP YoY
- ▲ 4.54%
- F500 in state
- 20
Industry mix (Fortune 500 HQ in AZ)
| Industry | F500 HQs | Revenue |
|---|---|---|
| Technology | 2 | $13B |
|
||
| Mining / Metals | 1 | $23B |
|
||
| Environmental Services | 1 | $16B |
|
||
| Metals / Steel | 1 | $14B |
|
||
| Technology Distribution | 1 | $9B |
|
||
| Homebuilding | 1 | $8B |
|
||
Price history
-6.5% since first listed4 events — show timeline
- 2026-05-01 Pending — ARMLS
- 2026-04-07 Price Changed $360,000 ARMLS
- 2026-02-27 Price Changed $375,000 ARMLS
- 2026-01-07 Listed $385,000 ARMLS
Property tax history
+44.4%/yrLatest (2025): $2,084 · -2.8% YoY. Source: county tax records.
Cash-flow waterfall
monthlySold comps — $/sqft
last 12 mo · ≤1 miLoading sold comps…