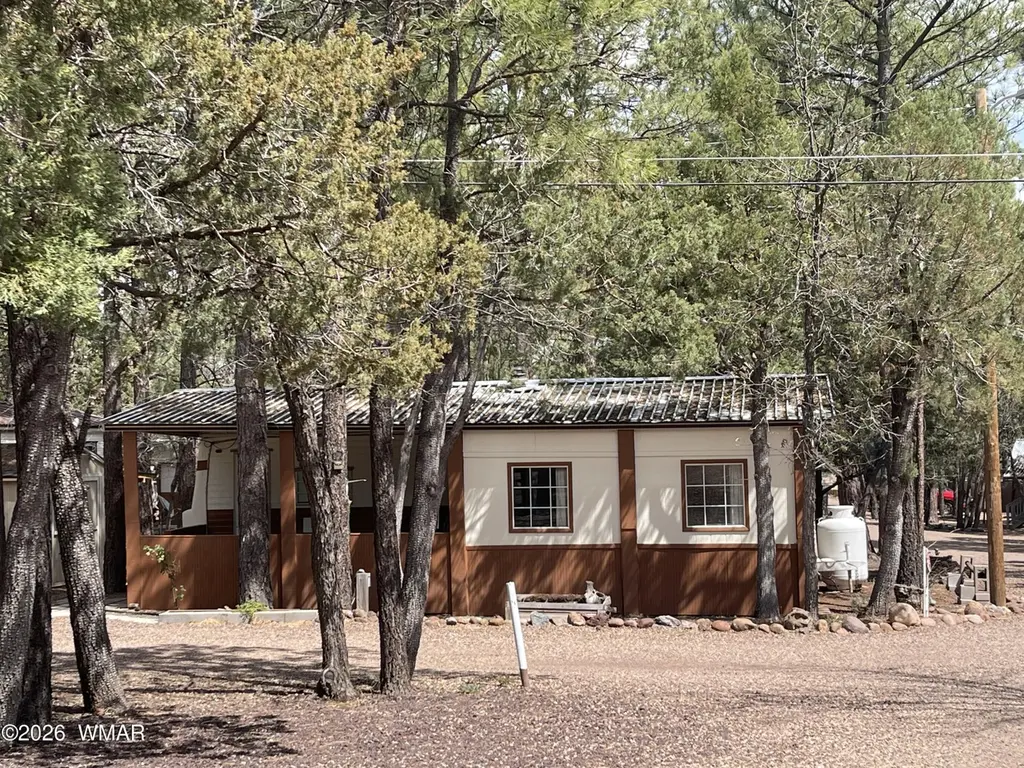
1930 Larson Rd #34 · Lake of the Woods, AZ
Flood risk 1/10 · Minimal
- FEMA flood zone
- X (unshaded)
- Chance of flooding over 30 yrs
- 0.0%
- Est. flood insurance / yr
- $507 – $1,088
Fire risk 7/10 · Major
- Est. fire insurance / yr
- $610 – $1,132
Heat risk 2/10 · Minimal
- Hot days now (above 88°F)
- 7 days/yr
- Hot days in 30 yrs
- 18 days/yr
Wind risk 1/10 · Minimal
- Chance of severe wind over 30 yrs
- —
Air-quality risk 2/10 · Minimal
- Unhealthy air days now
- 1 days/yr
- Unhealthy air days in 30 yrs
- 1 days/yr
Risk factors via First Street. Map © Google.
Why this score? — see what drove the D grade
The composite is a weighted blend of 9 inputs, each scored 0–100. Each bar is that input's sub-score; the figure is the points it added to the 100-point composite (weight × sub-score).
- Cash flow +15.0/30.0
- ARV discount +7.5/15.0
- 1% rule +5.0/10.0
- DSCR +5.0/10.0
- Livability +2.9/5.0
- Rent growth +2.5/5.0
- Condition / age +2.5/5.0
- Schools +2.2/10.0
- Appreciation +0.0/10.0
$15,000
🖨 Deal sheet 📄 Offer letter ✓ Due diligence
Listing remarks MLS
Escape the Heat in Your Own Cozy Get-Away in Peaceful Singing, Pines, a Tall Pine Covered 55+ RV Park Close to Rainbow Lake. This Cozy Home is protected by a Full Metal Snow Roof and has both a Gas Wall Heat and a Wood Stove....For the Occasional Warm Summer Day, there is an Evaporate Cooler Too !Two Sleeping Areas, Kitchen, Living/Dining area and Bathroom make this Furnished Home your Retreat from.......
Key facts
- Covered patio
- Built 1974
- Listed 204 days
Tags
Neighborhood map
What this means for you Summary
Snapshot
- This is a 1-bed/1.0-bath manufactured listed at $15k.
Deal economics
- At list price, monthly cash flow is $839 ($10k/yr) — positive.
- The deal already cash-flows at list — no discount required.
- Meets the 1% rule at list price ($1k rent vs $15k).
- Recommended offer: $13k (12.0% below list) — sets the bar for market timing.
- Cap rate 73.4% vs local median 2.4% in Lake of the Woods — top-decile yield for the area; either an underpriced asset or a hidden risk that comps aren't pricing in. Stress-test before assuming the spread holds.
Location & tenants
- Location reads 58/100 on livability (#206 in AZ) — a working-class tenant base; expect higher turnover. Strengths: cost of living A+, housing A+, crime A-; Watch: schools F, amenities F, commute F.
- Blue Ridge Unified School District No. 32 (4397) (town): math 21% / reading 29% proficiency, ranked #139 of 249 in AZ (top 56%) — low school quality limits family demand, transient renter base, plan for 1-2y turnover.
- Market conditions: 257 active listings in the ZIP; 485 units permitted in Navajo County in 2024 (11 in 5+ unit buildings).
Forward outlook
- Local home prices are declining (-3.0%/yr); year-one equity from $104 of loan paydown is wiped out by about $450 of value loss. Plan a longer hold.
- Navajo County population projected at -16% by 2050 — secular population decline; favor cash flow + early exit over multi-decade hold.
- At projected returns (-3.0% appreciation + 3.0% rent growth), your $4k cash investment doubles in ~1 year — after that, you're playing with house money.
Negotiation context
- It's been on market 205 days — a 12% lower offer ($13k) is reasonable based on typical stale-listing flexibility.
Risks & watch-outs
- Climate carrying-cost: major wildfire risk — expect insurance premiums to compound above CPI over the hold.
Questions for the listing agent
- It's been on market 205 days. Have you received any prior offers? Is the seller open to a 12% concession, seller financing, or rate buy-down credit?
- Built in 1974 — when were the roof, HVAC, electrical panel, plumbing, and water heater last replaced?
- Why hasn't it sold? Are there any deal-killer items the seller is aware of (foundation, flood, title, zoning, code violations)?
- Is there a deadline driving the sale (1031 exchange, divorce, estate, relocation)? That informs how much negotiation room exists.
- Schools are F-rated, which usually means shorter tenancies and higher turnover. Who's the typical renter profile here, and what's been the actual vacancy rate?
- The area grade is low — what's the realistic commute time and amenity access for the typical tenant pool here? Any planned neighborhood developments (good or bad) we should know about?
- What's the average days-on-market for RENTAL listings here right now (not sales)? A rising rental-DOM trend means longer vacancies and softer asking-rent achievability than the comps imply.
- What's the recent tenant-quality profile in this submarket — average credit score on applications, eviction rate, late-payment / NSF rate, and stable-employment percentage? A property-management company in the area should have these aggregated.
- How much new for-sale + rental construction is in the pipeline within 1–3 miles? Heavy new supply typically softens prices + rents 12–24 months out; constrained supply supports both.
Investment metrics
- 1% rule
- 7.95% ✓
- Cap rate
- 73.38%
- Cash-on-cash
- 239.61%
- DSCR
- 11.66
- GRM
- 1.0
CMA / ARV
- ARV (median comp)
- $110,000
- List price
- $15,000
- Delta
- -86.36%
- Verdict
- UNDERPRICED
- Comps
- 2 within 2.0 mi
Show comp detail 3 sales within ~0.75 mi
| Address | Dist | Beds/Ba | Sqft | Sold | Price | $/sf | Match |
|---|---|---|---|---|---|---|---|
| 1930 Larson #1 Rd #1 | 0.00mi | 1/1.0 | 400 (-2%) | 20mo | $18,000 | $45 | 80 |
| 3489 Rainbow Lake Dr #89 | 0.20mi | 1/1.0 | 456 (+12%) | 23mo | $48,000 | $105 | 52 |
| 3629 W White Mountain Blvd | 0.57mi | 1/1.0 | 450 (+10%) | 21mo | $17,000 | $38 | 39 |
Match score weights: distance 35% · size 25% · config 20% · recency 20%. Top-matched comps best support the ARV.
Projected returns pro-forma
-3.0% appreciation · 3.0% rent growth · sell at horizon
- IRR
- —
- Equity multiple
- 13.14×
- Total profit
- $51,001
- Equity at exit
- $2,237
- IRR
- —
- Equity multiple
- 27.97×
- Total profit
- $113,262
- Equity at exit
- $1,297
Cash invested: $4,200 (down + closing). Projections, not guarantees.
Landlord ↔ Tenant lean methodology
- Overall (STATE)
- 87 Strongly Landlord-Friendly
- State Arizona
- 87 Strongly Landlord-Friendly · R+3
- County
- — inherits STATE
- City
- — inherits STATE
ZIP-level market 85929
- Home prices YoY
- -16.9%
- Active inventory
- 257
- Price-to-rent
- 1.0×
Monthly cashflow live
- Estimated rent
- $1,193 medium interval (Pro) →
- Mortgage (P&I)
- −$79
- Tax est. 1.5%
- −$19 /mo · $225/yr
- Insurance
- −$6
- HOA
- −$0
- Vacancy / Maint / Mgmt
- −$250
- Net cashflow
- $839
Break-even live
UW: 25.0% down · 7.5% · 30yr · 1.5% tax · 5.0% vac · 8.0% maint · 8.0% mgmt
Financing live
Cash to close
- Down payment
- $3,750
- Closing costs
- $450
- Reserves months
- —
- Total cash needed
- —
Loan-product check · same deal, 3 products live
Conventional
25% down · 7.5% · 30yr
- Down + closing
- —
- Monthly P&I
- —
- Monthly cashflow
- —
- DSCR
- —
- Eligible?
- —
Personal DTI + credit; lowest rate.
DSCR
20% down · 8.5% · 30yr
- Down + closing
- —
- Monthly P&I
- —
- Monthly cashflow
- —
- DSCR
- —
- Eligible?
- —
No personal income docs; deal must DSCR.
Hard money
10% down · 12.0% · 12mo
- Down + closing
- —
- Monthly P&I
- —
- Monthly cashflow
- —
- DSCR
- —
- Eligible?
- —
Short-term bridge; refi at stabilization.
Listing history 19 events
-
2026-06-19days on market $15,000 Active 205 DOM
-
2026-06-18days on market $15,000 Active 204 DOM
-
2026-06-17days on market $15,000 Active 203 DOM
-
2026-06-16days on market $15,000 Active 202 DOM
-
2026-06-15days on market $15,000 Active 201 DOM
-
2026-06-14days on market $15,000 Active 199 DOM
-
2026-06-13price $15,000 Active 198 DOM
-
2026-06-12days on market $17,500 Active 198 DOM
-
2026-06-09days on market $17,500 Active 195 DOM
-
2026-06-08days on market $17,500 Active 194 DOM
-
2026-06-07days on market $17,500 Active 193 DOM
-
2026-06-04days on market $17,500 Active 189 DOM
-
2026-06-02days on market $17,500 Active 188 DOM
-
2026-06-01days on market $17,500 Active 187 DOM
-
2026-05-31days on market $17,500 Active 186 DOM
-
2026-05-31days on market $17,500 Active 185 DOM
-
2026-04-11price $17,500 408-char remark
Show marketing remark (408 chars)
Escape the Heat in Your Own Cozy Get-Away in Peaceful Singing, Pines, a Tall Pine Covered 55+ RV Park Close to Rainbow Lake. This Cozy Home is protected by a Full Metal Snow Roof and has both a Gas Wall Heat and a Wood Stove....For the Occasional Warm Summer Day, there is an Evaporate Cooler Too !Two Sleeping Areas, Kitchen, Living/Dining area and Bathroom make this Furnished Home your Retreat from.......
-
2025-12-15price $24,500 408-char remark
Show marketing remark (408 chars)
Escape the Heat in Your Own Cozy Get-Away in Peaceful Singing, Pines, a Tall Pine Covered 55+ RV Park Close to Rainbow Lake. This Cozy Home is protected by a Full Metal Snow Roof and has both a Gas Wall Heat and a Wood Stove....For the Occasional Warm Summer Day, there is an Evaporate Cooler Too !Two Sleeping Areas, Kitchen, Living/Dining area and Bathroom make this Furnished Home your Retreat from.......
-
2025-11-26$27,500 Active 408-char remark
Show marketing remark (408 chars)
Escape the Heat in Your Own Cozy Get-Away in Peaceful Singing, Pines, a Tall Pine Covered 55+ RV Park Close to Rainbow Lake. This Cozy Home is protected by a Full Metal Snow Roof and has both a Gas Wall Heat and a Wood Stove....For the Occasional Warm Summer Day, there is an Evaporate Cooler Too !Two Sleeping Areas, Kitchen, Living/Dining area and Bathroom make this Furnished Home your Retreat from.......
ⓘ Source: listings_history table (triggers on properties + properties_extension) + one-shot
backfill from property_details.listing_events for pre-trigger history.
Climate risk First Street
- Flood 1/10 Low FEMA zone X (unshaded) · 0% chance over 30 yrs
- Wildfire 7/10 Severe
- Heat 2/10 Low 7 d/yr ≥88°F today · 18 d/yr by 30 yrs out
- Wind 1/10 Low
- Air quality 2/10 Low 1 unhealthy d/yr today · 1 by 30 yrs out
Nearby sold comps map
Loading sold comps map…
Walkable amenities ~0.75 mi
Loading nearby amenities…
Taxation est. · year 1
- Rental income
- $14,313
- − Mortgage interest
- −$840
- − Property taxes
- −$225
- − Insurance
- −$75
- − Repairs & maintenance
- −$1,145
- − Management
- −$1,145
- − Depreciation
- −$436
- Taxable income
- $10,447
- Est. tax owed @ 24.0%
- −$2,507
- After-tax cash flow
- $7,556/yr
For passive investors: Depreciation is non-cash, so a rental often shows a tax loss while cash-flowing — sheltering income. Rental losses are passive: they offset passive income freely, and up to $25,000/yr can offset ordinary (W-2) income if you actively participate and your MAGI is under $100k (phasing out to $0 by $150k); unused losses carry forward. On sale, claimed depreciation is recaptured at up to 25%, and gains may owe capital-gains tax (a 1031 exchange can defer both). Figures are a year-1 estimate at your 24.0% rate — not tax advice; consult a CPA.
Schools (NCES district)
- District
- Blue Ridge Unified School District No. 32 (4397)
- NCES district ID
- 0406580
- Math proficiency
- 21% ▼ -11.00%
- Reading proficiency
- 29% ▼ -13.00%
- Median HH income
- $49,406
- Composite
- 21.97/100
- National rank
- #8213
- State rank
- #139 of 249 in AZ
Livability — Lake of the Woods
- Score
- 58/100
- State rank
- #206
- US rank
- #20890
Category grades
Schools grade is shown separately in the Schools card above.
Census & demographics
- Census place
- Lake of the Woods, AZ
- Population (ZIP)
- 7,280
Population outlook (Navajo County) Hauer SSP2
- Today (2025)
- 105,760 people
- By 2030
- 103,301 · -2.3%
- By 2040
- 97,070 · -8.2%
- By 2050
- 88,850 · -16.0%
- By 2075
- 65,180 · -38.4%
- By 2100
- 37,281 · -64.7%
Race, ethnicity, and origin ACS 2023
- Neighborhood character
- Predominantly White (75%)
- Race & ethnicity
- White 75% Hispanic / Latino 13% Two or more races 11% Native American 6% Asian 1%
- Hispanic origin (detail)
- Mexican 12%
- Common ancestry
- Slovak 2% Lithuanian 2% Portuguese 2%
- Foreign-born
- 5% · Canada, China
- Languages at home
- 87% English-only · Spanish 8% Chinese 1%
Political lean MEDSL · Navajo
- 2024 margin
- R (+17.2) · D 40.9% · R 58.1%
- 2008→2024 swing
- -5.5pp toward R · 2008: -11.7pp · 2024: -17.2pp
- All cycles
- 2024: R+17.2 2020: R+8.2 2016: R+7.9 2012: R+8.4 2008: R+11.7
Not yet ingested
- Civics
- —
Market trends
- HPI YoY
- ▼ -78.03%
- Current HPI
- 383.9587
- Rent YoY
- —
- Metro
- —
- State GDP YoY
- ▲ 4.54%
- F500 in state
- 20
Industry mix (Fortune 500 HQ in AZ)
| Industry | F500 HQs | Revenue |
|---|---|---|
| Technology | 2 | $13B |
|
||
| Mining / Metals | 1 | $23B |
|
||
| Environmental Services | 1 | $16B |
|
||
| Metals / Steel | 1 | $14B |
|
||
| Technology Distribution | 1 | $9B |
|
||
| Homebuilding | 1 | $8B |
|
||
Price history
-36.4% since first listed3 events — show timeline
- 2026-04-11 Price Changed $17,500 WMMLS
- 2025-12-15 Price Changed $24,500 WMMLS
- 2025-11-26 Listed $27,500 WMMLS
Cash-flow waterfall
monthlySold comps — $/sqft
last 12 mo · ≤1 miLoading sold comps…