206 E 1st St · Burnettsville, IN
Flood risk 1/10 · Minimal
- FEMA flood zone
- X (unshaded)
- Chance of flooding over 30 yrs
- 0.0%
- Est. flood insurance / yr
- $507 – $1,088
Fire risk 1/10 · Minimal
- Est. fire insurance / yr
- $717 – $1,331
Heat risk 3/10 · Minor
- Hot days now (above 101°F)
- 7 days/yr
- Hot days in 30 yrs
- 17 days/yr
Wind risk 2/10 · Minimal
- Chance of severe wind over 30 yrs
- —
Air-quality risk 2/10 · Minimal
- Unhealthy air days now
- 1 days/yr
- Unhealthy air days in 30 yrs
- 2 days/yr
Risk factors via First Street. Map © Google.
Why this score? — see what drove the D- grade
The composite is a weighted blend of 9 inputs, each scored 0–100. Each bar is that input's sub-score; the figure is the points it added to the 100-point composite (weight × sub-score).
- ARV discount +7.5/15.0
- Appreciation +7.5/10.0
- Cash flow +7.4/30.0
- Schools +3.6/10.0
- Livability +3.1/5.0
- Rent growth +2.5/5.0
- Condition / age +2.5/5.0
- 1% rule +2.1/10.0
- DSCR +1.6/10.0
$135,000
🖨 Deal sheet (PDF) 📄 Offer letter ✓ Due diligence
Listing remarks
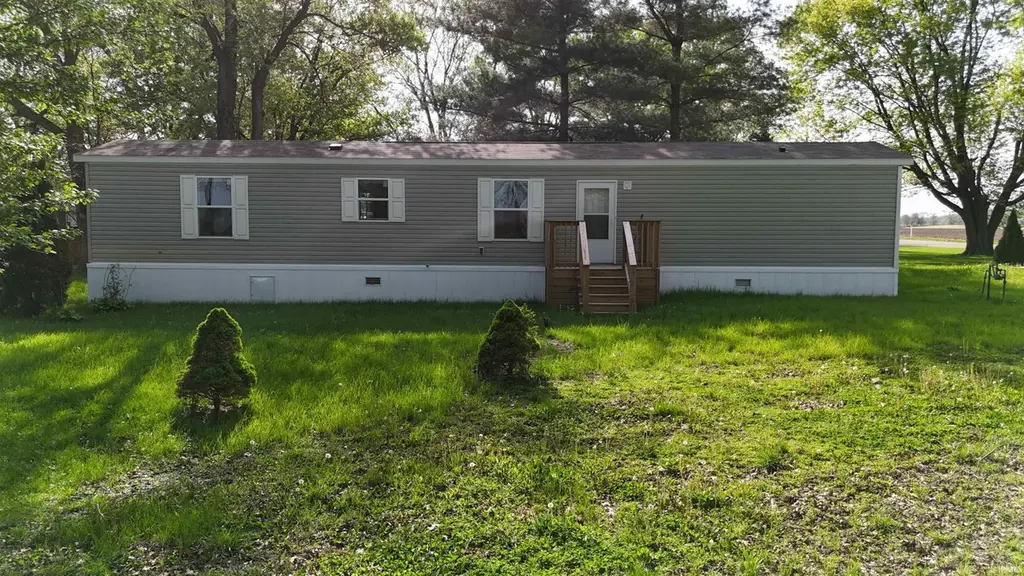
Welcome to this well-maintained 3-year-old home nestled on a spacious lot with mature trees offering shade and privacy. This property features a comfortable layout with plenty of natural light throughout. Low maintenance living with updated interior and exterior. All new appliances in the kitchen provide an excellent start for a new homeowner. Master suite has an attached bathroom with a walk-in closet. Don't miss out on this opportunity.
Key facts
- 0.51 acre lot
- Built 2023
- Listed 58 days
Property features AI
Exterior
- Security: Smoke detector(s)
- Utilities: Private water; Private sewer
- Home design: Manufactured home; Single-story
- Construction: Vinyl siding
- Exterior features: Deck; Level lot
Interior
- Kitchen: Dishwasher; Refrigerator; Gas range
- Bedrooms: Master downstairs
- Bathrooms: 2 full bathrooms
- Heating & cooling: Central air; Ceiling fans
- Interior features: Walk-in closet(s); Ceiling fan(s); Master bedroom on main level; One fireplace
- Laundry & utility: Washer hookup on main level; Gas dryer hookup on main level
Neighborhood map
What this means for you Summary
Snapshot
- This is a 3-bed/1.0-bath single-family listed at $135k.
Deal economics
- At list price, monthly cash flow is $-173 ($-2k/yr) — negative.
- To cash-flow at today's rent, offer at most $110k (18.5% below list).
- To meet the 1% rule (rent ≥ 1% of price), the offer needs to be $96k (28.7% below list).
- Recommended offer: $96k (28.7% below list) — sets the bar for 1% rule.
Location & tenants
- Location reads 61/100 on livability (#498 in IN) — a middle-class / working-renter tenant base. Strengths: cost of living A+, housing A+; Watch: crime D+, employment D, amenities F.
- Twin Lakes School Corporation (town): math 39% / reading 46% proficiency, ranked #116 of 301 in IN (top 38%) — families likely to look elsewhere, expect single-tenant / working-renter base with shorter leases.
- Zoned schools: Meadowlawn Elementary School (math 36% / reading 37%, grade F, #571 of 994 statewide, top 58%, 567 students, 56% FRL); Roosevelt Middle School (math 38% / reading 47%, grade D-, #98 of 330 statewide, top 30%, 523 students, 67% FRL); Twin Lakes Senior High School (math 37% / reading 62%, grade D, #123 of 369 statewide, top 36%, 674 students, 59% FRL) — zoned schools average 60% FRL vs 41% district-wide (20 pts higher); higher-poverty schools than district average — tighter screening recommended.
- Market conditions: 6 active listings in the ZIP; 47 units permitted in White County in 2024 (0 in 5+ unit buildings).
Forward outlook
- In year one you build about $8k of equity ($933 loan paydown + $7k appreciation (5.1% local appreciation)).
- White County population projected at -19% by 2050 — secular population decline; favor cash flow + early exit over multi-decade hold.
- By year 5, paydown + projected appreciation supports a ~$34k cash-out refi (75% LTV) — recoverable capital for the next deal without selling this one.
Negotiation context
- It's been on market 59 days — a 3% lower offer ($131k) is reasonable based on typical stale-listing flexibility.
- 3 sale attempts with the ask held roughly flat each time — persistent listings suggest the price (not the market) is what's stuck; bring a comps-based counter.
- Current owner paid $24k; list at $135k implies a 474% gain — meaningful room to come down on a strong offer.
Questions for the listing agent
- What do current leases actually rent for vs. the listed asking? Can we see a recent rent roll and the last 12 months of T-12 income?
- It's been on market 59 days. Have you received any prior offers? Is the seller open to a 29% concession, seller financing, or rate buy-down credit?
- Is there a deadline driving the sale (1031 exchange, divorce, estate, relocation)? That informs how much negotiation room exists.
- Crime grade is D in this area — have there been break-ins, vandalism, or insurance claims at this property in the last 3 years? What carrier currently insures it and at what premium?
- The area grade is low — what's the realistic commute time and amenity access for the typical tenant pool here? Any planned neighborhood developments (good or bad) we should know about?
- What's the average days-on-market for RENTAL listings here right now (not sales)? A rising rental-DOM trend means longer vacancies and softer asking-rent achievability than the comps imply.
- What's the recent tenant-quality profile in this submarket — average credit score on applications, eviction rate, late-payment / NSF rate, and stable-employment percentage? A property-management company in the area should have these aggregated.
- How much new for-sale + rental construction is in the pipeline within 1–3 miles? Heavy new supply typically softens prices + rents 12–24 months out; constrained supply supports both.
Investment metrics
- 1% rule
- 0.71% ✗
- Cap rate
- 4.75%
- Cash-on-cash
- -5.49%
- DSCR
- 0.76
- GRM
- 11.7
CMA / ARV
No comps found within radius.
Projected returns pro-forma
5.08% appreciation · 3.0% rent growth · sell at horizon
- IRR
- 8.5%
- Equity multiple
- 1.55×
- Total profit
- $20,730
- Equity at exit
- $77,163
- IRR
- 10.2%
- Equity multiple
- 2.90×
- Total profit
- $71,961
- Equity at exit
- $133,723
Cash invested: $37,800 (down + closing). Projections, not guarantees.
Landlord ↔ Tenant lean methodology
- Overall (STATE)
- 90 Strongly Landlord-Friendly
- State Indiana
- 90 Strongly Landlord-Friendly · R+11
- County
- — inherits STATE
- City
- — inherits STATE
ZIP-level market 47926
- Home prices YoY
- 2.4%
- Active inventory
- 6
- Price-to-rent
- 11.7×
Monthly cashflow live
- Estimated rent
- $962 medium interval (Pro) →
- Mortgage (P&I)
- −$708
- Tax est. 1.5%
- −$169 /mo · $2,025/yr
- Insurance
- −$56
- HOA
- −$0
- Vacancy / Maint / Mgmt
- −$202
- Net cashflow
- $-173
Break-even live
Sensitivity live
| Price | -10% $-80 | -5% $-126 | +0% $-173 | +5% $-220 | +10% $-266 |
|---|---|---|---|---|---|
| Rent | -10% $-249 | -5% $-211 | +0% $-173 | +5% $-135 | +10% $-97 |
| Rate | -1.0pp $-105 | -0.5pp $-139 | base $-173 | +0.5pp $-208 | +1.0pp $-244 |
UW: 25.0% down · 7.5% · 30yr · 1.5% tax · 5.0% vac · 8.0% maint · 8.0% mgmt
Financing live
Cash to close
- Down payment
- $33,750
- Closing costs
- $4,050
- Reserves months
- —
- Total cash needed
- —
Loan-product check · same deal, 3 products live
Conventional
25% down · 7.5% · 30yr
- Down + closing
- —
- Monthly P&I
- —
- Monthly cashflow
- —
- DSCR
- —
- Eligible?
- —
Personal DTI + credit; lowest rate.
DSCR
20% down · 8.5% · 30yr
- Down + closing
- —
- Monthly P&I
- —
- Monthly cashflow
- —
- DSCR
- —
- Eligible?
- —
No personal income docs; deal must DSCR.
Hard money
10% down · 12.0% · 12mo
- Down + closing
- —
- Monthly P&I
- —
- Monthly cashflow
- —
- DSCR
- —
- Eligible?
- —
Short-term bridge; refi at stabilization.
Listing history 23 events
-
2026-06-22days on market $135,000 Active 59 DOM
-
2026-06-21days on market $135,000 Active 58 DOM
-
2026-06-21days on market $135,000 Active 57 DOM
-
2026-06-18days on market $135,000 Active 55 DOM
-
2026-06-17days on market $135,000 Active 54 DOM
-
2026-06-16days on market $135,000 Active 53 DOM
-
2026-06-15days on market $135,000 Active 52 DOM
-
2026-06-13days on market $135,000 Active 50 DOM
-
2026-06-12days on market $135,000 Active 49 DOM
-
2026-06-09days on market $135,000 Active 46 DOM
-
2026-06-08days on market $135,000 Active 45 DOM
-
2026-06-07days on market $135,000 Active 44 DOM
-
2026-06-07days on market $135,000 Active 43 DOM
-
2026-06-04days on market $135,000 Active 40 DOM
-
2026-06-02days on market $135,000 Active 39 DOM
-
2026-06-01days on market $135,000 Active 38 DOM
-
2026-05-31days on market $135,000 Active 37 DOM
-
2026-05-31days on market $135,000 Active 36 DOM
-
2026-04-24$135,000 Active 442-char remark
-
2026-01-28status Active
-
2025-12-07status Pending
-
2025-09-10$135,000 Active
-
2010-03-23soldstatus $23,500
ⓘ Source: listings_history table (triggers on properties + properties_extension) + one-shot
backfill from property_details.listing_events for pre-trigger history.
Climate risk First Street
- Flood 1/10 Low FEMA zone X (unshaded) · 0% chance over 30 yrs
- Wildfire 1/10 Low
- Heat 3/10 Moderate 7 d/yr ≥101°F today · 17 d/yr by 30 yrs out
- Wind 2/10 Low
- Air quality 2/10 Low 1 unhealthy d/yr today · 2 by 30 yrs out
Nearby sold comps map
Loading sold comps map…
Walkable amenities ~0.75 mi
Loading nearby amenities…
Taxation est. · year 1
- Rental income
- $11,543
- − Mortgage interest
- −$7,562
- − Property taxes
- −$2,025
- − Insurance
- −$675
- − Repairs & maintenance
- −$923
- − Management
- −$923
- − Depreciation
- −$3,927
- Taxable loss
- −$4,493
- Est. tax savings @ 24.0%
- +$1,078
- After-tax cash flow
- $-998/yr
For passive investors: Depreciation is non-cash, so a rental often shows a tax loss while cash-flowing — sheltering income. Rental losses are passive: they offset passive income freely, and up to $25,000/yr can offset ordinary (W-2) income if you actively participate and your MAGI is under $100k (phasing out to $0 by $150k); unused losses carry forward. On sale, claimed depreciation is recaptured at up to 25%, and gains may owe capital-gains tax (a 1031 exchange can defer both). Figures are a year-1 estimate at your 24.0% rate — not tax advice; consult a CPA.
Schools (NCES district)
- District
- Twin Lakes School Corporation
- NCES district ID
- 1811580
- Math proficiency
- 39% ▼ -10.00%
- Reading proficiency
- 46% ▼ -5.00%
- Median HH income
- $48,963
- Composite
- 36.44/100
- National rank
- #4666
- State rank
- #116 of 301 in IN
Livability — Burnettsville
- Score
- 61/100
- State rank
- #498
- US rank
- #17722
Category grades
Schools grade is shown separately in the Schools card above.
Census & demographics
- Census place
- Burnettsville, IN
- Population (ZIP)
- 916
Population outlook (White County) Hauer SSP2
- Today (2025)
- 23,006 people
- By 2030
- 22,204 · -3.5%
- By 2040
- 20,441 · -11.1%
- By 2050
- 18,711 · -18.7%
- By 2075
- 14,989 · -34.8%
- By 2100
- 10,896 · -52.6%
Race, ethnicity, and origin ACS 2023
- Neighborhood character
- Predominantly White (96%)
- Race & ethnicity
- White 96% Hispanic / Latino 3% Two or more races 2%
- Common ancestry
- Italian 3% Romanian 2% Slovak 2%
Political lean MEDSL · White
- 2024 margin
- Solid R (+45.0) · D 26.4% · R 71.4% · Other 2.2%
- 2008→2024 swing
- -36.7pp toward R · 2008: -8.3pp · 2024: -45.0pp
- All cycles
- 2024: R+45.0 2020: R+44.1 2016: R+42.9 2012: R+23.6 2008: R+8.3
Not yet ingested
- Civics
- —
Market trends
- HPI YoY
- ▲ 5.08%
- Current HPI
- 219.708
- Rent YoY
- —
- Metro
- —
- State GDP YoY
- ▲ 2.90%
- F500 in state
- 18
Industry mix (Fortune 500 HQ in IN)
| Industry | F500 HQs | Revenue |
|---|---|---|
| Industrial Machinery | 2 | $37B |
|
||
| Healthcare | 1 | $177B |
|
||
| Pharmaceuticals | 1 | $45B |
|
||
| Metals / Steel | 1 | $18B |
|
||
| Agriculture | 1 | $17B |
|
||
| Packaging | 1 | $12B |
|
||
Price history
+474.5% since first listed5 events — show timeline
- 2026-04-24 Listed $135,000 IRMLS
- 2026-01-28 Relisted — IRMLS
- 2025-12-07 Pending — IRMLS
- 2025-09-10 Listed $135,000 IRMLS
- 2010-03-23 Sold (Public Records) $23,500 Public Records
Property tax history
+0.4%/yrLatest (2024): $154 · +7.7% YoY. Source: county tax records.
Cash-flow waterfall
monthlySold comps — $/sqft
last 12 mo · ≤1 miLoading sold comps…