 Multi-family
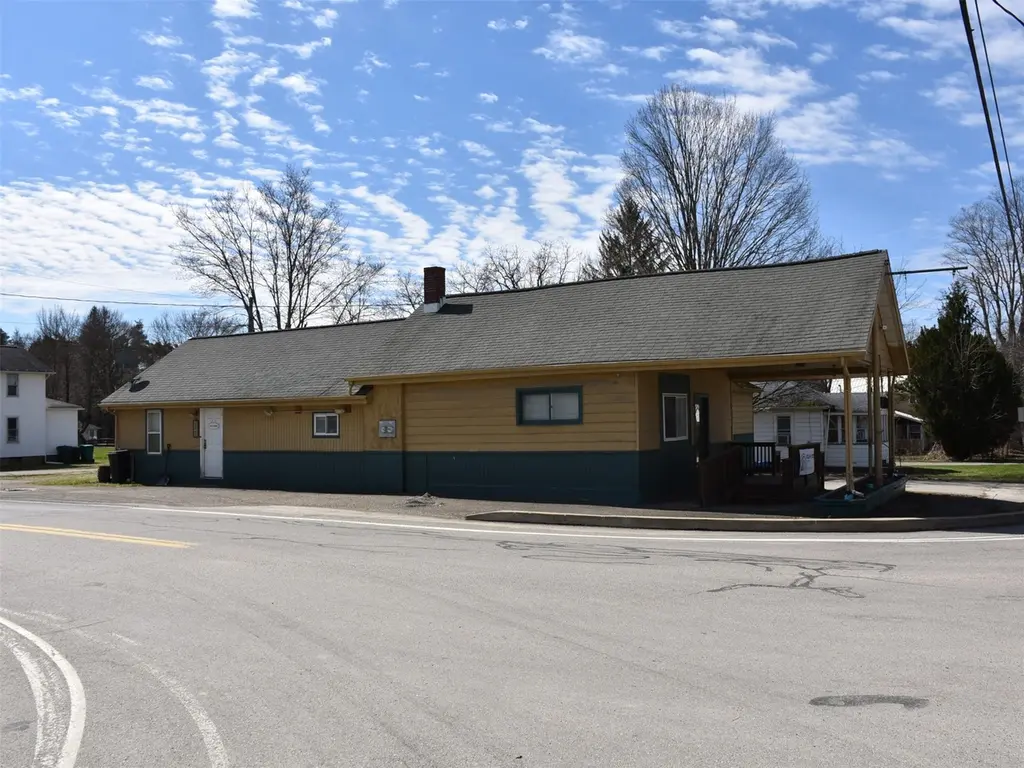
25141 State St · Blooming Valley, PA
Flood risk No data
- FEMA flood zone
- —
- Chance of flooding over 30 yrs
- —
- Est. flood insurance / yr
- —
Fire risk No data
- Est. fire insurance / yr
- —
Heat risk No data
- Hot days now (above threshold)
- —
- Hot days in 30 yrs
- —
Wind risk No data
- Chance of severe wind over 30 yrs
- —
Air-quality risk No data
- Unhealthy air days now
- —
- Unhealthy air days in 30 yrs
- —
Risk factors via First Street. Map © Google.
Why this score? — see what drove the B grade
The composite is a weighted blend of 9 inputs, each scored 0–100. Each bar is that input's sub-score; the figure is the points it added to the 100-point composite (weight × sub-score).
- Cash flow +30.0/30.0
- 1% rule +10.0/10.0
- DSCR +10.0/10.0
- ARV discount +7.5/15.0
- Condition / age +3.8/5.0
- Livability +3.6/5.0
- Schools +3.5/10.0
- Rent growth +2.5/5.0
- Appreciation +0.0/10.0
$88,900
🖨 Deal sheet (PDF) 📄 Offer letter ✓ Due diligence
Multi-family units
County records classify this as Multi-Family (2-4 Unit). Listing-text estimate: 1 unit. estimate disagrees with records
Listing remarks
This property is a great investment opportunity with significant potential for growth. If you're seeking a promising addition to your portfolio, this could be an excellent fit. Located just outside of Meadville. There is one gas meter, and the landlord currently pays the gas bill. The property has one forced air natural gas furnace and one gas hot water heater. The two-unit building is solid with room for rental growth. Schedule a showing to understand the possibilities this property can offer.
Key facts
- 6,970 sq ft lot
- Listed 15 days
Neighborhood map
What this means for you Summary
Snapshot
- This is a 3-bed/3.0-bath multifamily listed at $89k. Condition is rated good.
Deal economics
- At list price, monthly cash flow is $742 ($9k/yr) — positive.
- The deal already cash-flows at list — no discount required.
- Meets the 1% rule at list price ($2k rent vs $89k).
- Recommended offer: $88k (1.5% below list) — sets the bar for market timing.
Location & tenants
- Location reads 71/100 on livability (#670 in PA) — a middle-class / working-renter tenant base. Strengths: employment A+, cost of living A+, housing A+; Watch: commute D, amenities F, health & safety D-.
- Penncrest SD (rural): math 31% / reading 50% proficiency, ranked #348 of 539 in PA (top 65%) — families likely to look elsewhere, expect single-tenant / working-renter base with shorter leases.
- Zoned schools: Saegertown El Sch (math 35% / reading 59%, grade D-, #737 of 1,518 statewide, top 52%, 449 students, 48% FRL); Saegertown Jshs (math 47% / reading 52%, grade D, #138 of 437 statewide, top 34%, 445 students, 39% FRL).
- Market conditions: 134 active listings in the ZIP; 83 units permitted in Crawford County in 2024 (0 in 5+ unit buildings).
- This rent runs 36% of the median local income ($58k/yr) — at the standard rent-burdened threshold; future hikes will face affordability resistance.
Forward outlook
- Local home prices are declining (-3.0%/yr); year-one equity from $615 of loan paydown is wiped out by about $3k of value loss. Plan a longer hold.
- Crawford County population projected at -22% by 2050 — secular population decline; favor cash flow + early exit over multi-decade hold.
- At projected returns (-3.0% appreciation + 3.0% rent growth), your $25k cash investment doubles in ~4 years — after that, you're playing with house money.
Negotiation context
- It's been on market 15 days — a 2% lower offer ($88k) is reasonable based on typical stale-listing flexibility.
Questions for the listing agent
- Is there a deadline driving the sale (1031 exchange, divorce, estate, relocation)? That informs how much negotiation room exists.
- Schools are F-rated, which usually means shorter tenancies and higher turnover. Who's the typical renter profile here, and what's been the actual vacancy rate?
- What's the average days-on-market for RENTAL listings here right now (not sales)? A rising rental-DOM trend means longer vacancies and softer asking-rent achievability than the comps imply.
- What's the recent tenant-quality profile in this submarket — average credit score on applications, eviction rate, late-payment / NSF rate, and stable-employment percentage? A property-management company in the area should have these aggregated.
- How much new apartment / multifamily construction is in the pipeline within 1–3 miles? Heavy new supply (>2% of stock underway) typically softens rents 12–24 months out; light construction supports rent growth.
Investment metrics
- 1% rule
- 1.93% ✓
- Cap rate
- 16.31%
- Cash-on-cash
- 35.77%
- DSCR
- 2.59
- GRM
- 4.3
CMA / ARV
No comps found within radius.
Projected returns pro-forma
-3.0% appreciation · 3.0% rent growth · sell at horizon
- IRR
- 31.5%
- Equity multiple
- 2.32×
- Total profit
- $32,883
- Equity at exit
- $13,255
- IRR
- 38.6%
- Equity multiple
- 4.60×
- Total profit
- $89,597
- Equity at exit
- $7,686
Cash invested: $24,892 (down + closing). Projections, not guarantees.
Landlord ↔ Tenant lean methodology
- Overall (STATE)
- 62 Landlord-Friendly
- State Pennsylvania
- 62 Landlord-Friendly · EVEN
- County
- — inherits STATE
- City
- — inherits STATE
ZIP-level market 16335
- Home prices YoY
- -9.0%
- Active inventory
- 134
- Price-to-rent
- 8.6×
Monthly cashflow live
- Estimated rent
- $1,717 medium interval (Pro) →
- Mortgage (P&I)
- −$466
- Tax est. 1.5%
- −$111 /mo · $1,334/yr
- Insurance
- −$37
- HOA
- −$0
- Vacancy / Maint / Mgmt
- −$361
- Net cashflow
- $742
Break-even live
Sensitivity live
| Price | -10% $803 | -5% $773 | +0% $742 | +5% $711 | +10% $681 |
|---|---|---|---|---|---|
| Rent | -10% $606 | -5% $674 | +0% $742 | +5% $810 | +10% $878 |
| Rate | -1.0pp $787 | -0.5pp $765 | base $742 | +0.5pp $719 | +1.0pp $696 |
2-unit breakdown (identical units grouped — click to expand)
| Units | Beds | Baths | Est. rent |
|---|---|---|---|
| 2× units | 2 | 1.5 | $1,718 |
| #1 | 2 | 1.5 | $859 |
| #2 | 2 | 1.5 | $859 |
| Total (2 units) | $1,717 | ||
UW: 25.0% down · 7.5% · 30yr · 1.5% tax · 5.0% vac · 8.0% maint · 8.0% mgmt
Financing live
Cash to close
- Down payment
- $22,225
- Closing costs
- $2,667
- Reserves months
- —
- Total cash needed
- —
Loan-product check · same deal, 3 products live
Conventional
25% down · 7.5% · 30yr
- Down + closing
- —
- Monthly P&I
- —
- Monthly cashflow
- —
- DSCR
- —
- Eligible?
- —
Personal DTI + credit; lowest rate.
DSCR
20% down · 8.5% · 30yr
- Down + closing
- —
- Monthly P&I
- —
- Monthly cashflow
- —
- DSCR
- —
- Eligible?
- —
No personal income docs; deal must DSCR.
Hard money
10% down · 12.0% · 12mo
- Down + closing
- —
- Monthly P&I
- —
- Monthly cashflow
- —
- DSCR
- —
- Eligible?
- —
Short-term bridge; refi at stabilization.
Listing history 7 events
-
2026-06-18status $88,900 Pending 15 DOM
-
2026-06-18days on market $88,900 Active 15 DOM
-
2026-06-17days on market $88,900 Active 14 DOM
-
2026-06-16days on market $88,900 Active 13 DOM
-
2026-06-16status $88,900 Active 12 DOM
-
2026-04-06status Pending
-
2026-03-25$88,900 Active
ⓘ Source: listings_history table (triggers on properties + properties_extension) + one-shot
backfill from property_details.listing_events for pre-trigger history.
Nearby sold comps map
Loading sold comps map…
Walkable amenities ~0.75 mi
Loading nearby amenities…
Taxation est. · year 1
- Rental income
- $20,604
- − Mortgage interest
- −$4,980
- − Property taxes
- −$1,334
- − Insurance
- −$444
- − Repairs & maintenance
- −$1,648
- − Management
- −$1,648
- − Depreciation
- −$2,586
- Taxable income
- $7,963
- Est. tax owed @ 24.0%
- −$1,911
- After-tax cash flow
- $6,994/yr
For passive investors: Depreciation is non-cash, so a rental often shows a tax loss while cash-flowing — sheltering income. Rental losses are passive: they offset passive income freely, and up to $25,000/yr can offset ordinary (W-2) income if you actively participate and your MAGI is under $100k (phasing out to $0 by $150k); unused losses carry forward. On sale, claimed depreciation is recaptured at up to 25%, and gains may owe capital-gains tax (a 1031 exchange can defer both). Figures are a year-1 estimate at your 24.0% rate — not tax advice; consult a CPA.
Condition & rehab AI · 14 photos
This multi-family property is in good condition with minimal repairs needed. Painting the exterior and replacing damaged windows and flooring can significantly increase its value.
Value-add opportunities
- Both Paint the exterior siding and trim — Painting the exterior siding and trim can improve the curb appeal and increase the property's value.
- Both Replace any damaged windows — Replacing damaged windows can improve the property's energy efficiency and increase its value.
- Both Replace any worn-out flooring — Replacing worn-out flooring can improve the property's appearance and increase its value.
- Both Inspect and replace any damaged interior walls and paint — Inspecting and replacing any damaged interior walls and paint can improve the property's appearance and increase its value.
Renovation cost estimate screening
Value-add ROI direction
- Both Paint the exterior siding and trim — Painting the exterior siding and trim can improve the curb appeal and increase the property's value. ↑
- Both Replace any damaged windows — Replacing damaged windows can improve the property's energy efficiency and increase its value. ↑
- Both Replace any worn-out flooring — Replacing worn-out flooring can improve the property's appearance and increase its value. ↑
- Both Inspect and replace any damaged interior walls and paint — Inspecting and replacing any damaged interior walls and paint can improve the property's appearance and increase its value. ↑
ⓘ Cost ranges are severity-bucket heuristics (US national rule-of-thumb). Get contractor quotes + a written scope before underwriting a rehab budget.
Schools (NCES district)
- District
- Penncrest SD
- NCES district ID
- 4218740
- Math proficiency
- 31% ▼ -10.00%
- Reading proficiency
- 50% ▼ -8.00%
- Median HH income
- $47,927
- Composite
- 34.64/100
- National rank
- #5146
- State rank
- #348 of 539 in PA
Livability — Blooming Valley
- Score
- 71/100
- State rank
- #670
- US rank
- #6531
Category grades
Schools grade is shown separately in the Schools card above.
Census & demographics
- Census place
- Blooming Valley, PA
- County
- Crawford County · 27,175 people
- Metro
- Meadville, PA
- Population (ZIP)
- 27,175
- Household income
- $57,591
- Rent vs Own
- Severe rent burden
- 953.0
Population outlook (Crawford County) Hauer SSP2
- Today (2025)
- 81,399 people
- By 2030
- 77,977 · -4.2%
- By 2040
- 70,659 · -13.2%
- By 2050
- 63,841 · -21.6%
- By 2075
- 50,198 · -38.3%
- By 2100
- 37,898 · -53.4%
Race, ethnicity, and origin ACS 2023
- Neighborhood character
- Predominantly White (91%)
- Race & ethnicity
- White 91% Two or more races 4% Black 3% Hispanic / Latino 1%
- Common ancestry
- Romanian 3% Lithuanian 2% Serbian 2%
- Foreign-born
- 2% · Canada, China
- Languages at home
- 97% English-only · Spanish 1%
Political lean MEDSL · Crawford
- 2024 margin
- Solid R (+39.2) · D 30.0% · R 69.2%
- 2008→2024 swing
- -28.8pp toward R · 2008: -10.4pp · 2024: -39.2pp
- All cycles
- 2024: R+39.2 2020: R+37.2 2016: R+38.5 2012: R+19.6 2008: R+10.4
Not yet ingested
- Civics
- —
Market trends
- HPI YoY
- ▼ -26.80%
- Current HPI
- 272.4095
- Rent YoY
- —
- Metro
- Meadville, PA
- State GDP YoY
- ▲ 1.68%
- F500 in state
- 34
Industry mix (Fortune 500 HQ in PA)
| Industry | F500 HQs | Revenue |
|---|---|---|
| Healthcare | 2 | $309B |
|
||
| Insurance | 2 | $27B |
|
||
| Telecommunications / Media | 1 | $124B |
|
||
| Industrial Distribution | 1 | $22B |
|
||
| Financial Services | 1 | $20B |
|
||
| Chemicals / Materials | 1 | $18B |
|
||
Price history
2 events — show timeline
- 2026-04-06 Pending — GEBOR
- 2026-03-25 Listed $88,900 GEBOR
Cash-flow waterfall
monthlySold comps — $/sqft
last 12 mo · ≤1 miLoading sold comps…