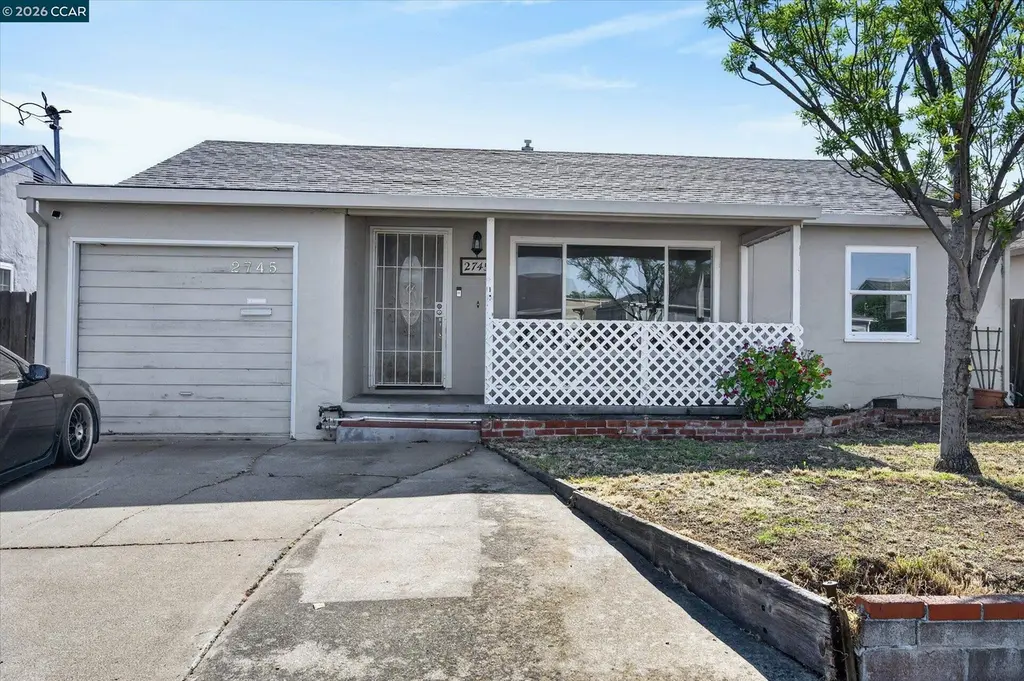
2745 El Rey St · Antioch, CA
Flood risk 1/10 · Minimal
- FEMA flood zone
- X (unshaded)
- Chance of flooding over 30 yrs
- 0.0%
- Est. flood insurance / yr
- $507 – $1,088
Fire risk 2/10 · Minimal
- Est. fire insurance / yr
- $659 – $1,223
Heat risk 6/10 · Moderate
- Hot days now (above 100°F)
- 7 days/yr
- Hot days in 30 yrs
- 14 days/yr
Wind risk 1/10 · Minimal
- Chance of severe wind over 30 yrs
- —
Air-quality risk 9/10 · Severe
- Unhealthy air days now
- 16 days/yr
- Unhealthy air days in 30 yrs
- 19 days/yr
Risk factors via First Street. Map © Google.
Why this score? — see what drove the D grade
The composite is a weighted blend of 9 inputs, each scored 0–100. Each bar is that input's sub-score; the figure is the points it added to the 100-point composite (weight × sub-score).
- ARV discount +15.0/15.0
- Cash flow +9.9/30.0
- Schools +3.8/10.0
- DSCR +2.8/10.0
- Rent growth +2.8/5.0
- Livability +2.8/5.0
- Condition / age +2.5/5.0
- 1% rule +1.7/10.0
- Appreciation +0.0/10.0
$375,000
🖨 Deal sheet 📄 Offer letter ✓ Due diligence
Listing remarks
Charming single-story home in an established Antioch neighborhood, an ideal opportunity for first-time buyers or savvy investors! Offering 3 bedrooms, 1 bath, and 1,108 sq ft of comfortable living space on a 5,300 sq ft lot. Step inside to a bright, open living area featuring hard wood flooring and a large picture window that fills the space with natural light. The kitchen has beautiful, warm wood cabinetry, ample storage, tile flooring, a gas range, built-in microwave, and stainless steel dishwasher. All three bedrooms include ceiling fans and well-proportioned space, while the bath features a sleek glass-enclosed shower and modern vanity. Out back, enjoy California living on the spacious
Key facts
- Warm wood cabinetry
- Hard wood flooring
- Large picture window
Tags
Property features AI
Exterior
- Parking: Attached garage with 1 covered parking space (1 garage space)
- Utilities: Public water; Public sewer
- Home design: Single family residence; Residential property; Built in 1952
- Construction: Stucco exterior; Shingle roof; Built in 1952
- Exterior features: Front porch with awning; Covered patio; Front yard; Back yard; Side yard; Garden/play area; Storage area; Fenced yard
Interior
- Kitchen: Stone counters; Dishwasher; Gas range; Microwave; Updated kitchen features
- Bathrooms: 1 full bathroom
- Heating & cooling: Forced air heating; Ceiling fans for cooling
- Interior features: Updated kitchen; No additional rooms; Main entry at street level
- Laundry & utility: Laundry area in garage
Neighborhood map
What this means for you Summary
Snapshot
- This is a 3-bed/1.0-bath single-family listed at $375k.
Deal economics
- At list price, monthly cash flow is $-232 ($-3k/yr) — negative.
- To cash-flow at today's rent, offer at most $334k (10.9% below list).
- To meet the 1% rule (rent ≥ 1% of price), the offer needs to be $253k (32.6% below list).
- Recommended offer: $253k (32.6% below list) — sets the bar for 1% rule.
- Cap rate 5.6% vs local median 3.9% in Antioch — top-decile yield for the area; either an underpriced asset or a hidden risk that comps aren't pricing in. Stress-test before assuming the spread holds.
Location & tenants
- Location reads 56/100 on livability (#782 in CA) — a working-class tenant base; expect higher turnover. Strengths: employment A+, housing A+, health & safety A; Watch: schools F, crime F, amenities F.
- Antioch Unified (suburban): math 29% / reading 55% proficiency, ranked #200 of 517 in CA (top 39%) — families likely to look elsewhere, expect single-tenant / working-renter base with shorter leases.
- Market conditions: Rents rising (+1.1%/yr); 206 active listings in the ZIP; 40 comparable units currently listed for rent nearby; rentals lingering (median 44d on market — plan ~5-8 weeks vacancy on turnover, expect pricing pressure); 52% of comp listings sitting > 30 days — soft ceiling on asking rent; solid renter incomes; 2,169 units permitted in Contra Costa County in 2024 (896 in 5+ unit buildings).
- This rent runs 35% of the median local income ($86k/yr) — at the standard rent-burdened threshold; future hikes will face affordability resistance.
Forward outlook
- Local home prices are declining (-3.0%/yr); year-one equity from $3k of loan paydown is wiped out by about $11k of value loss. Plan a longer hold.
- Contra Costa County population projected at +26% by 2050 — long-run rental-demand tailwind backs the buy-and-hold thesis.
Negotiation context
- Only 8 days on market — expect competitive offers; lowballing is unlikely to land.
Risks & watch-outs
- Watch-outs: built in 1952 — expect roof / HVAC / electrical / plumbing capex.
- Climate carrying-cost: extreme-heat days projected 7→14/yr by 2055 (HVAC capex compounding) — expect insurance premiums to compound above CPI over the hold.
Questions for the listing agent
- What do current leases actually rent for vs. the listed asking? Can we see a recent rent roll and the last 12 months of T-12 income?
- Built in 1952 — when were the roof, HVAC, electrical panel, plumbing, and water heater last replaced?
- Is there a deadline driving the sale (1031 exchange, divorce, estate, relocation)? That informs how much negotiation room exists.
- Schools are F-rated, which usually means shorter tenancies and higher turnover. Who's the typical renter profile here, and what's been the actual vacancy rate?
- Crime grade is F in this area — have there been break-ins, vandalism, or insurance claims at this property in the last 3 years? What carrier currently insures it and at what premium?
- The area grade is low — what's the realistic commute time and amenity access for the typical tenant pool here? Any planned neighborhood developments (good or bad) we should know about?
- What's the average days-on-market for RENTAL listings here right now (not sales)? A rising rental-DOM trend means longer vacancies and softer asking-rent achievability than the comps imply.
- What's the recent tenant-quality profile in this submarket — average credit score on applications, eviction rate, late-payment / NSF rate, and stable-employment percentage? A property-management company in the area should have these aggregated.
- How much new for-sale + rental construction is in the pipeline within 1–3 miles? Heavy new supply typically softens prices + rents 12–24 months out; constrained supply supports both.
Investment metrics
- 1% rule
- 0.67% ✗
- Cap rate
- 5.55%
- Cash-on-cash
- -2.65%
- DSCR
- 0.88
- GRM
- 12.4
CMA / ARV
- ARV (median comp)
- $492,773
- List price
- $375,000
- Delta
- -23.90%
- Verdict
- UNDERPRICED
- Comps
- 20 within 1.0 mi
Show comp detail 12 sales within ~0.75 mi
| Address | Dist | Beds/Ba | Sqft | Sold | Price | $/sf | Match |
|---|---|---|---|---|---|---|---|
| 2744 El Rey St | 0.03mi | 3/1.0 | 1,108 (0%) | 2mo | $445,000 | $402 | 97 |
| 2721 Capistrano St | 0.11mi | 3/1.0 | 1,122 (+1%) | 3mo | $445,000 | $397 | 90 |
| 401 San Joaquin Ave | 0.14mi | 2/1.0 (-1) | 1,082 (-2%) | 4mo | $464,000 | $429 | 81 |
| 525 Faria St | 0.14mi | 3/2.0 | 1,200 (+8%) | 2mo | $540,000 | $450 | 73 |
| 2744 Capistrano St | 0.07mi | 3/1.0 | 1,246 (+12%) | 4mo | $458,000 | $368 | 73 |
| 2809 D St | 0.26mi | 2/2.0 (-1) | 1,154 (+4%) | 8mo | $460,000 | $399 | 65 |
| 24 Lawrence Ave | 0.40mi | 2/2.0 (-1) | 1,178 (+6%) | 2mo | $539,800 | $458 | 60 |
| 4 Wightman Ct | 0.42mi | 3/1.0 | 964 (-13%) | 3mo | $430,000 | $446 | 56 |
| 209 W 17th St | 0.70mi | 3/2.0 | 1,155 (+4%) | 4mo | $460,000 | $398 | 53 |
| 606 W 20th St | 0.54mi | 3/2.0 | 1,217 (+10%) | 3mo | $415,000 | $341 | 52 |
| 28 W Madill St | 0.52mi | 3/2.0 | 1,251 (+13%) | 1mo | $495,000 | $396 | 49 |
| 10 Belshaw St | 0.63mi | 4/3.0 (+1) | 1,224 (+10%) | 8mo | $565,000 | $462 | 34 |
Match score weights: distance 35% · size 25% · config 20% · recency 20%. Top-matched comps best support the ARV.
Projected returns pro-forma
-3.0% appreciation · 1.09% rent growth · sell at horizon
- IRR
- -22.6%
- Equity multiple
- 0.23×
- Total profit
- $-80,489
- Equity at exit
- $55,914
- IRR
- -21.7%
- Equity multiple
- -0.04×
- Total profit
- $-108,681
- Equity at exit
- $32,423
Cash invested: $105,000 (down + closing). Projections, not guarantees.
Landlord ↔ Tenant lean methodology
- Overall (STATE)
- 18 Strongly Tenant-Friendly
- State California
- 18 Strongly Tenant-Friendly · D+13
- County
- — inherits STATE
- City
- — inherits STATE
ZIP-level market 94509
- Rents YoY
- 1.1%
- Active inventory
- 206
- Price-to-rent
- 12.4×
Monthly cashflow live
- Estimated rent
- $2,527 high interval (Pro) →
- Mortgage (P&I)
- −$1,967
- Tax from tax record
- −$105 /mo · $1,264/yr
- Insurance
- −$156
- HOA
- −$0
- Vacancy / Maint / Mgmt
- −$531
- Net cashflow
- $-232
Break-even live
UW: 25.0% down · 7.5% · 30yr · 1.5% tax · 5.0% vac · 8.0% maint · 8.0% mgmt
Financing live
Cash to close
- Down payment
- $93,750
- Closing costs
- $11,250
- Reserves months
- —
- Total cash needed
- —
Loan-product check · same deal, 3 products live
Conventional
25% down · 7.5% · 30yr
- Down + closing
- —
- Monthly P&I
- —
- Monthly cashflow
- —
- DSCR
- —
- Eligible?
- —
Personal DTI + credit; lowest rate.
DSCR
20% down · 8.5% · 30yr
- Down + closing
- —
- Monthly P&I
- —
- Monthly cashflow
- —
- DSCR
- —
- Eligible?
- —
No personal income docs; deal must DSCR.
Hard money
10% down · 12.0% · 12mo
- Down + closing
- —
- Monthly P&I
- —
- Monthly cashflow
- —
- DSCR
- —
- Eligible?
- —
Short-term bridge; refi at stabilization.
Rent comps 40 comps
| Address | Beds | Baths | Sqft | Rent | $/sqft | DOM | Units | Dist |
|---|---|---|---|---|---|---|---|---|
| 22 Wightman Ct Antioch, CA | 4.0 | 2.0 | 1400 | $2,900 | $2.07 | 5d | 1 | 0.37mi |
| 304 Robert St Antioch, CA | 4.0 | 2.0 | 1201 | $3,069 | $2.56 | 24d | 1 | 0.39mi |
| 1015 Fitzuren Rd Unit 18 Antioch, CA | 2.0 | 2.0 | 1034 | $2,800 | $2.71 | 43d | 1 | 0.41mi |
| 1015 Fitzuren Rd Unit 2 Antioch, CA | 2.0 | 2.0 | 1035 | $2,500 | $2.42 | 43d | 1 | 0.41mi |
| 24 Lawrence Ave Antioch, CA | 2.0 | 2.0 | 1178 | $2,200 | $1.87 | 43d | 1 | 0.41mi |
| 313 Lawton St Unit LAW-08 Antioch, CA | 2.0 | 1.0 | 768 | $1,895 | $2.47 | 43d | 1 | 0.41mi |
| 313 Lawton St Antioch, CA | 2.0 | 1.0 | 768 | $1,850 | $2.41 | 24d | 1 | 0.41mi |
| 400 Lawton St Antioch, CA | 2.0 | 1.0 | 850 | $1,850 | $2.18 | 18d | 1 | 0.45mi |
| 370 Lawton St Unit Lawton-370B Antioch, CA | 2.0 | 1.0 | 950 | $2,099 | $2.21 | 43d | 1 | 0.45mi |
| 3126 Lone Tree Way Antioch, CA | 2.0 | 1.0 | 837 | $1,595 | $1.91 | 15d | 1 | 0.50mi |
| 2205 Peppertree Way Antioch, CA | 2.0 | 1.0 | 903 | $1,695 | $1.88 | 15d | 1 | 0.61mi |
| 31 Sunset Dr Unit B Antioch, CA | 2.0 | 1.0 | 900 | $2,000 | $2.22 | 24d | 1 | 0.64mi |
| 2308 Lemontree Way #4 Antioch, CA | 2.0 | 1.0 | 925 | $1,695 | $1.83 | 43d | 1 | 0.66mi |
| 2106 Peppertree Way #3 Antioch, CA | 2.0 | 1.0 | 903 | $2,311 | $2.56 | 43d | 1 | 0.67mi |
| 2106 Peppertree Way Antioch, CA | 2.0 | 1.0 | 903 | $2,311 | $2.56 | 5d | 1 | 0.67mi |
| 2104 Lemontree Way Antioch, CA | 2.0 | 1.0 | 822 | $1,695 | $2.06 | 43d | 1 | 0.73mi |
| 2725 Entrada Cir Antioch, CA | 3.0 | 2.0 | 1302 | $2,000 | $1.54 | 18d | 1 | 0.74mi |
| 1312 Mission Dr Antioch, CA | 3.0 | 2.0 | 1440 | $2,975 | $2.07 | 4d | 1 | 0.77mi |
| 30 W 17th St Antioch, CA | 2.0 | 1.0 | 1321 | $2,750 | $2.08 | 43d | 1 | 0.77mi |
| 3513 Clayburn Rd Antioch, CA | 3.0 | 2.0 | 1224 | $3,500 | $2.86 | 43d | 1 | 0.79mi |
| 2202 Banyan Way Antioch, CA | 4.0 | 2.5 | 1487 | $3,500 | $2.35 | 43d | 1 | 0.85mi |
| 2221 Dogwood Way Antioch, CA | 3.0 | 2.0 | 1154 | $2,995 | $2.60 | 43d | 1 | 0.86mi |
| 2112 Banyan Way Antioch, CA | 3.0 | 2.0 | 1154 | $2,900 | $2.51 | 43d | 1 | 0.87mi |
| 108 El Capitan Ln Antioch, CA | 3.0 | 1.0 | 1100 | $2,695 | $2.45 | 43d | 1 | 0.88mi |
| 141 El Capitan Ln Antioch, CA | 3.0 | 2.5 | 1236 | $2,500 | $2.02 | 43d | 1 | 0.88mi |
| 1608 Sycamore Dr Apt 2 Antioch, CA | 2.0 | 1.0 | 900 | $2,150 | $2.39 | 5d | 1 | 0.91mi |
| 2415 Horizon Ln #129 Antioch, CA | 2.0 | 2.0 | 944 | $2,800 | $2.97 | 43d | 1 | 0.96mi |
| 1902 San Jose Dr Antioch, CA | 3.0 | 2.0 | 1152 | $3,100 | $2.69 | 43d | 1 | 0.97mi |
| 2004 Cavallo Rd Unit A Antioch, CA | 3.0 | 2.5 | 1500 | $3,450 | $2.30 | 3d | 1 | 1.00mi |
| 2400 Horizon Ln #140 Antioch, CA | 2.0 | 1.0 | 845 | $1,850 | $2.19 | 43d | 1 | 1.00mi |
| 1017 H St Antioch, CA | 2.0 | 1.0 | 825 | $1,950 | $2.36 | 24d | 1 | 1.01mi |
| 2005 San Jose Dr Antioch, CA | 2.0 | 2.0 | 830 | $1,850 | $2.23 | 44d | 1 | 1.03mi |
| 2201 Sycamore Dr Antioch, CA | 1.0–3.0 | 1.0–2.0 | 1015 | $2,400 | $2.36 | 1d | 10 | 1.04mi |
| 2608 Nevada Ln Antioch, CA | 3.0 | 1.5 | 1056 | $2,450 | $2.32 | 43d | 1 | 1.06mi |
| 2005 San Jose Dr Unit F130 Antioch, CA | 2.0 | 2.0 | 830 | $1,795 | $2.16 | 5d | 1 | 1.07mi |
| 2005 San Jose Dr #241 Antioch, CA | 2.0 | 1.5 | 782 | $1,900 | $2.43 | 5d | 1 | 1.07mi |
| 2500 Florida Ln Antioch, CA | 2.0 | 1.0 | 1000 | $2,395 | $2.40 | 43d | 1 | 1.09mi |
| 2200 Sycamore Dr Antioch, CA | 2.0 | 1.0–2.0 | 777 | $1,917 | $2.47 | 2d | 12 | 1.11mi |
| 2200 Sycamore Dr Antioch, CA | 2.0 | 1.0 | 755 | $1,815 | $2.40 | 10d | 1 | 1.11mi |
| 2301 Sycamore Dr Antioch, CA | 1.0–2.0 | 1.0–1.5 | 716 | $2,180 | $3.04 | 1d | 22 | 1.15mi |
Listing history 1 events
-
2026-05-14$375,000 Active 1080-char remark
ⓘ Source: listings_history table (triggers on properties + properties_extension) + one-shot
backfill from property_details.listing_events for pre-trigger history.
Tax reassessment forecast CA · Resets to sale price
- Current annual tax
- $1,264 · $105/mo
- Projected year-2 tax
- $2,850 · $238/mo
- Expected delta
- +$1,586/yr (+$132/mo · 125.5%)
ⓘ Screening estimate from a state-policy table — verify with the county assessor before closing.
Climate risk First Street
- Flood 1/10 Low FEMA zone X (unshaded) · 0% chance over 30 yrs
- Wildfire 2/10 Low
- Heat 6/10 Major 7 d/yr ≥100°F today · 14 d/yr by 30 yrs out
- Wind 1/10 Low
- Air quality 9/10 Extreme 16 unhealthy d/yr today · 19 by 30 yrs out
Nearby sold comps map
Loading sold comps map…
Walkable amenities ~0.75 mi
Loading nearby amenities…
Taxation est. · year 1
- Rental income
- $30,321
- − Mortgage interest
- −$21,006
- − Property taxes
- −$1,264
- − Insurance
- −$1,875
- − Repairs & maintenance
- −$2,426
- − Management
- −$2,426
- − Depreciation
- −$10,909
- Taxable loss
- −$9,584
- Est. tax savings @ 24.0%
- +$2,300
- After-tax cash flow
- $-483/yr
For passive investors: Depreciation is non-cash, so a rental often shows a tax loss while cash-flowing — sheltering income. Rental losses are passive: they offset passive income freely, and up to $25,000/yr can offset ordinary (W-2) income if you actively participate and your MAGI is under $100k (phasing out to $0 by $150k); unused losses carry forward. On sale, claimed depreciation is recaptured at up to 25%, and gains may owe capital-gains tax (a 1031 exchange can defer both). Figures are a year-1 estimate at your 24.0% rate — not tax advice; consult a CPA.
Schools (NCES district)
- District
- Antioch Unified
- NCES district ID
- 0602850
- Math proficiency
- 29% ▲ 12.00%
- Reading proficiency
- 55% ▲ 25.00%
- Median HH income
- $65,935
- Composite
- 37.57/100
- National rank
- #4386
- State rank
- #200 of 517 in CA
Livability — Antioch
- Score
- 56/100
- State rank
- #782
- US rank
- #22472
Category grades
Schools grade is shown separately in the Schools card above.
Census & demographics
- Census place
- Antioch, CA
- County
- Contra Costa County · 1,059,880 people
- City population
- 116,477
- Metro
- San Francisco-Oakland-Berkeley, CA
- Population (ZIP)
- 70,090
- Household income
- $86,196
- Rent vs Own
- Severe rent burden
- 3063.0
Population outlook (Contra Costa County) Hauer SSP2
- Today (2025)
- 1,287,720 people
- By 2030
- 1,364,937 · +6.0%
- By 2040
- 1,506,209 · +17.0%
- By 2050
- 1,624,373 · +26.1%
- By 2075
- 1,853,193 · +43.9%
- By 2100
- 1,901,231 · +47.6%
Race, ethnicity, and origin ACS 2023
- Neighborhood character
- Highly diverse neighborhood (Simpson 0.72)
- Race & ethnicity
- Hispanic / Latino 43% White 25% Two or more races 18% Black 16% Asian 9% Native American 2% Pacific Islander 2%
- Hispanic origin (detail)
- Mexican 30%
- Common ancestry
- Russian 2% Italian 2% Lithuanian 1%
- Foreign-born
- 23% · Canada, China, Vietnam
- Languages at home
- 62% English-only · Spanish 29% Tagalog/Filipino 3% Other Asian/Pacific 1%
Political lean MEDSL · Contra Costa
- 2024 margin
- Solid D (+38.0) · D 67.3% · R 29.4% · Other 3.3%
- 2008→2024 swing
- +0.2pp no change · 2008: 37.8pp · 2024: 38.0pp
- All cycles
- 2024: D+38.0 2020: D+45.3 2016: D+43.5 2012: D+33.7 2008: D+37.8
Not yet ingested
- Civics
- —
Market trends
- HPI YoY
- ▼ -477.30%
- Current HPI
- 309.3499
- Rent YoY
- ▲ 1.09%
- Metro
- San Francisco-Oakland-Berkeley, CA
- State GDP YoY
- ▲ 3.21%
- F500 in state
- 116
Industry mix (Fortune 500 HQ in CA)
| Industry | F500 HQs | Revenue |
|---|---|---|
| Technology | 27 | $1,492B |
|
||
| Financial Services | 3 | $174B |
|
||
| Retail | 3 | $44B |
|
||
| Insurance | 3 | $26B |
|
||
| Media / Entertainment | 2 | $115B |
|
||
| Pharmaceuticals / Biotech | 2 | $62B |
|
||
Price history
2 events — show timeline
- 2026-05-22 Pending — bridgeMLS, Bay East AOR, or Contra Costa AOR
- 2026-05-14 Listed $375,000 bridgeMLS, Bay East AOR, or Contra Costa AOR
Property tax history
+3.4%/yrLatest (2025): $1,264 · +4.5% YoY. Source: county tax records.
Cash-flow waterfall
monthlySold comps — $/sqft
last 12 mo · ≤1 miLoading sold comps…