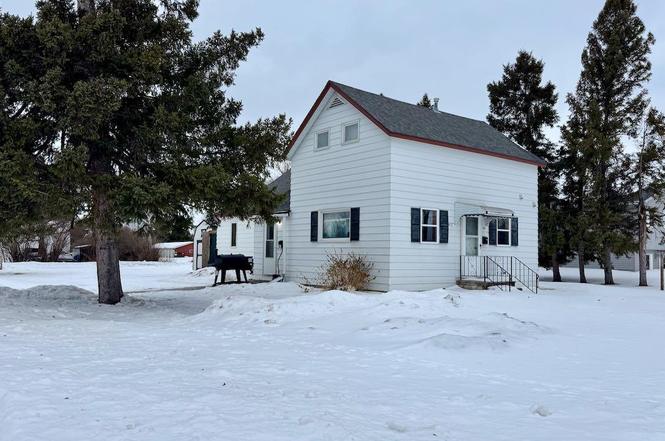
501 3rd St W · Ada, MN
Flood risk 1/10 · Minimal
- FEMA flood zone
- X (unshaded)
- Chance of flooding over 30 yrs
- 0.0%
- Est. flood insurance / yr
- $473 – $860
Fire risk 1/10 · Minimal
- Est. fire insurance / yr
- $888 – $1,650
Heat risk 2/10 · Minimal
- Hot days now (above 98°F)
- 7 days/yr
- Hot days in 30 yrs
- 12 days/yr
Wind risk 2/10 · Minimal
- Chance of severe wind over 30 yrs
- —
Air-quality risk 3/10 · Minor
- Unhealthy air days now
- 3 days/yr
- Unhealthy air days in 30 yrs
- 3 days/yr
Risk factors via First Street. Map © Google.
Why this score? — see what drove the D+ grade
The composite is a weighted blend of 9 inputs, each scored 0–100. Each bar is that input's sub-score; the figure is the points it added to the 100-point composite (weight × sub-score).
- Cash flow +11.6/30.0
- Appreciation +8.1/10.0
- ARV discount +7.5/15.0
- Schools +5.0/10.0
- Livability +3.9/5.0
- DSCR +3.4/10.0
- Rent growth +2.5/5.0
- Condition / age +2.5/5.0
- 1% rule +2.4/10.0
$140,000
🖨 Deal sheet 📄 Offer letter ✓ Due diligence
Listing remarks MLS
Nice 4 bedroom home in Ada! Great location only a few blocks from the school and downtown. Large corner lot, comes with old school building for nice storage building, which could be a great studio, or playhouse too. New shingles on the house. Lots of floor and paint updates. Features two bathrooms and main floor laundry and Central Air. Ready to move into!
Key facts
- New furnace
- New roof shingles
- Refreshed tub shower
Tags
Neighborhood map
What this means for you Summary
Snapshot
- This is a 4-bed/2.0-bath single-family listed at $140k.
Deal economics
- At list price, monthly cash flow is $-44 ($-529/yr) — negative.
- To cash-flow at today's rent, offer at most $132k (5.6% below list).
- To meet the 1% rule (rent ≥ 1% of price), the offer needs to be $104k (26.0% below list).
- Recommended offer: $104k (26.0% below list) — sets the bar for 1% rule.
Location & tenants
- Location reads 77/100 on livability (#137 in MN, #3,026 nationally) — a middle-class / working-renter tenant base. Strengths: crime A+, cost of living A+, housing A+; Watch: employment D, amenities F, commute F.
- Market conditions: 13 active listings in the ZIP; 8 units permitted in Norman County in 2024 (0 in 5+ unit buildings).
Forward outlook
- In year one you build about $10k of equity ($968 loan paydown + $9k appreciation (6.2% local appreciation)).
- At projected returns (6.2% appreciation + 3.0% rent growth), your $39k cash investment doubles in ~4 years — after that, you're playing with house money.
- By year 4, paydown + projected appreciation supports a ~$33k cash-out refi (75% LTV) — recoverable capital for the next deal without selling this one.
Negotiation context
- It's been on market 79 days — a 6% lower offer ($132k) is reasonable based on typical stale-listing flexibility.
- 3 sale attempts since 4y ago with the ask held roughly flat each time — persistent listings suggest the price (not the market) is what's stuck; bring a comps-based counter.
- Current owner paid $101k; 39% above their basis — modest negotiation headroom, anchor on the comps not their cost.
Risks & watch-outs
- Watch-outs: built in 1900 — expect roof / HVAC / electrical / plumbing capex.
Questions for the listing agent
- What do current leases actually rent for vs. the listed asking? Can we see a recent rent roll and the last 12 months of T-12 income?
- It's been on market 79 days. Have you received any prior offers? Is the seller open to a 26% concession, seller financing, or rate buy-down credit?
- Built in 1900 — when were the roof, HVAC, electrical panel, plumbing, and water heater last replaced?
- Why hasn't it sold? Are there any deal-killer items the seller is aware of (foundation, flood, title, zoning, code violations)?
- Is there a deadline driving the sale (1031 exchange, divorce, estate, relocation)? That informs how much negotiation room exists.
- Schools are B-rated — typically a magnet for longer-tenancy family renters. What's the average tenant stay here, and is there a school-zone premium baked into asking?
- The area grade is low — what's the realistic commute time and amenity access for the typical tenant pool here? Any planned neighborhood developments (good or bad) we should know about?
- What's the average days-on-market for RENTAL listings here right now (not sales)? A rising rental-DOM trend means longer vacancies and softer asking-rent achievability than the comps imply.
- What's the recent tenant-quality profile in this submarket — average credit score on applications, eviction rate, late-payment / NSF rate, and stable-employment percentage? A property-management company in the area should have these aggregated.
- How much new for-sale + rental construction is in the pipeline within 1–3 miles? Heavy new supply typically softens prices + rents 12–24 months out; constrained supply supports both.
Investment metrics
- 1% rule
- 0.74% ✗
- Cap rate
- 5.92%
- Cash-on-cash
- -1.35%
- DSCR
- 0.94
- GRM
- 11.3
CMA / ARV
No comps found within radius.
Projected returns pro-forma
6.22% appreciation · 3.0% rent growth · sell at horizon
- IRR
- 14.8%
- Equity multiple
- 2.00×
- Total profit
- $39,371
- Equity at exit
- $89,931
- IRR
- 14.9%
- Equity multiple
- 4.00×
- Total profit
- $117,449
- Equity at exit
- $164,769
Cash invested: $39,200 (down + closing). Projections, not guarantees.
Landlord ↔ Tenant lean methodology
- Overall (STATE)
- 46 Balanced
- State Minnesota
- 46 Balanced · D+2
- County
- — inherits STATE
- City
- — inherits STATE
ZIP-level market 56510
- Home prices YoY
- 3.7%
- Active inventory
- 13
- Price-to-rent
- 11.3×
Monthly cashflow live
- Estimated rent
- $1,035 medium interval (Pro) →
- Mortgage (P&I)
- −$734
- Tax from tax record
- −$70 /mo · $834/yr
- Insurance
- −$58
- HOA
- −$0
- Vacancy / Maint / Mgmt
- −$217
- Net cashflow
- $-44
Break-even live
UW: 25.0% down · 7.5% · 30yr · 1.5% tax · 5.0% vac · 8.0% maint · 8.0% mgmt
Financing live
Cash to close
- Down payment
- $35,000
- Closing costs
- $4,200
- Reserves months
- —
- Total cash needed
- —
Loan-product check · same deal, 3 products live
Conventional
25% down · 7.5% · 30yr
- Down + closing
- —
- Monthly P&I
- —
- Monthly cashflow
- —
- DSCR
- —
- Eligible?
- —
Personal DTI + credit; lowest rate.
DSCR
20% down · 8.5% · 30yr
- Down + closing
- —
- Monthly P&I
- —
- Monthly cashflow
- —
- DSCR
- —
- Eligible?
- —
No personal income docs; deal must DSCR.
Hard money
10% down · 12.0% · 12mo
- Down + closing
- —
- Monthly P&I
- —
- Monthly cashflow
- —
- DSCR
- —
- Eligible?
- —
Short-term bridge; refi at stabilization.
Listing history 9 events
-
2026-04-04status Pending
-
2026-03-24historical Contingent - Inspection
-
2026-01-15$140,000 Active
-
2023-10-12soldstatus $100,700 358-char remark
Show marketing remark (358 chars)
Nice 4 bedroom home in Ada! Great location only a few blocks from the school and downtown. Large corner lot, comes with old school building for nice storage building, which could be a great studio, or playhouse too. New shingles on the house. Lots of floor and paint updates. Features two bathrooms and main floor laundry and Central Air. Ready to move into!
-
2023-10-05soldstatus $100,700
-
2023-01-30$109,900 358-char remark
Show marketing remark (358 chars)
Nice 4 bedroom home in Ada! Great location only a few blocks from the school and downtown. Large corner lot, comes with old school building for nice storage building, which could be a great studio, or playhouse too. New shingles on the house. Lots of floor and paint updates. Features two bathrooms and main floor laundry and Central Air. Ready to move into!
-
2022-11-30historical
-
2022-07-25$114,900
-
2020-07-01soldstatus $57,000
ⓘ Source: listings_history table (triggers on properties + properties_extension) + one-shot
backfill from property_details.listing_events for pre-trigger history.
Tax reassessment forecast MN · Partial reset (capped growth)
- Current annual tax
- $834 · $70/mo
- Projected year-2 tax
- $1,201 · $100/mo
- Expected delta
- +$367/yr (+$31/mo · 44.0%)
ⓘ Screening estimate from a state-policy table — verify with the county assessor before closing.
Climate risk First Street
- Flood 1/10 Low FEMA zone X (unshaded) · 0% chance over 30 yrs
- Wildfire 1/10 Low
- Heat 2/10 Low 7 d/yr ≥98°F today · 12 d/yr by 30 yrs out
- Wind 2/10 Low
- Air quality 3/10 Moderate 3 unhealthy d/yr today · 3 by 30 yrs out
Nearby sold comps map
Loading sold comps map…
Walkable amenities ~0.75 mi
Loading nearby amenities…
Taxation est. · year 1
- Rental income
- $12,424
- − Mortgage interest
- −$7,842
- − Property taxes
- −$834
- − Insurance
- −$700
- − Repairs & maintenance
- −$994
- − Management
- −$994
- − Depreciation
- −$4,073
- Taxable loss
- −$3,012
- Est. tax savings @ 24.0%
- +$723
- After-tax cash flow
- $194/yr
For passive investors: Depreciation is non-cash, so a rental often shows a tax loss while cash-flowing — sheltering income. Rental losses are passive: they offset passive income freely, and up to $25,000/yr can offset ordinary (W-2) income if you actively participate and your MAGI is under $100k (phasing out to $0 by $150k); unused losses carry forward. On sale, claimed depreciation is recaptured at up to 25%, and gains may owe capital-gains tax (a 1031 exchange can defer both). Figures are a year-1 estimate at your 24.0% rate — not tax advice; consult a CPA.
Schools (NCES district)
No district data.
Livability — Ada
- Score
- 77/100
- State rank
- #137
- US rank
- #3026
Category grades
Schools grade is shown separately in the Schools card above.
Census & demographics
- Census place
- Ada, MN
- Population (ZIP)
- 2,300
Population outlook (Norman County) Hauer SSP2
- Today (2025)
- 6,540 people
- By 2030
- 6,489 · -0.8%
- By 2040
- 6,436 · -1.6%
- By 2050
- 6,348 · -2.9%
- By 2075
- 6,263 · -4.2%
- By 2100
- 5,731 · -12.4%
Race, ethnicity, and origin ACS 2023
- Neighborhood character
- Predominantly White (91%)
- Race & ethnicity
- White 91% Two or more races 5% Hispanic / Latino 4% Asian 1%
- Common ancestry
- Portuguese 39% Lithuanian 3% Scottish 2%
- Foreign-born
- 3% · Canada
- Languages at home
- 97% English-only · Spanish 3%
Political lean MEDSL · Norman
- 2024 margin
- Strong R (+22.2) · D 37.5% · R 59.8% · Other 2.7%
- 2008→2024 swing
- -49.2pp toward R · 2008: 26.9pp · 2024: -22.2pp
- All cycles
- 2024: R+22.2 2020: R+16.0 2016: R+13.5 2012: D+10.8 2008: D+26.9
Not yet ingested
- Civics
- —
Market trends
- HPI YoY
- ▲ 6.22%
- Current HPI
- 172.2595
- Rent YoY
- —
- Metro
- —
- State GDP YoY
- ▲ 2.41%
- F500 in state
- 34
Industry mix (Fortune 500 HQ in MN)
| Industry | F500 HQs | Revenue |
|---|---|---|
| Healthcare | 2 | $407B |
|
||
| Retail | 2 | $150B |
|
||
| Consumer Goods | 2 | $32B |
|
||
| Industrial Machinery | 2 | $6B |
|
||
| Agriculture | 1 | $40B |
|
||
| Healthcare / Medical Devices | 1 | $32B |
|
||
Price history
+145.6% since first listed9 events — show timeline
- 2026-04-04 Pending — NORTHSTARMLS as Distributed by MLS Grid
- 2026-03-24 Contingent — NORTHSTARMLS as Distributed by MLS Grid
- 2026-01-15 Listed $140,000 NORTHSTARMLS as Distributed by MLS Grid
- 2023-10-12 Sold (MLS) $100,700 NORTHSTARMLS as Distributed by MLS Grid
- 2023-10-05 Sold (Public Records) $100,700 Public Records
- 2023-01-30 Listed $109,900 NORTHSTARMLS as Distributed by MLS Grid
- 2022-11-30 Listing Removed — NORTHSTARMLS as Distributed by MLS Grid
- 2022-07-25 Listed $114,900 NORTHSTARMLS as Distributed by MLS Grid
- 2020-07-01 Sold (Public Records) $57,000 Public Records
Property tax history
+8.5%/yrLatest (2025): $834 · +4.5% YoY. Source: county tax records.
Cash-flow waterfall
monthlySold comps — $/sqft
last 12 mo · ≤1 miLoading sold comps…