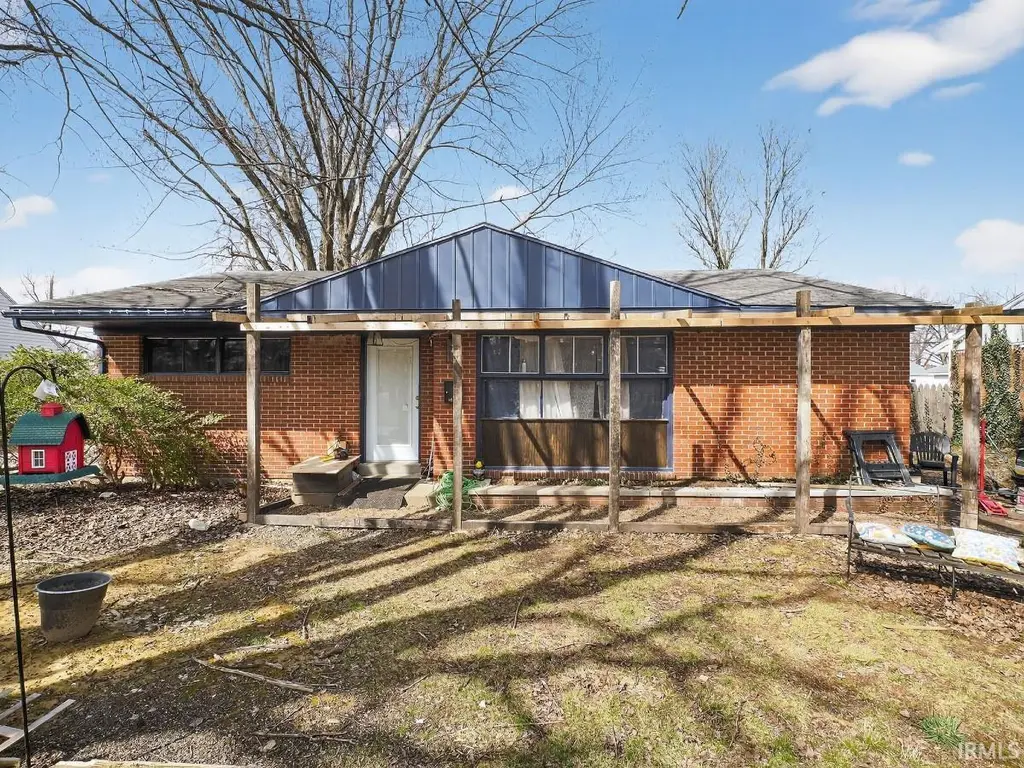
5012 Helmuth Ave · Evansville, IN
Flood risk 1/10 · Minimal
- FEMA flood zone
- X (shaded)
- Chance of flooding over 30 yrs
- 0.0%
- Est. flood insurance / yr
- $473 – $860
Fire risk 1/10 · Minimal
- Est. fire insurance / yr
- $717 – $1,331
Heat risk 5/10 · Moderate
- Hot days now (above 107°F)
- 7 days/yr
- Hot days in 30 yrs
- 19 days/yr
Wind risk 2/10 · Minimal
- Chance of severe wind over 30 yrs
- 3.0%
Air-quality risk 3/10 · Minor
- Unhealthy air days now
- 3 days/yr
- Unhealthy air days in 30 yrs
- 4 days/yr
Risk factors via First Street. Map © Google.
Why this score? — see what drove the B- grade
The composite is a weighted blend of 9 inputs, each scored 0–100. Each bar is that input's sub-score; the figure is the points it added to the 100-point composite (weight × sub-score).
- Cash flow +25.0/30.0
- ARV discount +15.0/15.0
- DSCR +8.2/10.0
- 1% rule +5.4/10.0
- Schools +3.3/10.0
- Livability +3.2/5.0
- Rent growth +2.5/5.0
- Condition / age +2.5/5.0
- Appreciation +0.0/10.0
$110,000
🖨 Deal sheet (PDF) 📄 Offer letter ✓ Due diligence
Listing remarks
Spacious brick ranch on Evansville’s east side offering strong upside with added finished basement square footage. Main level features a large living area, functional kitchen layout, and solid bones throughout, while the partially finished basement provides additional living space ideal for a second living area, bedrooms, or flex use. Home sits in an established neighborhood and offers a great opportunity for buyers looking to add value with cosmetic updates. Conveniently located near shopping, dining, and major roadways, this property is perfect for investors, renovators, or owner-occupants looking to build equity.
Key facts
- Finished basement
- Cosmetic updates
- Brick ranch
Tags
Property features AI
Finance
- Other: Residential property listed by Paradigm Realty Solutions
Exterior
- Parking: Detached garage (1 car)
- Utilities: Public water; Public sewer
- Home design: Single-family residence (site-built); One story
- Construction: Brick construction
- Exterior features: Lot dimensions approximately 60 x 105; Lot zoning R-1 One-Family Residence; Lot features: Other; Subdivision: Reynold Terrace; Directions available
Interior
- Bathrooms: 1 full bathroom; 1 half bathroom; 2 main-level bathrooms
- Heating & cooling: Central air conditioning; Natural gas heating
- Interior features: Finished basement; Total of 8 rooms
- Laundry & utility: Laundry in basement
Neighborhood map
What this means for you Summary
Snapshot
- This is a 2-bed/1.5-bath single-family listed at $110k.
Deal economics
- At list price, monthly cash flow is $241 ($3k/yr) — positive.
- The deal already cash-flows at list — no discount required.
- Meets the 1% rule at list price ($1k rent vs $110k).
- Cap rate 8.9% vs local median 4.6% in Evansville — top-decile yield for the area; either an underpriced asset or a hidden risk that comps aren't pricing in. Stress-test before assuming the spread holds.
Location & tenants
- Location reads 63/100 on livability (#416 in IN) — a middle-class / working-renter tenant base. Strengths: cost of living A+, housing A+, health & safety A+; Watch: crime F, commute F, employment D-.
- Evansville Vanderburgh School Corporation (urban): math 36% / reading 43% proficiency, ranked #153 of 301 in IN (top 51%) — families likely to look elsewhere, expect single-tenant / working-renter base with shorter leases.
- Zoned schools: Caze Elementary School (math 17% / reading 17%, grade F, #837 of 994 statewide, top 86%, 393 students, 79% FRL); Mcgary Middle School (math 8% / reading 15%, grade F, #311 of 330 statewide, top 94%, 351 students, 81% FRL); William Henry Harrison High School (math 29% / reading 54%, grade F, #211 of 369 statewide, top 58%, 1,158 students, 61% FRL) — zoned schools average 73% FRL vs 50% district-wide (23 pts higher); higher-poverty schools than district average — tighter screening recommended.
- Zoned-school proficiency averages 23% at this address vs 40% district-wide (-16 pts) — the specific schools serving this property underperform the Evansville Vanderburgh School Corporation average; the district grade overstates school quality for this exact location.
- Market conditions: 181 active listings in the ZIP; 15 comparable units currently listed for rent nearby; rentals at typical pace (median 23d on market — plan ~3-4 weeks tenant-placement turnaround); 508 units permitted in Vanderburgh County in 2024 (32 in 5+ unit buildings).
Forward outlook
- Local home prices are declining (-3.0%/yr); year-one equity from $761 of loan paydown is wiped out by about $3k of value loss. Plan a longer hold.
Negotiation context
- Only 2 days on market — expect competitive offers; lowballing is unlikely to land.
Risks & watch-outs
- Watch-outs: built in 1953 — expect roof / HVAC / electrical / plumbing capex.
- Climate carrying-cost: extreme-heat days projected 7→19/yr by 2055 (HVAC capex compounding) — expect insurance premiums to compound above CPI over the hold.
Questions for the listing agent
- Built in 1953 — when were the roof, HVAC, electrical panel, plumbing, and water heater last replaced?
- Is there a deadline driving the sale (1031 exchange, divorce, estate, relocation)? That informs how much negotiation room exists.
- Schools are D-rated, which usually means shorter tenancies and higher turnover. Who's the typical renter profile here, and what's been the actual vacancy rate?
- Crime grade is F in this area — have there been break-ins, vandalism, or insurance claims at this property in the last 3 years? What carrier currently insures it and at what premium?
- What's the average days-on-market for RENTAL listings here right now (not sales)? A rising rental-DOM trend means longer vacancies and softer asking-rent achievability than the comps imply.
- What's the recent tenant-quality profile in this submarket — average credit score on applications, eviction rate, late-payment / NSF rate, and stable-employment percentage? A property-management company in the area should have these aggregated.
- How much new for-sale + rental construction is in the pipeline within 1–3 miles? Heavy new supply typically softens prices + rents 12–24 months out; constrained supply supports both.
Investment metrics
- 1% rule
- 1.04% ✓
- Cap rate
- 8.92%
- Cash-on-cash
- 9.39%
- DSCR
- 1.42
- GRM
- 8.0
CMA / ARV
- ARV (on-the-fly)
- $208,693
- Comps found
- 12
Show comp detail 12 sales within ~0.75 mi
| Address | Dist | Beds/Ba | Sqft | Sold | Price | $/sf | Match |
|---|---|---|---|---|---|---|---|
| 2422 Filly Dr | 0.33mi | 3/2.0 (+1) | 1,176 (+2%) | 3mo | $239,000 | $203 | 72 |
| 4537 Greencove Ave | 0.40mi | 3/2.0 (+1) | 1,172 (+2%) | 2mo | $202,400 | $173 | 70 |
| 1907 S Green River Rd | 0.18mi | 3/1.0 (+1) | 1,266 (+10%) | 6mo | $139,900 | $111 | 63 |
| 2819 Promise St | 0.65mi | 3/1.0 (+1) | 1,176 (+2%) | 1mo | $174,750 | $149 | 59 |
| 5717 Lincoln Pointe Blvd | 0.45mi | 3/2.0 (+1) | 1,240 (+8%) | 1mo | $240,000 | $194 | 59 |
| 1909 Seasons Ridge Blvd | 0.66mi | 3/2.0 (+1) | 1,139 (-1%) | 8mo | $220,000 | $193 | 53 |
| 4550 Sweetser Ave | 0.34mi | 3/1.0 (+1) | 1,014 (-12%) | 6mo | $184,500 | $182 | 52 |
| 1733 Burdette Ave | 0.53mi | 3/1.0 (+1) | 1,056 (-8%) | 6mo | $180,000 | $170 | 49 |
| 1818 Seasons Ridge Dr | 0.71mi | 3/2.0 (+1) | 1,188 (+3%) | 10mo | $215,000 | $181 | 47 |
| 5928 Crossfield Dr | 0.58mi | 2/2.0 | 1,003 (-13%) | 8mo | $150,000 | $150 | 42 |
| 1913 Jeanette Ave | 0.74mi | 3/1.0 (+1) | 999 (-13%) | 3mo | $108,000 | $108 | 34 |
| 1726 Seasons Ridge Blvd | 0.73mi | 3/2.0 (+1) | 1,323 (+15%) | 7mo | $240,000 | $181 | 28 |
Match score weights: distance 35% · size 25% · config 20% · recency 20%. Top-matched comps best support the ARV.
Projected returns pro-forma
-3.0% appreciation · 3.0% rent growth · sell at horizon
- IRR
- -2.2%
- Equity multiple
- 0.92×
- Total profit
- $-2,519
- Equity at exit
- $16,401
- IRR
- 7.5%
- Equity multiple
- 1.56×
- Total profit
- $17,395
- Equity at exit
- $9,511
Cash invested: $30,800 (down + closing). Projections, not guarantees.
Landlord ↔ Tenant lean methodology
- Overall (STATE)
- 90 Strongly Landlord-Friendly
- State Indiana
- 90 Strongly Landlord-Friendly · R+11
- County
- — inherits STATE
- City
- — inherits STATE
ZIP-level market 47715
- Active inventory
- 181
- Price-to-rent
- 8.0×
Monthly cashflow live
- Estimated rent
- $1,143 high interval (Pro) →
- Mortgage (P&I)
- −$577
- Tax from tax record
- −$39 /mo · $470/yr
- Insurance
- −$46
- HOA
- −$0
- Vacancy / Maint / Mgmt
- −$240
- Net cashflow
- $241
Break-even live
Sensitivity live
| Price | -10% $303 | -5% $272 | +0% $241 | +5% $210 | +10% $179 |
|---|---|---|---|---|---|
| Rent | -10% $151 | -5% $196 | +0% $241 | +5% $286 | +10% $331 |
| Rate | -1.0pp $296 | -0.5pp $269 | base $241 | +0.5pp $212 | +1.0pp $183 |
UW: 25.0% down · 7.5% · 30yr · 1.5% tax · 5.0% vac · 8.0% maint · 8.0% mgmt
Financing live
Cash to close
- Down payment
- $27,500
- Closing costs
- $3,300
- Reserves months
- —
- Total cash needed
- —
Loan-product check · same deal, 3 products live
Conventional
25% down · 7.5% · 30yr
- Down + closing
- —
- Monthly P&I
- —
- Monthly cashflow
- —
- DSCR
- —
- Eligible?
- —
Personal DTI + credit; lowest rate.
DSCR
20% down · 8.5% · 30yr
- Down + closing
- —
- Monthly P&I
- —
- Monthly cashflow
- —
- DSCR
- —
- Eligible?
- —
No personal income docs; deal must DSCR.
Hard money
10% down · 12.0% · 12mo
- Down + closing
- —
- Monthly P&I
- —
- Monthly cashflow
- —
- DSCR
- —
- Eligible?
- —
Short-term bridge; refi at stabilization.
Rent comps 15 comps
| Address | Beds | Baths | Sqft | Rent | $/sqft | DOM | Units | Dist |
|---|---|---|---|---|---|---|---|---|
| 1900 Pueblo Pass Evansville, IN | 2.0–3.0 | 1.5 | 1081 | $899 | $0.83 | 15d | 5 | 0.26mi |
| 4689 Covert Ave Unit 4629 Evansville, IN | 2.0 | 1.0 | 725 | $775 | $1.07 | 15d | 1 | 0.45mi |
| 1621 Burdette Ave Evansville, IN | 2.0 | 1.0 | 720 | $1,050 | $1.46 | 22d | 1 | 0.60mi |
| 5301 Stonehedge Dr Evansville, IN | 1.0–2.0 | 1.0–2.0 | 914 | $1,170 | $1.28 | 15d | 19 | 0.63mi |
| 1100 Erie Ave Evansville, IN | 1.0–3.0 | 1.0–2.0 | 962 | $1,188 | $1.23 | 22d | 2 | 0.85mi |
| 1165 Shiloh Sq Evansville, IN | 1.0–2.0 | 1.0–2.0 | 907 | $1,145 | $1.26 | 15d | 15 | 0.86mi |
| 1411 Jeanette Ave Unit 1411 Evansville, IN | 3.0 | 1.5 | 1210 | $1,195 | $0.99 | 22d | 1 | 0.92mi |
| 3700 Justus Ct Evansville, IN | 1.0–2.0 | 1.0–2.0 | 790 | $975 | $1.23 | 22d | 1 | 0.99mi |
| 1320 Lee Ct Evansville, IN | 1.0–4.0 | 1.0–1.5 | 1007 | $1,032 | $1.03 | 15d | 36 | 1.06mi |
| 950 S Hebron Ave Apt 301 Evansville, IN | 2.0 | 1.0 | 1088 | $1,900 | $1.75 | 22d | 1 | 1.11mi |
| 815 Erie Ave Evansville, IN | 1.0–2.0 | 1.0–2.5 | 1038 | $1,349 | $1.30 | 15d | 17 | 1.15mi |
| 700 Chateau Dr Evansville, IN | 2.0 | 1.0 | 825 | $695 | $0.84 | 15d | 2 | 1.36mi |
| 3951 Bellemeade Ave Unit D Evansville, IN | 2.0 | 1.0 | 825 | $1,100 | $1.33 | 22d | 1 | 1.38mi |
| 2947 Ravenswood Dr Unit 2927 Evansville, IN | 2.0 | 1.0 | 1150 | $975 | $0.85 | 22d | 1 | 1.39mi |
| 1713 Hawthorne Ave Evansville, IN | 3.0 | 2.0 | 1204 | $1,395 | $1.16 | 22d | 1 | 1.40mi |
Listing history 10 events
-
2026-06-02status $110,000 Pending 2 DOM
-
2026-06-01days on market $110,000 Active 2 DOM
-
2026-05-31days on market $110,000 Active 1 DOM
-
2026-05-19price $119,000
-
2026-05-12price $121,000
-
2026-05-05price $123,000
-
2026-04-28price $125,500
-
2026-04-21price $130,000
-
2026-04-13price $132,500
-
2026-03-27$134,900 Active
ⓘ Source: listings_history table (triggers on properties + properties_extension) + one-shot
backfill from property_details.listing_events for pre-trigger history.
Tax reassessment forecast IN · Partial reset (capped growth)
- Current annual tax
- $470 · $39/mo
- Projected year-2 tax
- $703 · $59/mo
- Expected delta
- +$232/yr (+$19/mo · 49.5%)
ⓘ Screening estimate from a state-policy table — verify with the county assessor before closing.
Climate risk First Street
- Flood 1/10 Low FEMA zone X (shaded) · 0% chance over 30 yrs
- Wildfire 1/10 Low
- Heat 5/10 Major 7 d/yr ≥107°F today · 19 d/yr by 30 yrs out
- Wind 2/10 Low 3% chance of damaging wind over 30 yrs
- Air quality 3/10 Moderate 3 unhealthy d/yr today · 4 by 30 yrs out
Nearby sold comps map
Loading sold comps map…
Walkable amenities ~0.75 mi
Loading nearby amenities…
Taxation est. · year 1
- Rental income
- $13,714
- − Mortgage interest
- −$6,162
- − Property taxes
- −$470
- − Insurance
- −$550
- − Repairs & maintenance
- −$1,097
- − Management
- −$1,097
- − Depreciation
- −$3,200
- Taxable income
- $1,138
- Est. tax owed @ 24.0%
- −$273
- After-tax cash flow
- $2,619/yr
For passive investors: Depreciation is non-cash, so a rental often shows a tax loss while cash-flowing — sheltering income. Rental losses are passive: they offset passive income freely, and up to $25,000/yr can offset ordinary (W-2) income if you actively participate and your MAGI is under $100k (phasing out to $0 by $150k); unused losses carry forward. On sale, claimed depreciation is recaptured at up to 25%, and gains may owe capital-gains tax (a 1031 exchange can defer both). Figures are a year-1 estimate at your 24.0% rate — not tax advice; consult a CPA.
Schools (NCES district)
- District
- Evansville Vanderburgh School Corporation
- NCES district ID
- 1803450
- Math proficiency
- 36% ▼ -7.00%
- Reading proficiency
- 43% ▼ -3.00%
- Median HH income
- $43,270
- Composite
- 33.41/100
- National rank
- #5471
- State rank
- #153 of 301 in IN
Livability — Evansville
- Score
- 63/100
- State rank
- #416
- US rank
- #15047
Category grades
Schools grade is shown separately in the Schools card above.
Census & demographics
- Census place
- Evansville, IN
- County
- Vanderburgh County · 146,793 people
- City population
- 146,793
- Metro
- Evansville, IN-KY
- Population (ZIP)
- 29,280
- Household income
- $60,897
- Rent vs Own
- Severe rent burden
- 1652.0
Population outlook (Vanderburgh County) Hauer SSP2
- Today (2025)
- 187,038 people
- By 2030
- 188,907 · +1.0%
- By 2040
- 190,272 · +1.7%
- By 2050
- 188,871 · +1.0%
- By 2075
- 180,751 · -3.4%
- By 2100
- 163,015 · -12.8%
Race, ethnicity, and origin ACS 2023
- Neighborhood character
- Predominantly White (74%)
- Race & ethnicity
- White 74% Black 13% Hispanic / Latino 6% Two or more races 4% Asian 2% Native American 1%
- Hispanic origin (detail)
- Mexican 5%
- Common ancestry
- Slovak 3% Romanian 2% Italian 2%
- Foreign-born
- 6% · Canada, China
- Languages at home
- 93% English-only · Spanish 4% Chinese 1%
Political lean MEDSL · Vanderburgh
- 2024 margin
- R (+12.7) · D 43.0% · R 55.6% · Other 1.4%
- 2008→2024 swing
- -15.1pp toward R · 2008: 2.5pp · 2024: -12.7pp
- All cycles
- 2024: R+12.7 2020: R+9.6 2016: R+16.9 2012: R+10.8 2008: D+2.5
Not yet ingested
- Civics
- —
Market trends
- HPI YoY
- ▼ -113.01%
- Current HPI
- 195.7299
- Rent YoY
- —
- Metro
- Evansville, IN-KY
- State GDP YoY
- ▲ 2.90%
- F500 in state
- 18
Industry mix (Fortune 500 HQ in IN)
| Industry | F500 HQs | Revenue |
|---|---|---|
| Industrial Machinery | 2 | $37B |
|
||
| Healthcare | 1 | $177B |
|
||
| Pharmaceuticals | 1 | $45B |
|
||
| Metals / Steel | 1 | $18B |
|
||
| Agriculture | 1 | $17B |
|
||
| Packaging | 1 | $12B |
|
||
Price history
-11.8% since first listed7 events — show timeline
- 2026-05-19 Price Changed $119,000 IRMLS
- 2026-05-12 Price Changed $121,000 IRMLS
- 2026-05-05 Price Changed $123,000 IRMLS
- 2026-04-28 Price Changed $125,500 IRMLS
- 2026-04-21 Price Changed $130,000 IRMLS
- 2026-04-13 Price Changed $132,500 IRMLS
- 2026-03-27 Listed $134,900 IRMLS
Property tax history
-15.3%/yrLatest (2024): $470 · -80.9% YoY. Source: county tax records.
Cash-flow waterfall
monthlySold comps — $/sqft
last 12 mo · ≤1 miLoading sold comps…