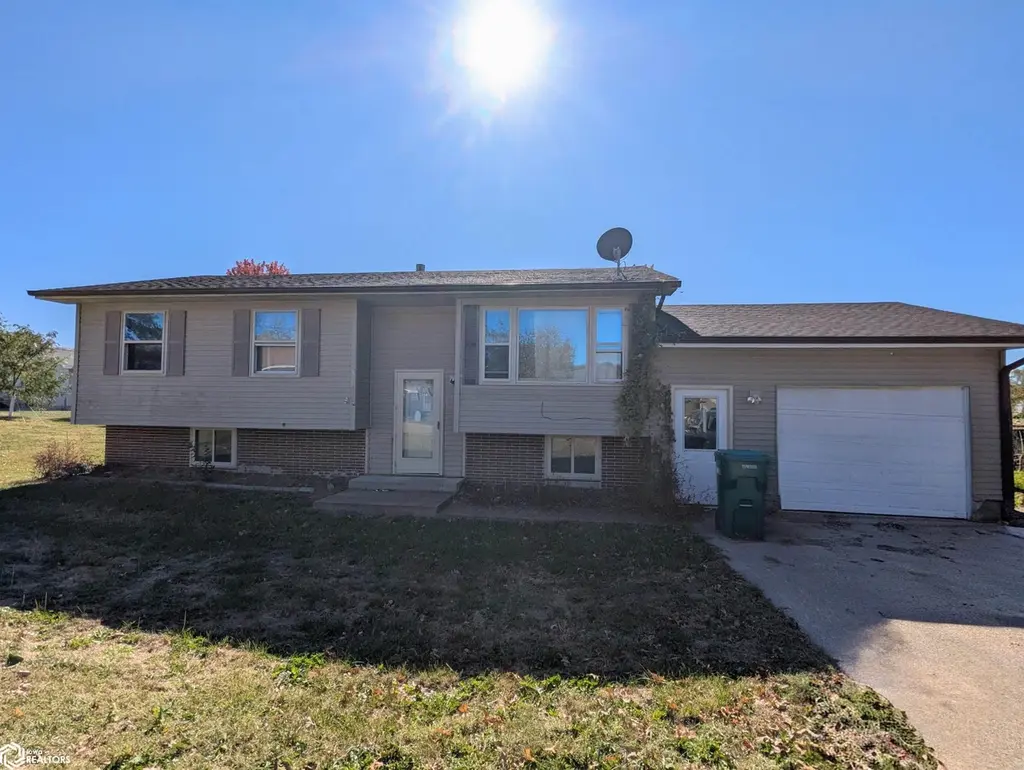
103 W Sherrie Ln · New London, IA
Flood risk 4/10 · Minor
- FEMA flood zone
- X (unshaded)
- Chance of flooding over 30 yrs
- 0.2%
- Est. flood insurance / yr
- $473 – $860
Fire risk 1/10 · Minimal
- Est. fire insurance / yr
- $902 – $1,676
Heat risk 3/10 · Minor
- Hot days now (above 106°F)
- 7 days/yr
- Hot days in 30 yrs
- 15 days/yr
Wind risk 2/10 · Minimal
- Chance of severe wind over 30 yrs
- —
Air-quality risk 2/10 · Minimal
- Unhealthy air days now
- 1 days/yr
- Unhealthy air days in 30 yrs
- 2 days/yr
Risk factors via First Street. Map © Google.
Why this score? — see what drove the B+ grade
The composite is a weighted blend of 9 inputs, each scored 0–100. Each bar is that input's sub-score; the figure is the points it added to the 100-point composite (weight × sub-score).
- Cash flow +30.0/30.0
- 1% rule +10.0/10.0
- DSCR +10.0/10.0
- ARV discount +7.5/15.0
- Appreciation +6.2/10.0
- Schools +5.5/10.0
- Livability +3.8/5.0
- Rent growth +2.5/5.0
- Condition / age +2.5/5.0
$67,517
🖨 Deal sheet (PDF) 📄 Offer letter ✓ Due diligence
Listing remarks
Take a look at this 3 bedroom home with an attached garage, fenced back yard and deck. Call for your showing today! This is a USDA property sold as "As-Is, Where-Is". Title will only be conveyed by Quitclaim Deed.
Key facts
- Fenced back yard
- Attached garage
- Deck
Tags
Property features AI
Exterior
- Parking: Attached garage (1 car)
- Utilities: Public water; Public sewer
- Home design: Single-family residence; Residential property
- Construction: Vinyl siding
- Exterior features: Lot roughly 0.17 acres (approx. 60 x 123)
Interior
- Bathrooms: 1 full bathroom; 1 half bathroom
- Heating & cooling: Central air conditioning; Forced air heating
- Interior features: Basement present
Neighborhood map
What this means for you Summary
Snapshot
- This is a 4-bed/2.5-bath single-family listed at $68k.
Deal economics
- At list price, monthly cash flow is $358 ($4k/yr) — positive.
- The deal already cash-flows at list — no discount required.
- Meets the 1% rule at list price ($1k rent vs $68k).
- Recommended offer: $65k (3.0% below list) — sets the bar for market timing.
Location & tenants
- Location reads 76/100 on livability (#188 in IA, #3,417 nationally) — a middle-class / working-renter tenant base. Strengths: crime A+, cost of living A+, housing A+; Watch: employment D+, amenities F, commute F.
- New London Community School District (rural): math 63% / reading 68% proficiency, ranked #194 of 289 in IA (top 67%) — acceptable for families but not a draw, mixed tenant base, ~2y average lease.
- Zoned schools: Clark Elementary School (math 62% / reading 62%, grade B, #363 of 616 statewide, top 62%, 289 students, 39% FRL); New London Jr-Sr High School (math 63% / reading 72%, grade B, #186 of 336 statewide, top 57%, 303 students, 40% FRL).
- Market conditions: 13 active listings in the ZIP; 30 units permitted in Henry County in 2024 (8 in 5+ unit buildings).
Forward outlook
- In year one you build about $2k of equity ($467 loan paydown + $2k appreciation (2.5% local appreciation)).
- Henry County population projected to shrink 9% by 2050 — rents likely to lag national; underwrite the cash flow, not the appreciation.
- At projected returns (2.5% appreciation + 3.0% rent growth), your $19k cash investment doubles in ~3 years — after that, you're playing with house money.
Negotiation context
- It's been on market 55 days — a 3% lower offer ($65k) is reasonable based on typical stale-listing flexibility.
- 4 sale attempts since 6y ago with the ask held roughly flat each time — persistent listings suggest the price (not the market) is what's stuck; bring a comps-based counter.
Risks & watch-outs
- Watch-outs: property tax is 4.5% of price.
Questions for the listing agent
- It's been on market 55 days. Have you received any prior offers? Is the seller open to a 3% concession, seller financing, or rate buy-down credit?
- Built in 1979 — when were the roof, HVAC, electrical panel, plumbing, and water heater last replaced?
- Property tax is high relative to price — has the assessment been appealed recently, and will the sale trigger a re-assessment?
- Is there a deadline driving the sale (1031 exchange, divorce, estate, relocation)? That informs how much negotiation room exists.
- Schools are B-rated — typically a magnet for longer-tenancy family renters. What's the average tenant stay here, and is there a school-zone premium baked into asking?
- What's the average days-on-market for RENTAL listings here right now (not sales)? A rising rental-DOM trend means longer vacancies and softer asking-rent achievability than the comps imply.
- What's the recent tenant-quality profile in this submarket — average credit score on applications, eviction rate, late-payment / NSF rate, and stable-employment percentage? A property-management company in the area should have these aggregated.
- How much new for-sale + rental construction is in the pipeline within 1–3 miles? Heavy new supply typically softens prices + rents 12–24 months out; constrained supply supports both.
Investment metrics
- 1% rule
- 1.86% ✓
- Cap rate
- 12.65%
- Cash-on-cash
- 22.72%
- DSCR
- 2.01
- GRM
- 4.5
CMA / ARV
- ARV (median comp)
- $143,260
- List price
- $67,517
- Delta
- -52.87%
- Verdict
- UNDERPRICED
- Comps
- 20 within 1.0 mi
Show comp detail 5 sales within ~0.75 mi
| Address | Dist | Beds/Ba | Sqft | Sold | Price | $/sf | Match |
|---|---|---|---|---|---|---|---|
| 403 W Adams St | 0.64mi | 5/3.0 (+1) | 1,746 (+1%) | 19mo | $378,000 | $216 | 46 |
| 501 Sunset | 0.72mi | 3/2.0 (-1) | 1,672 (-3%) | 15mo | $384,130 | $230 | 41 |
| 106 E Wilson St | 0.52mi | 3/2.0 (-1) | 1,560 (-10%) | 14mo | $116,000 | $74 | 40 |
| 501 W Adams St | 0.64mi | 5/3.0 (+1) | 1,836 (+6%) | 22mo | $355,000 | $193 | 34 |
| 106 Hickory Cir. Cir | 0.75mi | 3/2.5 (-1) | 1,640 (-5%) | 22mo | $357,900 | $218 | 33 |
Match score weights: distance 35% · size 25% · config 20% · recency 20%. Top-matched comps best support the ARV.
Projected returns pro-forma
2.46% appreciation · 3.0% rent growth · sell at horizon
- IRR
- 27.9%
- Equity multiple
- 2.54×
- Total profit
- $29,142
- Equity at exit
- $28,331
- IRR
- 29.1%
- Equity multiple
- 4.94×
- Total profit
- $74,402
- Equity at exit
- $42,146
Cash invested: $18,905 (down + closing). Projections, not guarantees.
Landlord ↔ Tenant lean methodology
- Overall (STATE)
- 83 Strongly Landlord-Friendly
- State Iowa
- 83 Strongly Landlord-Friendly · R+6
- County
- — inherits STATE
- City
- — inherits STATE
ZIP-level market 52645
- Home prices YoY
- 1.3%
- Active inventory
- 13
- Price-to-rent
- 4.5×
Monthly cashflow live
- Estimated rent
- $1,257 medium interval (Pro) →
- Mortgage (P&I)
- −$354
- Tax from tax record
- −$253 /mo · $3,032/yr
- Insurance
- −$28
- HOA
- −$0
- Vacancy / Maint / Mgmt
- −$264
- Net cashflow
- $358
Break-even live
Sensitivity live
| Price | -10% $396 | -5% $377 | +0% $358 | +5% $339 | +10% $320 |
|---|---|---|---|---|---|
| Rent | -10% $259 | -5% $308 | +0% $358 | +5% $407 | +10% $457 |
| Rate | -1.0pp $392 | -0.5pp $375 | base $358 | +0.5pp $340 | +1.0pp $323 |
UW: 25.0% down · 7.5% · 30yr · 1.5% tax · 5.0% vac · 8.0% maint · 8.0% mgmt
Financing live
Cash to close
- Down payment
- $16,879
- Closing costs
- $2,026
- Reserves months
- —
- Total cash needed
- —
Loan-product check · same deal, 3 products live
Conventional
25% down · 7.5% · 30yr
- Down + closing
- —
- Monthly P&I
- —
- Monthly cashflow
- —
- DSCR
- —
- Eligible?
- —
Personal DTI + credit; lowest rate.
DSCR
20% down · 8.5% · 30yr
- Down + closing
- —
- Monthly P&I
- —
- Monthly cashflow
- —
- DSCR
- —
- Eligible?
- —
No personal income docs; deal must DSCR.
Hard money
10% down · 12.0% · 12mo
- Down + closing
- —
- Monthly P&I
- —
- Monthly cashflow
- —
- DSCR
- —
- Eligible?
- —
Short-term bridge; refi at stabilization.
Listing history 22 events
-
2026-06-21days on market $67,517 Active 55 DOM
-
2026-06-21days on market $67,517 Active 54 DOM
-
2026-06-18days on market $67,517 Active 52 DOM
-
2026-06-17days on market $67,517 Active 51 DOM
-
2026-06-16days on market $67,517 Active 50 DOM
-
2026-06-15days on market $67,517 Active 49 DOM
-
2026-06-13days on market $67,517 Active 47 DOM
-
2026-06-12days on market $67,517 Active 46 DOM
-
2026-06-09days on market $67,517 Active 43 DOM
-
2026-06-08days on market $67,517 Active 42 DOM
-
2026-06-07days on market $67,517 Active 41 DOM
-
2026-06-05days on market $67,517 Active 39 DOM
-
2026-06-04days on market $67,517 Active 37 DOM
-
2026-06-02days on market $67,517 Active 36 DOM
-
2026-06-01days on market $67,517 Active 35 DOM
-
2026-05-31days on market $67,517 Active 34 DOM
-
2026-05-31days on market $67,517 Active 33 DOM
-
2026-04-27$71,070 Active 223-char remark
-
2021-07-24$103,000
-
2020-11-23$119,000
-
2020-06-05$128,000
-
2007-01-12soldstatus $84,000
ⓘ Source: listings_history table (triggers on properties + properties_extension) + one-shot
backfill from property_details.listing_events for pre-trigger history.
Tax reassessment forecast IA · Partial reset (capped growth)
- Current annual tax
- $3,032 · $253/mo
- Projected year-2 tax
- $3,032 · $253/mo
- Expected delta
- $0/yr ($0/mo · 0.0%)
ⓘ Screening estimate from a state-policy table — verify with the county assessor before closing.
Climate risk First Street
- Flood 4/10 Moderate FEMA zone X (unshaded) · 20% chance over 30 yrs
- Wildfire 1/10 Low
- Heat 3/10 Moderate 7 d/yr ≥106°F today · 15 d/yr by 30 yrs out
- Wind 2/10 Low
- Air quality 2/10 Low 1 unhealthy d/yr today · 2 by 30 yrs out
Nearby sold comps map
Loading sold comps map…
Walkable amenities ~0.75 mi
Loading nearby amenities…
Taxation est. · year 1
- Rental income
- $15,079
- − Mortgage interest
- −$3,782
- − Property taxes
- −$3,032
- − Insurance
- −$338
- − Repairs & maintenance
- −$1,206
- − Management
- −$1,206
- − Depreciation
- −$1,964
- Taxable income
- $3,551
- Est. tax owed @ 24.0%
- −$852
- After-tax cash flow
- $3,442/yr
For passive investors: Depreciation is non-cash, so a rental often shows a tax loss while cash-flowing — sheltering income. Rental losses are passive: they offset passive income freely, and up to $25,000/yr can offset ordinary (W-2) income if you actively participate and your MAGI is under $100k (phasing out to $0 by $150k); unused losses carry forward. On sale, claimed depreciation is recaptured at up to 25%, and gains may owe capital-gains tax (a 1031 exchange can defer both). Figures are a year-1 estimate at your 24.0% rate — not tax advice; consult a CPA.
Schools (NCES district)
- District
- New London Community School District
- NCES district ID
- 1920460
- Math proficiency
- 63% ▲ 2.00%
- Reading proficiency
- 68% ▲ 5.00%
- Median HH income
- $46,710
- Composite
- 55.31/100
- National rank
- #1260
- State rank
- #194 of 289 in IA
Livability — New London
- Score
- 76/100
- State rank
- #188
- US rank
- #3417
Category grades
Schools grade is shown separately in the Schools card above.
Census & demographics
- Census place
- New London, IA
- Population (ZIP)
- 3,472
Population outlook (Henry County) Hauer SSP2
- Today (2025)
- 19,583 people
- By 2030
- 19,271 · -1.6%
- By 2040
- 18,505 · -5.5%
- By 2050
- 17,796 · -9.1%
- By 2075
- 16,821 · -14.1%
- By 2100
- 15,549 · -20.6%
Race, ethnicity, and origin ACS 2023
- Neighborhood character
- Predominantly White (94%)
- Race & ethnicity
- White 94% Two or more races 3% Hispanic / Latino 3%
- Common ancestry
- Portuguese 5% Iranian 2% Lithuanian 2%
- Foreign-born
- 0%
- Languages at home
- 99% English-only · Spanish 1% Other Indo-European 1%
Political lean MEDSL · Henry
- 2024 margin
- Solid R (+36.0) · D 31.3% · R 67.3% · Other 1.5%
- 2008→2024 swing
- -30.9pp toward R · 2008: -5.0pp · 2024: -36.0pp
- All cycles
- 2024: R+36.0 2020: R+32.4 2016: R+30.9 2012: R+6.0 2008: R+5.0
Not yet ingested
- Civics
- —
Market trends
- HPI YoY
- ▲ 2.46%
- Current HPI
- 197.8445
- Rent YoY
- —
- Metro
- —
- State GDP YoY
- ▲ 2.48%
- F500 in state
- 4
Industry mix (Fortune 500 HQ in IA)
| Industry | F500 HQs | Revenue |
|---|---|---|
| Financial Services | 1 | $16B |
|
||
| Retail / Convenience | 1 | $15B |
|
||
Price history
-19.6% since first listed6 events — show timeline
- 2026-05-27 Price Changed $67,517 IAR
- 2026-04-27 Listed $71,070 IAR
- 2021-07-24 Listed $103,000 IAR
- 2020-11-23 Listed $119,000 IAR
- 2020-06-05 Listed $128,000 IAR
- 2007-01-12 Sold (Public Records) $84,000 Public Records
Property tax history
+5.4%/yrLatest (2025): $3,032 · +5.4% YoY. Source: county tax records.
Cash-flow waterfall
monthlySold comps — $/sqft
last 12 mo · ≤1 miLoading sold comps…