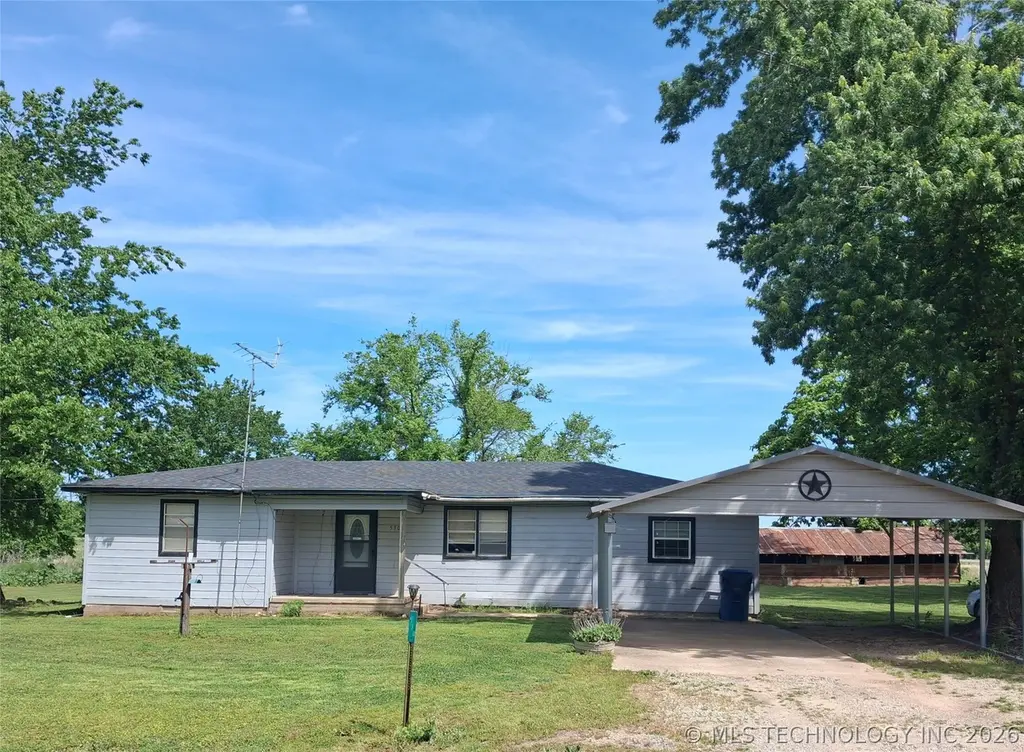
530 E Sparks St · Dustin, OK
Flood risk 1/10 · Minimal
- FEMA flood zone
- X (unshaded)
- Chance of flooding over 30 yrs
- 0.0%
- Est. flood insurance / yr
- $507 – $1,088
Fire risk 8/10 · Major
- Est. fire insurance / yr
- $2,463 – $4,575
Heat risk 6/10 · Moderate
- Hot days now (above 111°F)
- 7 days/yr
- Hot days in 30 yrs
- 19 days/yr
Wind risk 3/10 · Minor
- Chance of severe wind over 30 yrs
- 9.0%
Air-quality risk 3/10 · Minor
- Unhealthy air days now
- 2 days/yr
- Unhealthy air days in 30 yrs
- 3 days/yr
Risk factors via First Street. Map © Google.
Why this score? — see what drove the B grade
The composite is a weighted blend of 9 inputs, each scored 0–100. Each bar is that input's sub-score; the figure is the points it added to the 100-point composite (weight × sub-score).
- Cash flow +28.3/30.0
- DSCR +10.0/10.0
- 1% rule +7.8/10.0
- ARV discount +7.5/15.0
- Appreciation +5.0/10.0
- Schools +5.0/10.0
- Rent growth +2.5/5.0
- Livability +2.5/5.0
- Condition / age +2.5/5.0
$85,000
🖨 Deal sheet 📄 Offer letter ✓ Due diligence
Listing remarks
Space, Storage, and Opportunity all in One! This 3-bedroom 1 bath property offers a large carport, shop, several outbuildings, and sets on multiple lots. Plenty of room for Hobbies, Equipment, or Future Possibilities. There is a 2nd Full bathroom not completed.
Key facts
- 0.93 acre lot
- 2 garage spots
- Built 1976
Property features AI
Exterior
- Parking: Detached garage; 2-car garage; Carport; Garage workshop; Garage storage; Shelves in garage
- Security: Storm shelter
- Utilities: Public water; Septic tank sewer; Electricity available; Natural gas available; Cable available; Phone available
- Home design: Single-story; Faces south; Slab foundation
- Construction: Vinyl siding; Wood siding; Wood frame construction; Asphalt/fiberglass roof; Built (year from public records)
- Exterior features: Mature trees; Workshop (other structure); Storm shelter; Horses allowed
Interior
- Kitchen: Range
- Flooring: Carpet; Laminate
- Bathrooms: 1 full bathroom
- Heating & cooling: Gas heating
- Interior features: High ceilings; Ceiling fan(s); High speed internet; Laminate counters; Aluminum window frames; Electric oven/range connection
- Laundry & utility: Washer hookup; Electric dryer hookup; Electric water heater
Neighborhood map
What this means for you Summary
Snapshot
- This is a 2-bed/1.0-bath single-family listed at $85k.
Deal economics
- At list price, monthly cash flow is $272 ($3k/yr) — positive.
- The deal already cash-flows at list — no discount required.
- Meets the 1% rule at list price ($1k rent vs $85k).
- Recommended offer: $82k (3.0% below list) — sets the bar for market timing.
Location & tenants
- Location reads 49/100 on livability (#684 in OK) — a working-class tenant base; expect higher turnover. Strengths: cost of living A+; Watch: housing C-, schools F, crime F.
- Market conditions: 12 active listings in the ZIP; 7 units permitted in Hughes County in 2024 (0 in 5+ unit buildings).
Forward outlook
- In year one you build about $3k of equity ($588 loan paydown + $3k appreciation (3.0% local appreciation)).
- At projected returns (3.0% appreciation + 3.0% rent growth), your $24k cash investment doubles in ~4 years — after that, you're playing with house money.
- By year 10, paydown + projected appreciation supports a ~$30k cash-out refi (75% LTV) — recoverable capital for the next deal without selling this one.
Negotiation context
- It's been on market 59 days — a 3% lower offer ($82k) is reasonable based on typical stale-listing flexibility.
Risks & watch-outs
- Climate carrying-cost: severe wildfire risk; extreme-heat days projected 7→19/yr by 2055 (HVAC capex compounding) — expect insurance premiums to compound above CPI over the hold.
Questions for the listing agent
- It's been on market 59 days. Have you received any prior offers? Is the seller open to a 3% concession, seller financing, or rate buy-down credit?
- Built in 1976 — when were the roof, HVAC, electrical panel, plumbing, and water heater last replaced?
- Is there a deadline driving the sale (1031 exchange, divorce, estate, relocation)? That informs how much negotiation room exists.
- Schools are F-rated, which usually means shorter tenancies and higher turnover. Who's the typical renter profile here, and what's been the actual vacancy rate?
- Crime grade is F in this area — have there been break-ins, vandalism, or insurance claims at this property in the last 3 years? What carrier currently insures it and at what premium?
- What's the average days-on-market for RENTAL listings here right now (not sales)? A rising rental-DOM trend means longer vacancies and softer asking-rent achievability than the comps imply.
- What's the recent tenant-quality profile in this submarket — average credit score on applications, eviction rate, late-payment / NSF rate, and stable-employment percentage? A property-management company in the area should have these aggregated.
- How much new for-sale + rental construction is in the pipeline within 1–3 miles? Heavy new supply typically softens prices + rents 12–24 months out; constrained supply supports both.
Investment metrics
- 1% rule
- 1.28% ✓
- Cap rate
- 10.13%
- Cash-on-cash
- 13.70%
- DSCR
- 1.61
- GRM
- 6.5
CMA / ARV
- ARV (on-the-fly)
- $230,526
- Comps found
- 1
Show comp detail 1 sale within ~0.75 mi
| Address | Dist | Beds/Ba | Sqft | Sold | Price | $/sf | Match |
|---|---|---|---|---|---|---|---|
| 48 S Mccann Ave | 0.67mi | 3/1.0 (+1) | 1,232 (-13%) | 24mo | $200,000 | $162 | 21 |
Match score weights: distance 35% · size 25% · config 20% · recency 20%. Top-matched comps best support the ARV.
Projected returns pro-forma
3.0% appreciation · 3.0% rent growth · sell at horizon
- IRR
- 20.4%
- Equity multiple
- 2.16×
- Total profit
- $27,563
- Equity at exit
- $38,220
- IRR
- 21.5%
- Equity multiple
- 4.11×
- Total profit
- $73,902
- Equity at exit
- $58,901
Cash invested: $23,800 (down + closing). Projections, not guarantees.
Landlord ↔ Tenant lean methodology
- Overall (STATE)
- 83 Strongly Landlord-Friendly
- State Oklahoma
- 83 Strongly Landlord-Friendly · R+20
- County
- — inherits STATE
- City
- — inherits STATE
ZIP-level market 74839
- Active inventory
- 12
- Price-to-rent
- 6.5×
Monthly cashflow live
- Estimated rent
- $1,088 medium interval (Pro) →
- Mortgage (P&I)
- −$446
- Tax est. 1.5%
- −$106 /mo · $1,275/yr
- Insurance
- −$35
- HOA
- −$0
- Vacancy / Maint / Mgmt
- −$228
- Net cashflow
- $272
Break-even live
UW: 25.0% down · 7.5% · 30yr · 1.5% tax · 5.0% vac · 8.0% maint · 8.0% mgmt
Financing live
Cash to close
- Down payment
- $21,250
- Closing costs
- $2,550
- Reserves months
- —
- Total cash needed
- —
Loan-product check · same deal, 3 products live
Conventional
25% down · 7.5% · 30yr
- Down + closing
- —
- Monthly P&I
- —
- Monthly cashflow
- —
- DSCR
- —
- Eligible?
- —
Personal DTI + credit; lowest rate.
DSCR
20% down · 8.5% · 30yr
- Down + closing
- —
- Monthly P&I
- —
- Monthly cashflow
- —
- DSCR
- —
- Eligible?
- —
No personal income docs; deal must DSCR.
Hard money
10% down · 12.0% · 12mo
- Down + closing
- —
- Monthly P&I
- —
- Monthly cashflow
- —
- DSCR
- —
- Eligible?
- —
Short-term bridge; refi at stabilization.
Listing history 16 events
-
2026-06-18days on market $85,000 Active 59 DOM
-
2026-06-17days on market $85,000 Active 58 DOM
-
2026-06-16days on market $85,000 Active 57 DOM
-
2026-06-15days on market $85,000 Active 56 DOM
-
2026-06-13days on market $85,000 Active 54 DOM
-
2026-06-12days on market $85,000 Active 53 DOM
-
2026-06-09days on market $85,000 Active 50 DOM
-
2026-06-08days on market $85,000 Active 49 DOM
-
2026-06-08days on market $85,000 Active 48 DOM
-
2026-06-05days on market $85,000 Active 46 DOM
-
2026-06-04days on market $85,000 Active 44 DOM
-
2026-06-02days on market $85,000 Active 43 DOM
-
2026-06-01days on market $85,000 Active 42 DOM
-
2026-05-31days on market $85,000 Active 41 DOM
-
2026-05-05price $94,000
-
2026-04-21$99,000 Active
ⓘ Source: listings_history table (triggers on properties + properties_extension) + one-shot
backfill from property_details.listing_events for pre-trigger history.
Climate risk First Street
- Flood 1/10 Low FEMA zone X (unshaded) · 0% chance over 30 yrs
- Wildfire 8/10 Severe
- Heat 6/10 Major 7 d/yr ≥111°F today · 19 d/yr by 30 yrs out
- Wind 3/10 Moderate 9% chance of damaging wind over 30 yrs
- Air quality 3/10 Moderate 2 unhealthy d/yr today · 3 by 30 yrs out
Nearby sold comps map
Loading sold comps map…
Walkable amenities ~0.75 mi
Loading nearby amenities…
Taxation est. · year 1
- Rental income
- $13,050
- − Mortgage interest
- −$4,761
- − Property taxes
- −$1,275
- − Insurance
- −$425
- − Repairs & maintenance
- −$1,044
- − Management
- −$1,044
- − Depreciation
- −$2,473
- Taxable income
- $2,028
- Est. tax owed @ 24.0%
- −$487
- After-tax cash flow
- $2,774/yr
For passive investors: Depreciation is non-cash, so a rental often shows a tax loss while cash-flowing — sheltering income. Rental losses are passive: they offset passive income freely, and up to $25,000/yr can offset ordinary (W-2) income if you actively participate and your MAGI is under $100k (phasing out to $0 by $150k); unused losses carry forward. On sale, claimed depreciation is recaptured at up to 25%, and gains may owe capital-gains tax (a 1031 exchange can defer both). Figures are a year-1 estimate at your 24.0% rate — not tax advice; consult a CPA.
Schools (NCES district)
No district data.
Livability — Dustin
- Score
- 49/100
- State rank
- #684
- US rank
- #25959
Category grades
Schools grade is shown separately in the Schools card above.
Census & demographics
- Census place
- Dustin, OK
- Population (ZIP)
- 675
Population outlook (Hughes County) Hauer SSP2
- Today (2025)
- 13,323 people
- By 2030
- 13,172 · -1.1%
- By 2040
- 13,060 · -2.0%
- By 2050
- 13,130 · -1.4%
- By 2075
- 13,932 · +4.6%
- By 2100
- 14,649 · +10.0%
Race, ethnicity, and origin ACS 2023
- Neighborhood character
- Diverse neighborhood (Simpson 0.60)
- Race & ethnicity
- White 63% Native American 25% Hispanic / Latino 5% Black 4% Two or more races 3% Pacific Islander 3%
- Common ancestry
- Slovak 1% Lithuanian 1%
Political lean MEDSL · Hughes
- 2024 margin
- Solid R (+62.5) · D 17.8% · R 80.4% · Other 1.8%
- 2008→2024 swing
- -33.1pp toward R · 2008: -29.4pp · 2024: -62.5pp
- All cycles
- 2024: R+62.5 2020: R+60.9 2016: R+53.6 2012: R+34.9 2008: R+29.4
Not yet ingested
- Civics
- —
Market trends
- HPI YoY
- —
- Current HPI
- —
- Rent YoY
- —
- Metro
- —
- State GDP YoY
- ▲ 1.55%
- F500 in state
- 6
Industry mix (Fortune 500 HQ in OK)
| Industry | F500 HQs | Revenue |
|---|---|---|
| Energy | 3 | $48B |
|
||
Price history
-5.1% since first listed2 events — show timeline
- 2026-05-05 Price Changed $94,000 MLS Technology, Inc.
- 2026-04-21 Listed $99,000 MLS Technology, Inc.
Property tax history
+4.3%/yrLatest (2025): $73 · -0.4% YoY. Source: county tax records.
Cash-flow waterfall
monthlySold comps — $/sqft
last 12 mo · ≤1 miLoading sold comps…