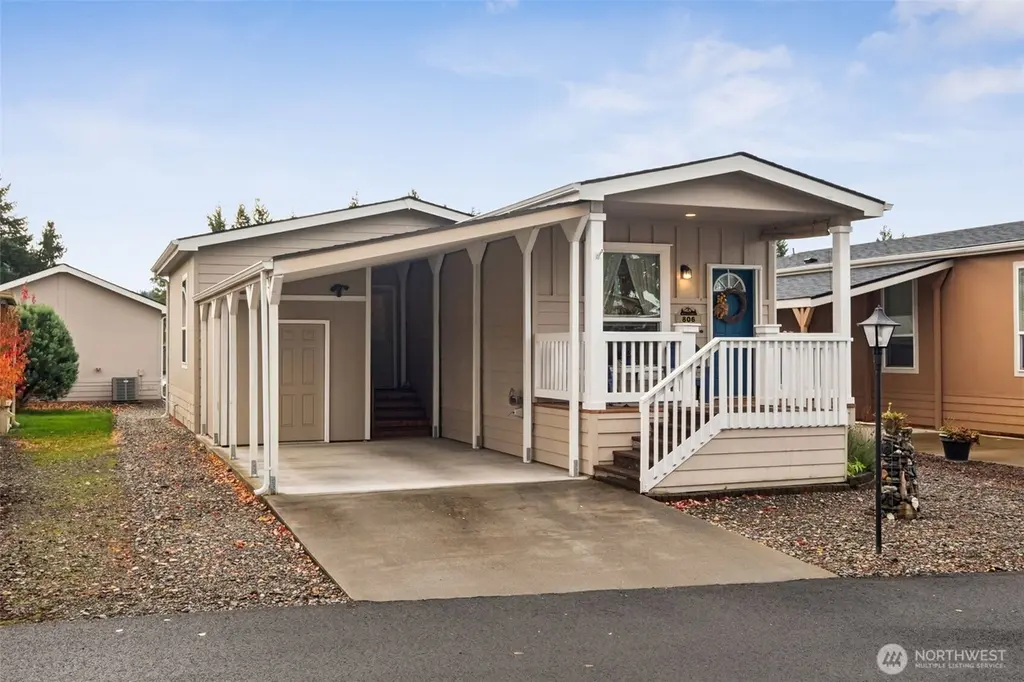
806 Pine Dr · Enumclaw, WA
Flood risk 5/10 · Moderate
- FEMA flood zone
- X (unshaded)
- Chance of flooding over 30 yrs
- 0.66%
- Est. flood insurance / yr
- $507 – $1,088
Fire risk 3/10 · Minor
- Est. fire insurance / yr
- $604 – $1,122
Heat risk 2/10 · Minimal
- Hot days now (above 87°F)
- 7 days/yr
- Hot days in 30 yrs
- 15 days/yr
Wind risk 1/10 · Minimal
- Chance of severe wind over 30 yrs
- —
Air-quality risk 6/10 · Moderate
- Unhealthy air days now
- 10 days/yr
- Unhealthy air days in 30 yrs
- 12 days/yr
Risk factors via First Street. Map © Google.
Why this score? — see what drove the B- grade
The composite is a weighted blend of 9 inputs, each scored 0–100. Each bar is that input's sub-score; the figure is the points it added to the 100-point composite (weight × sub-score).
- Cash flow +30.0/30.0
- 1% rule +10.0/10.0
- DSCR +10.0/10.0
- Schools +5.5/10.0
- Livability +4.4/5.0
- Rent growth +3.6/5.0
- Condition / age +2.5/5.0
- ARV discount +0.0/15.0
- Appreciation +0.0/10.0
$109,495
🖨 Deal sheet 📄 Offer letter ✓ Due diligence
Listing remarks
MOTIVATED SELLERS AND A NEW PRICE! Welcome to this unique manufactured home- a single wide in front and a double wide in back in the desirable 55+ community of Mt. Villa. 2019 New Build, not a property flip. The home meets all Energy Star specifications. The kitchen has 42" white shaker cabinets, stainless steel appliances, and vinyl plank flooring with an adjoining eat-in bar. Large primary bedroom w/ walk in closet -adjoining bathroom has nice built-in cabinets/drawers in the linen closet. 2nd Bedroom for guests & or office along with additional 2nd bathroom. Enjoy the convenience of a tall carport attached and 10x10 storage shed. Mt. Villa offers a vibrant lifestyle with a clu
Key facts
- Eat-in bar
- Built-in cabinets
- Walk in closet
Tags
Neighborhood map
What this means for you Summary
Snapshot
- This is a 2-bed/2.0-bath manufactured listed at $109k.
Deal economics
- At list price, monthly cash flow is $855 ($10k/yr) — positive.
- The deal already cash-flows at list — no discount required.
- Meets the 1% rule at list price ($2k rent vs $109k).
- Recommended offer: $96k (12.0% below list) — sets the bar for market timing.
- Cap rate 15.7% vs local median 2.4% in Enumclaw — top-decile yield for the area; either an underpriced asset or a hidden risk that comps aren't pricing in. Stress-test before assuming the spread holds.
Location & tenants
- Location reads 88/100 on livability (#12 in WA, #222 nationally) — a professional / high-income tenant draw. Strengths: crime A+, amenities A+, housing A+; Watch: cost of living D-.
- Enumclaw School District (suburban): math 54% / reading 68% proficiency, ranked #46 of 291 in WA (top 16%) — acceptable for families but not a draw, mixed tenant base, ~2y average lease.
- Market conditions: Rents rising fast (+4.3%/yr); 223 active listings in the ZIP; 13 comparable units currently listed for rent nearby; rentals leasing fast (median 10d on market — plan ~1-2 weeks tenant-placement turnaround); high-income renter base; 10,555 units permitted in King County in 2024 (7,119 in 5+ unit buildings).
Forward outlook
- Local home prices are declining (-3.0%/yr); year-one equity from $757 of loan paydown is wiped out by about $3k of value loss. Plan a longer hold.
- King County population projected at +44% by 2050 — long-run rental-demand tailwind backs the buy-and-hold thesis.
- At projected returns (-3.0% appreciation + 4.3% rent growth), your $31k cash investment doubles in ~4 years — after that, you're playing with house money.
Negotiation context
- It's been on market 231 days — a 12% lower offer ($96k) is reasonable based on typical stale-listing flexibility.
- 3 sale attempts since 16y ago; this cycle's ask has dropped $50k (32%) from the opening price — seller is motivated, your offer sets the floor, not the list.
Risks & watch-outs
- Climate carrying-cost: moderate flood risk — expect insurance premiums to compound above CPI over the hold.
Questions for the listing agent
- It's been on market 231 days. Have you received any prior offers? Is the seller open to a 12% concession, seller financing, or rate buy-down credit?
- Why hasn't it sold? Are there any deal-killer items the seller is aware of (foundation, flood, title, zoning, code violations)?
- Is there a deadline driving the sale (1031 exchange, divorce, estate, relocation)? That informs how much negotiation room exists.
- What's the average days-on-market for RENTAL listings here right now (not sales)? A rising rental-DOM trend means longer vacancies and softer asking-rent achievability than the comps imply.
- What's the recent tenant-quality profile in this submarket — average credit score on applications, eviction rate, late-payment / NSF rate, and stable-employment percentage? A property-management company in the area should have these aggregated.
- How much new for-sale + rental construction is in the pipeline within 1–3 miles? Heavy new supply typically softens prices + rents 12–24 months out; constrained supply supports both.
Investment metrics
- 1% rule
- 1.86% ✓
- Cap rate
- 15.66%
- Cash-on-cash
- 33.47%
- DSCR
- 2.49
- GRM
- 4.5
CMA / ARV
- ARV (median comp)
- $91,614
- List price
- $109,495
- Delta
- 19.52%
- Verdict
- OVERPRICED
- Comps
- 20 within 1.0 mi
Show comp detail 3 sales within ~0.75 mi
| Address | Dist | Beds/Ba | Sqft | Sold | Price | $/sf | Match |
|---|---|---|---|---|---|---|---|
| 2150 Oak Ave | 0.56mi | 3/2.0 (+1) | 1,064 (+2%) | 9mo | $150,000 | $141 | 57 |
| 300 Grand Fir Dr | 0.47mi | 3/2.0 (+1) | 1,120 (+8%) | 20mo | $189,999 | $170 | 44 |
| 201 Grand Fir Dr | 0.47mi | 3/2.0 (+1) | 1,188 (+14%) | 14mo | $144,000 | $121 | 38 |
Match score weights: distance 35% · size 25% · config 20% · recency 20%. Top-matched comps best support the ARV.
Projected returns pro-forma
-3.0% appreciation · 4.32% rent growth · sell at horizon
- IRR
- 30.2%
- Equity multiple
- 2.29×
- Total profit
- $39,493
- Equity at exit
- $16,326
- IRR
- 38.2%
- Equity multiple
- 4.79×
- Total profit
- $116,214
- Equity at exit
- $9,467
Cash invested: $30,659 (down + closing). Projections, not guarantees.
Landlord ↔ Tenant lean methodology
- Overall (STATE)
- 28 Tenant-Leaning
- State Washington
- 28 Tenant-Leaning · D+8
- County
- — inherits STATE
- City
- — inherits STATE
ZIP-level market 98022
- Rents YoY
- 4.3%
- Active inventory
- 223
- Price-to-rent
- 4.5×
Monthly cashflow live
- Estimated rent
- $2,040 high interval (Pro) →
- Mortgage (P&I)
- −$574
- Tax est. 1.5%
- −$137 /mo · $1,642/yr
- Insurance
- −$46
- HOA
- −$0
- Vacancy / Maint / Mgmt
- −$428
- Net cashflow
- $855
Break-even live
UW: 25.0% down · 7.5% · 30yr · 1.5% tax · 5.0% vac · 8.0% maint · 8.0% mgmt
Financing live
Cash to close
- Down payment
- $27,374
- Closing costs
- $3,285
- Reserves months
- —
- Total cash needed
- —
Loan-product check · same deal, 3 products live
Conventional
25% down · 7.5% · 30yr
- Down + closing
- —
- Monthly P&I
- —
- Monthly cashflow
- —
- DSCR
- —
- Eligible?
- —
Personal DTI + credit; lowest rate.
DSCR
20% down · 8.5% · 30yr
- Down + closing
- —
- Monthly P&I
- —
- Monthly cashflow
- —
- DSCR
- —
- Eligible?
- —
No personal income docs; deal must DSCR.
Hard money
10% down · 12.0% · 12mo
- Down + closing
- —
- Monthly P&I
- —
- Monthly cashflow
- —
- DSCR
- —
- Eligible?
- —
Short-term bridge; refi at stabilization.
Rent comps 13 comps
| Address | Beds | Baths | Sqft | Rent | $/sqft | DOM | Units | Dist |
|---|---|---|---|---|---|---|---|---|
| 847 Blake St Enumclaw, WA | 3.0 | 1.0 | 1064 | $2,000 | $1.88 | 1d | 1 | 0.17mi |
| 750 Watson St N Enumclaw, WA | 1.0–2.0 | 1.0 | 771 | $1,842 | $2.39 | 1d | 6 | 0.31mi |
| 615 Watson St N Unit 617B Enumclaw, WA | 2.0 | 1.0 | 960 | $1,999 | $2.08 | 1d | 1 | 0.40mi |
| 141 Leos Pl Enumclaw, WA | 2.0 | 1.0 | 850 | $1,850 | $2.18 | 43d | 1 | 0.41mi |
| 141 Leos Pl Enumclaw, WA | 2.0 | 1.0 | 850 | $1,825 | $2.15 | 24d | 1 | 0.41mi |
| 653 Myrtine St Unit A Enumclaw, WA | 2.0 | 1.0 | 850 | $1,895 | $2.23 | 22d | 1 | 0.46mi |
| 556 Bondgard Ave E Enumclaw, WA | 3.0 | 2.0 | 1480 | $2,995 | $2.02 | 10d | 1 | 0.69mi |
| 312 Charwila Ln Enumclaw, WA | 2.0 | 1.0 | 894 | $1,750 | $1.96 | 12d | 1 | 0.76mi |
| 250 Charwila Ln Enumclaw, WA | 2.0 | 1.0 | 894 | $1,750 | $1.96 | 2d | 1 | 0.77mi |
| 2630 Warner Ave Enumclaw, WA | 1.0–2.0 | 1.0 | 762 | $2,000 | $2.62 | 1d | 1 | 0.85mi |
| 1571 Kibler Ave Enumclaw, WA | 3.0 | 2.0 | 1200 | $2,600 | $2.17 | 15d | 1 | 0.94mi |
| 1571 Kibler Ave Enumclaw, WA | 3.0 | 2.0 | 1200 | $2,600 | $2.17 | 20d | 1 | 0.94mi |
| 320 Chinook Ave Enumclaw, WA | 2.0–3.0 | 1.0–2.0 | 923 | $1,890 | $2.05 | 1d | 7 | 0.97mi |
Listing history 26 events
-
2026-06-18days on market $109,495 Active 231 DOM
-
2026-06-17days on market $109,495 Active 230 DOM
-
2026-06-16days on market $109,495 Active 229 DOM
-
2026-06-15price $109,495 Active 228 DOM
-
2026-06-15days on market $119,495 Active 228 DOM
-
2026-06-13days on market $119,495 Active 226 DOM
-
2026-06-09days on market $119,495 Active 222 DOM
-
2026-06-08days on market $119,495 Active 221 DOM
-
2026-06-07days on market $119,495 Active 220 DOM
-
2026-06-04days on market $119,495 Active 217 DOM
-
2026-06-03days on market $119,495 Active 216 DOM
-
2026-06-02days on market $119,495 Active 215 DOM
-
2026-06-01days on market $119,495 Active 214 DOM
-
2026-05-31days on market $119,495 Active 213 DOM
-
2026-04-28price $129,250
-
2026-03-25price $136,495
-
2026-01-29price $144,250
-
2025-12-01price $157,400
-
2025-10-30$159,900 Active
-
2023-05-26soldstatus $142,000 Closed
-
2023-05-10status Pending
-
2023-03-30price $152,999
-
2023-01-29$155,900 Active
-
2010-03-15soldstatus $11,000 Sold
-
2010-03-05status Pending
-
2010-01-04$15,000 Active
ⓘ Source: listings_history table (triggers on properties + properties_extension) + one-shot
backfill from property_details.listing_events for pre-trigger history.
Climate risk First Street
- Flood 5/10 Major FEMA zone X (unshaded) · 66% chance over 30 yrs
- Wildfire 3/10 Moderate
- Heat 2/10 Low 7 d/yr ≥87°F today · 15 d/yr by 30 yrs out
- Wind 1/10 Low
- Air quality 6/10 Major 10 unhealthy d/yr today · 12 by 30 yrs out
Nearby sold comps map
Loading sold comps map…
Walkable amenities ~0.75 mi
Loading nearby amenities…
Taxation est. · year 1
- Rental income
- $24,483
- − Mortgage interest
- −$6,133
- − Property taxes
- −$1,642
- − Insurance
- −$547
- − Repairs & maintenance
- −$1,959
- − Management
- −$1,959
- − Depreciation
- −$3,185
- Taxable income
- $9,057
- Est. tax owed @ 24.0%
- −$2,174
- After-tax cash flow
- $8,087/yr
For passive investors: Depreciation is non-cash, so a rental often shows a tax loss while cash-flowing — sheltering income. Rental losses are passive: they offset passive income freely, and up to $25,000/yr can offset ordinary (W-2) income if you actively participate and your MAGI is under $100k (phasing out to $0 by $150k); unused losses carry forward. On sale, claimed depreciation is recaptured at up to 25%, and gains may owe capital-gains tax (a 1031 exchange can defer both). Figures are a year-1 estimate at your 24.0% rate — not tax advice; consult a CPA.
Schools (NCES district)
- District
- Enumclaw School District
- NCES district ID
- 5300001
- Math proficiency
- 54% ▼ -1.00%
- Reading proficiency
- 68% ▬ 0.00%
- Median HH income
- $68,441
- Composite
- 55.21/100
- National rank
- #2736
- State rank
- #46 of 291 in WA
Livability — Enumclaw
- Score
- 88/100
- State rank
- #12
- US rank
- #222
Category grades
Schools grade is shown separately in the Schools card above.
Census & demographics
- Census place
- Enumclaw, WA
- County
- King County · 2,251,916 people
- City population
- 22,418
- Metro
- Seattle-Tacoma-Bellevue, WA
- Population (ZIP)
- 22,418
- Household income
- $120,406
- Rent vs Own
- Severe rent burden
- 382.0
Population outlook (King County) Hauer SSP2
- Today (2025)
- 2,576,485 people
- By 2030
- 2,803,316 · +8.8%
- By 2040
- 3,255,921 · +26.4%
- By 2050
- 3,706,444 · +43.9%
- By 2075
- 4,746,063 · +84.2%
- By 2100
- 5,407,730 · +109.9%
Race, ethnicity, and origin ACS 2023
- Neighborhood character
- Predominantly White (78%)
- Race & ethnicity
- White 78% Hispanic / Latino 10% Two or more races 9% Asian 2% Native American 2%
- Hispanic origin (detail)
- Mexican 8%
- Common ancestry
- Portuguese 7% Italian 4% Slovak 3%
- Foreign-born
- 6% · Canada
- Languages at home
- 91% English-only · Spanish 6% Other Indo-European 1% German/W. Germanic 1%
Political lean MEDSL · King
- 2024 margin
- Solid D (+51.7) · D 74.2% · R 22.5% · Other 3.4%
- 2008→2024 swing
- +9.6pp toward D · 2008: 42.1pp · 2024: 51.7pp
- All cycles
- 2024: D+51.7 2020: D+52.7 2016: D+50.4 2012: D+39.9 2008: D+42.1
Not yet ingested
- Civics
- —
Market trends
- HPI YoY
- ▼ -605.16%
- Current HPI
- 297.9161
- Rent YoY
- ▲ 4.32%
- Metro
- Seattle-Tacoma-Bellevue, WA
- State GDP YoY
- ▲ 4.65%
- F500 in state
- 22
Industry mix (Fortune 500 HQ in WA)
| Industry | F500 HQs | Revenue |
|---|---|---|
| Retail | 2 | $269B |
|
||
| Technology / Retail | 1 | $638B |
|
||
| Technology | 1 | $245B |
|
||
| Telecommunications | 1 | $38B |
|
||
| Food / Beverage | 1 | $36B |
|
||
| Automotive / Trucks | 1 | $34B |
|
||
Price history
+761.7% since first listed12 events — show timeline
- 2026-04-28 Price Changed $129,250 NWMLS as Distributed by MLS Grid
- 2026-03-25 Price Changed $136,495 NWMLS as Distributed by MLS Grid
- 2026-01-29 Price Changed $144,250 NWMLS as Distributed by MLS Grid
- 2025-12-01 Price Changed $157,400 NWMLS as Distributed by MLS Grid
- 2025-10-30 Listed $159,900 NWMLS as Distributed by MLS Grid
- 2023-05-26 Sold (MLS) $142,000 NWMLS as Distributed by MLS Grid
- 2023-05-10 Pending — NWMLS as Distributed by MLS Grid
- 2023-03-30 Price Changed $152,999 NWMLS as Distributed by MLS Grid
- 2023-01-29 Listed $155,900 NWMLS as Distributed by MLS Grid
- 2010-03-15 Sold (MLS) $11,000 NWMLS as Distributed by MLS Grid
- 2010-03-05 Pending — NWMLS as Distributed by MLS Grid
- 2010-01-04 Listed $15,000 NWMLS as Distributed by MLS Grid
Cash-flow waterfall
monthlySold comps — $/sqft
last 12 mo · ≤1 miLoading sold comps…