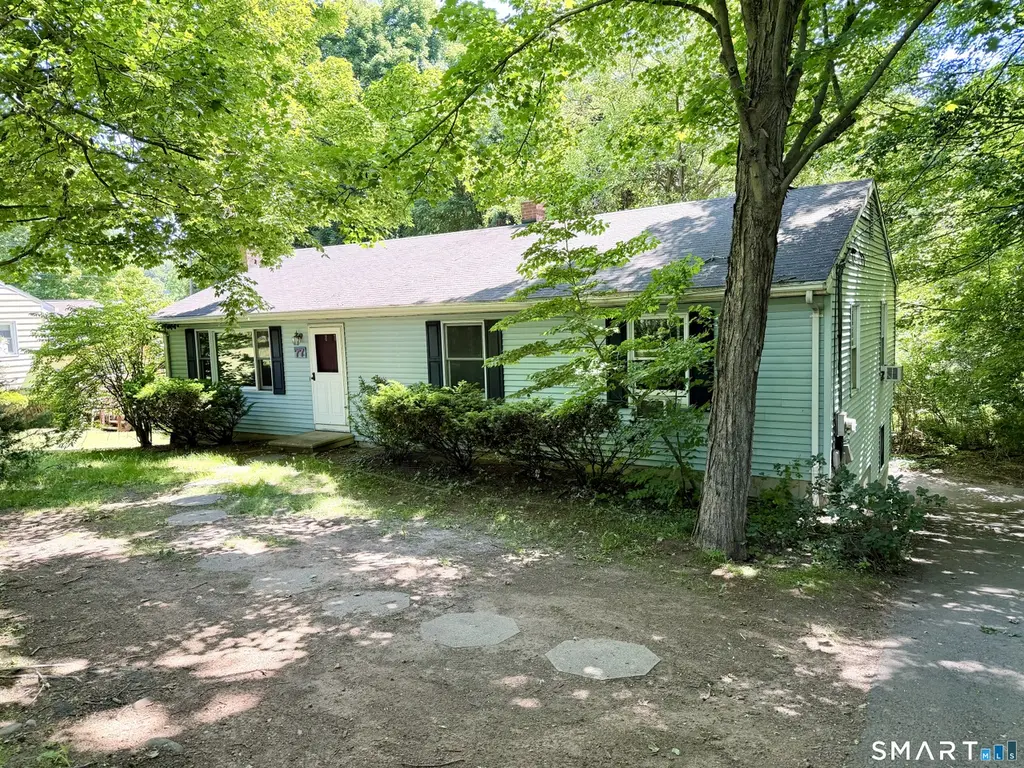
77 Evergreen Ave · Hamden, CT
Flood risk 1/10 · Minimal
- FEMA flood zone
- X (unshaded)
- Chance of flooding over 30 yrs
- 0.0%
- Est. flood insurance / yr
- $473 – $860
Fire risk 1/10 · Minimal
- Est. fire insurance / yr
- $829 – $1,539
Heat risk 6/10 · Moderate
- Hot days now (above 98°F)
- 7 days/yr
- Hot days in 30 yrs
- 17 days/yr
Wind risk 6/10 · Moderate
- Chance of severe wind over 30 yrs
- 27.0%
Air-quality risk 4/10 · Minor
- Unhealthy air days now
- 4 days/yr
- Unhealthy air days in 30 yrs
- 6 days/yr
Risk factors via First Street. Map © Google.
Why this score? — see what drove the D+ grade
The composite is a weighted blend of 9 inputs, each scored 0–100. Each bar is that input's sub-score; the figure is the points it added to the 100-point composite (weight × sub-score).
- ARV discount +15.0/15.0
- Cash flow +12.0/30.0
- 1% rule +4.8/10.0
- DSCR +3.6/10.0
- Schools +3.3/10.0
- Rent growth +2.6/5.0
- Livability +2.5/5.0
- Condition / age +2.5/5.0
- Appreciation +0.0/10.0
$325,000
🖨 Deal sheet 📄 Offer letter ✓ Due diligence
Listing remarks MLS
Fabulous surprise! Better than new near 2000 sf of living space. Updated kit, baths, new carpet. Fr/fp in ll w/office area and full walk out w/patio, deck, well cared for large lot.2 Car att gar w/wkshop. Convenient to hwys, shops, bus. Not a driveby.
Key facts
- Private lot
- Ample cabinetry
- Granite countertops
Tags
Property features AI
Exterior
- Parking: Attached 2-car garage
- Utilities: Public water connected; Public sewer connected; Natural gas hot water
- Home design: Single-family home
- Construction: Built with frame construction; Vinyl siding; Concrete foundation; Asphalt shingle roof; Blue exterior color
- Exterior features: Deck; Patio; Lightly wooded lot
Interior
- Kitchen: Gas range; Microwave; Refrigerator; Dishwasher
- Bedrooms: Three bedrooms
- Bathrooms: Two full bathrooms; One half bathroom
- Heating & cooling: Hot water heating fueled by natural gas; Window unit cooling
- Interior features: Seven total rooms; Full, fully finished basement; Attic with access via hatch; One fireplace; Window air conditioning unit(s)
- Laundry & utility: Washer and dryer (laundry on lower level)
Neighborhood map
What this means for you Summary
Snapshot
- This is a 3-bed/2.5-bath single-family listed at $325k.
Deal economics
- At list price, monthly cash flow is $-76 ($-917/yr) — negative.
- To cash-flow at today's rent, offer at most $312k (4.2% below list).
- To meet the 1% rule (rent ≥ 1% of price), the offer needs to be $318k (2.2% below list).
- Recommended offer: $312k (4.2% below list) — sets the bar for cash-flow.
Location & tenants
- Location reads: area grade D — affects rentability + tenant quality, not the cash-flow math above.
- Hamden School District (suburban): math 30% / reading 43% proficiency, ranked #106 of 153 in CT (top 69%) — families likely to look elsewhere, expect single-tenant / working-renter base with shorter leases.
- Zoned schools: Hamden High School (math 21% / reading 44%, grade F, #125 of 194 statewide, top 66%, 1,672 students, 39% FRL).
- Market conditions: Rents flat; 79 active listings in the ZIP; 8 comparable units currently listed for rent nearby; rentals leasing fast (median 12d on market — plan ~1-2 weeks tenant-placement turnaround); solid renter incomes; 1,059 units permitted in South Central Connecticut Planning Region in 2024 (779 in 5+ unit buildings).
- This rent runs 36% of the median local income ($107k/yr) — at the standard rent-burdened threshold; future hikes will face affordability resistance.
Forward outlook
- Local home prices are declining (-3.0%/yr); year-one equity from $2k of loan paydown is wiped out by about $10k of value loss. Plan a longer hold.
Negotiation context
- Only 9 days on market — expect competitive offers; lowballing is unlikely to land.
- 2 sale attempts since 19y ago with the ask held roughly flat each time — persistent listings suggest the price (not the market) is what's stuck; bring a comps-based counter.
Risks & watch-outs
- Watch-outs: property tax is 2.8% of price.
- Climate carrying-cost: major wind risk, 27% chance of damaging wind over 30y; extreme-heat days projected 7→17/yr by 2055 (HVAC capex compounding) — expect insurance premiums to compound above CPI over the hold.
Questions for the listing agent
- What do current leases actually rent for vs. the listed asking? Can we see a recent rent roll and the last 12 months of T-12 income?
- Property tax is high relative to price — has the assessment been appealed recently, and will the sale trigger a re-assessment?
- Is there a deadline driving the sale (1031 exchange, divorce, estate, relocation)? That informs how much negotiation room exists.
- The area grade is low — what's the realistic commute time and amenity access for the typical tenant pool here? Any planned neighborhood developments (good or bad) we should know about?
- What's the average days-on-market for RENTAL listings here right now (not sales)? A rising rental-DOM trend means longer vacancies and softer asking-rent achievability than the comps imply.
- What's the recent tenant-quality profile in this submarket — average credit score on applications, eviction rate, late-payment / NSF rate, and stable-employment percentage? A property-management company in the area should have these aggregated.
- How much new for-sale + rental construction is in the pipeline within 1–3 miles? Heavy new supply typically softens prices + rents 12–24 months out; constrained supply supports both.
Investment metrics
- 1% rule
- 0.98% ✗
- Cap rate
- 6.01%
- Cash-on-cash
- -1.01%
- DSCR
- 0.96
- GRM
- 8.5
CMA / ARV
- ARV (on-the-fly)
- $492,280
- Comps found
- 12
Show comp detail 12 sales within ~0.75 mi
| Address | Dist | Beds/Ba | Sqft | Sold | Price | $/sf | Match |
|---|---|---|---|---|---|---|---|
| 18 Day Spring Ave | 0.34mi | 3/2.0 | 1,820 (-8%) | 3mo | $437,250 | $240 | 65 |
| 114 Colony St | 0.22mi | 3/1.0 | 1,732 (-13%) | 1mo | $350,000 | $202 | 62 |
| 306 Forest ST EXT | 0.58mi | 3/2.0 | 1,876 (-6%) | 8mo | $465,000 | $248 | 56 |
| 16 Stratton Ct | 0.63mi | 3/2.5 | 1,870 (-6%) | 10mo | $480,000 | $257 | 53 |
| 32 Forest Ct N | 0.68mi | 4/2.5 (+1) | 1,888 (-5%) | 4mo | $351,000 | $186 | 51 |
| 4 Buell St | 0.73mi | 3/2.0 | 1,844 (-7%) | 6mo | $550,000 | $298 | 47 |
| 9 Bromley Ct | 0.60mi | 3/2.0 | 1,841 (-7%) | 13mo | $345,000 | $187 | 47 |
| 25 Stowe Ct | 0.64mi | 4/2.5 (+1) | 1,796 (-10%) | 5mo | $375,000 | $209 | 46 |
| 71 Vista Rd | 0.67mi | 4/2.5 (+1) | 2,198 (+11%) | 2mo | $550,000 | $250 | 44 |
| 51 Carmel St | 0.74mi | 3/2.0 | 1,823 (-8%) | 11mo | $451,500 | $248 | 41 |
| 24 Wiscassett Ave | 0.71mi | 3/3.0 | 1,702 (-14%) | 11mo | $450,000 | $264 | 32 |
| 209 Bayard Ave | 0.75mi | 3/1.5 | 1,696 (-15%) | 13mo | $449,000 | $265 | 26 |
Match score weights: distance 35% · size 25% · config 20% · recency 20%. Top-matched comps best support the ARV.
Projected returns pro-forma
-3.0% appreciation · 0.33% rent growth · sell at horizon
- IRR
- -21.4%
- Equity multiple
- 0.28×
- Total profit
- $-65,590
- Equity at exit
- $48,459
- IRR
- -24.5%
- Equity multiple
- -0.04×
- Total profit
- $-94,693
- Equity at exit
- $28,100
Cash invested: $91,000 (down + closing). Projections, not guarantees.
Landlord ↔ Tenant lean methodology
- Overall (STATE)
- 27 Tenant-Leaning
- State Connecticut
- 27 Tenant-Leaning · D+7
- County
- — inherits STATE
- City
- — inherits STATE
ZIP-level market 06518
- Rents YoY
- 0.3%
- Active inventory
- 79
- Price-to-rent
- 8.5×
Monthly cashflow live
- Estimated rent
- $3,180 high interval (Pro) →
- Mortgage (P&I)
- −$1,704
- Tax from tax record
- −$748 /mo · $8,982/yr
- Insurance
- −$135
- HOA
- −$0
- Vacancy / Maint / Mgmt
- −$668
- Net cashflow
- $-76
Break-even live
UW: 25.0% down · 7.5% · 30yr · 1.5% tax · 5.0% vac · 8.0% maint · 8.0% mgmt
Financing live
Cash to close
- Down payment
- $81,250
- Closing costs
- $9,750
- Reserves months
- —
- Total cash needed
- —
Loan-product check · same deal, 3 products live
Conventional
25% down · 7.5% · 30yr
- Down + closing
- —
- Monthly P&I
- —
- Monthly cashflow
- —
- DSCR
- —
- Eligible?
- —
Personal DTI + credit; lowest rate.
DSCR
20% down · 8.5% · 30yr
- Down + closing
- —
- Monthly P&I
- —
- Monthly cashflow
- —
- DSCR
- —
- Eligible?
- —
No personal income docs; deal must DSCR.
Hard money
10% down · 12.0% · 12mo
- Down + closing
- —
- Monthly P&I
- —
- Monthly cashflow
- —
- DSCR
- —
- Eligible?
- —
Short-term bridge; refi at stabilization.
Rent comps 8 comps
| Address | Beds | Baths | Sqft | Rent | $/sqft | DOM | Units | Dist |
|---|---|---|---|---|---|---|---|---|
| 56 Edgewood Ave Unit 56 Hamden, CT | 2.0 | 1.5 | 1260 | $3,000 | $2.38 | 44d | 1 | 0.41mi |
| 100 Town Walk Dr Hamden, CT | 1.0–3.0 | 1.0–2.0 | 1064 | $3,020 | $2.84 | 3d | 36 | 0.43mi |
| 66 Washington Rd Hamden, CT | 4.0 | 3.0 | 1761 | $3,500 | $1.99 | 3d | 1 | 0.52mi |
| 27 Melrose Ave Hamden, CT | 3.0 | 1.0 | 1822 | $3,500 | $1.92 | 44d | 1 | 0.70mi |
| 65 Buell St North Haven, CT | 3.0 | 1.5 | 1288 | $3,595 | $2.79 | 11d | 1 | 0.81mi |
| 1265 Sherman Ave Hamden, CT | 4.0 | 2.0 | 1378 | $3,400 | $2.47 | 3d | 1 | 0.88mi |
| 9 Canterbury Rd #9 Hamden, CT | 2.0 | 2.0 | 2039 | $4,280 | $2.10 | 3d | 1 | 1.29mi |
| 1400 Hartford Tpke #10 North Haven, CT | 3.0 | 2.0 | 1295 | $2,990 | $2.31 | 44d | 1 | 1.40mi |
Listing history 8 events
-
2026-06-18days on market $325,000 Active 9 DOM
-
2026-06-17days on market $325,000 Active 8 DOM
-
2026-06-16days on market $325,000 Active 7 DOM
-
2026-06-15days on market $325,000 Active 6 DOM
-
2026-06-14days on market $325,000 Active 4 DOM
-
2026-06-13days on market $325,000 Active 3 DOM
-
2026-06-10remarks 699-char remark
-
2026-06-10$325,000 Active 1 DOM
ⓘ Source: listings_history table (triggers on properties + properties_extension) + one-shot
backfill from property_details.listing_events for pre-trigger history.
Tax reassessment forecast CT · Partial reset (capped growth)
- Current annual tax
- $8,982 · $748/mo
- Projected year-2 tax
- $8,982 · $748/mo
- Expected delta
- $0/yr ($0/mo · 0.0%)
ⓘ Screening estimate from a state-policy table — verify with the county assessor before closing.
Climate risk First Street
- Flood 1/10 Low FEMA zone X (unshaded) · 0% chance over 30 yrs
- Wildfire 1/10 Low
- Heat 6/10 Major 7 d/yr ≥98°F today · 17 d/yr by 30 yrs out
- Wind 6/10 Major 27% chance of damaging wind over 30 yrs
- Air quality 4/10 Moderate 4 unhealthy d/yr today · 6 by 30 yrs out
Nearby sold comps map
Loading sold comps map…
Walkable amenities ~0.75 mi
Loading nearby amenities…
Taxation est. · year 1
- Rental income
- $38,155
- − Mortgage interest
- −$18,205
- − Property taxes
- −$8,982
- − Insurance
- −$1,625
- − Repairs & maintenance
- −$3,052
- − Management
- −$3,052
- − Depreciation
- −$9,455
- Taxable loss
- −$6,216
- Est. tax savings @ 24.0%
- +$1,492
- After-tax cash flow
- $575/yr
For passive investors: Depreciation is non-cash, so a rental often shows a tax loss while cash-flowing — sheltering income. Rental losses are passive: they offset passive income freely, and up to $25,000/yr can offset ordinary (W-2) income if you actively participate and your MAGI is under $100k (phasing out to $0 by $150k); unused losses carry forward. On sale, claimed depreciation is recaptured at up to 25%, and gains may owe capital-gains tax (a 1031 exchange can defer both). Figures are a year-1 estimate at your 24.0% rate — not tax advice; consult a CPA.
Schools (NCES district)
- District
- Hamden School District
- NCES district ID
- 0901860
- Math proficiency
- 30% ▼ -13.00%
- Reading proficiency
- 43% ▼ -7.00%
- Median HH income
- $68,821
- Composite
- 33.34/100
- National rank
- #5490
- State rank
- #106 of 153 in CT
Livability — Hamden
No livability data for this city. (Only ~50 U.S. cities are tracked.)
Census & demographics
- County
- New Haven County · 688,236 people
- City population
- 61,150
- Metro
- New Haven-Milford, CT
- Population (ZIP)
- 20,126
- Household income
- $106,692
- Rent vs Own
- Severe rent burden
- 692.0
Population outlook (South Central Connecticut County) Hauer SSP2
- By 2040
- 608,362
Race, ethnicity, and origin ACS 2023
- Neighborhood character
- Predominantly White (68%)
- Race & ethnicity
- White 68% Black 15% Hispanic / Latino 7% Asian 6% Two or more races 5%
- Hispanic origin (detail)
- Puerto Rican 2% Dominican 1%
- Common ancestry
- Romanian 4% Hispanic 2% Scotch-Irish 2%
- Foreign-born
- 12% · Canada, China, Vietnam
- Languages at home
- 86% English-only · Spanish 4% French/Haitian/Cajun 2% Other Indo-European 2%
Political lean MEDSL · South Central Connecticut
- 2024 margin
- Strong D (+20.1) · D 59.0% · R 38.9% · Other 2.1%
- All cycles
- 2024: D+20.1
Not yet ingested
- Civics
- —
Market trends
- HPI YoY
- ▼ -166.95%
- Current HPI
- 227.7908
- Rent YoY
- ▲ 0.33%
- Metro
- New Haven-Milford, CT
- State GDP YoY
- ▲ 1.06%
- F500 in state
- 38
Industry mix (Fortune 500 HQ in CT)
| Industry | F500 HQs | Revenue |
|---|---|---|
| Industrial Machinery | 4 | $38B |
|
||
| Insurance | 3 | $71B |
|
||
| Financial Services | 2 | $25B |
|
||
| Transportation / Logistics | 2 | $18B |
|
||
| Healthcare | 1 | $247B |
|
||
| Telecommunications | 1 | $55B |
|
||
Price history
+12.1% since first listed4 events — show timeline
- 2026-06-09 Listed $325,000 Smart MLS
- 2007-08-29 Sold (Public Records) $297,900 Public Records
- 2007-08-28 Sold (MLS) $297,900 Smart MLS
- 2007-04-11 Listed $289,900 Smart MLS
Property tax history
+2.6%/yrLatest (2023): $8,982 · +1.6% YoY. Source: county tax records.
Cash-flow waterfall
monthlySold comps — $/sqft
last 12 mo · ≤1 miLoading sold comps…