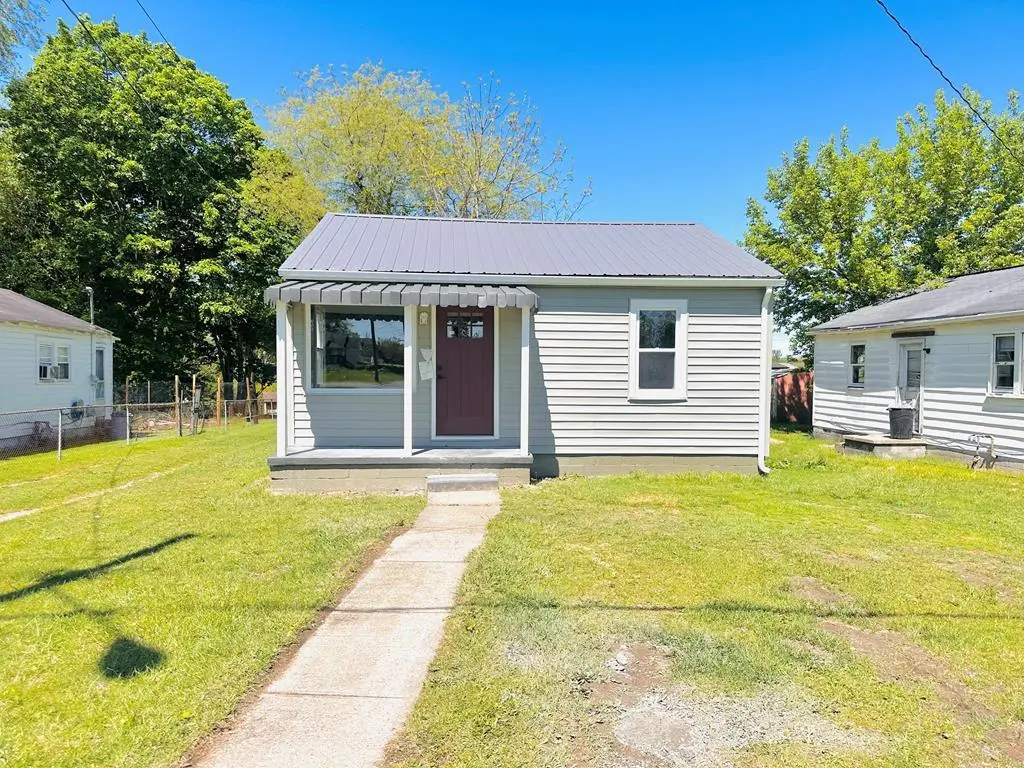
218 Saunders Ave · Beckley, WV
Flood risk 1/10 · Minimal
- FEMA flood zone
- X (unshaded)
- Chance of flooding over 30 yrs
- 0.0%
- Est. flood insurance / yr
- $507 – $1,088
Fire risk 2/10 · Minimal
- Est. fire insurance / yr
- $787 – $1,461
Heat risk 2/10 · Minimal
- Hot days now (above 92°F)
- 7 days/yr
- Hot days in 30 yrs
- 20 days/yr
Wind risk 1/10 · Minimal
- Chance of severe wind over 30 yrs
- —
Air-quality risk 1/10 · Minimal
- Unhealthy air days now
- 0 days/yr
- Unhealthy air days in 30 yrs
- 0 days/yr
Risk factors via First Street. Map © Google.
Why this score? — see what drove the C grade
The composite is a weighted blend of 9 inputs, each scored 0–100. Each bar is that input's sub-score; the figure is the points it added to the 100-point composite (weight × sub-score).
- Cash flow +24.5/30.0
- DSCR +7.9/10.0
- ARV discount +7.5/15.0
- 1% rule +6.3/10.0
- Rent growth +3.6/5.0
- Schools +3.0/10.0
- Livability +3.0/5.0
- Condition / age +2.5/5.0
- Appreciation +0.0/10.0
$89,700
🖨 Deal sheet 📄 Offer letter ✓ Due diligence
Listing remarks
Welcome to this fully renovated 2-bedroom, 1-bath home, ideally located within walking distance to WVU Tech. Thoughtfully updated from top to bottom, this property offers the perfect blend of modern convenience and low-maintenance living. Nearly everything is new—including the roof, siding, windows, hot water heater, drywall, flooring, and fresh paint throughout—providing peace of mind for years to come. The interior features a stylish, updated kitchen with new cabinetry, along with a beautifully remodeled bathroom showcasing contemporary finishes. The home also offers a dedicated laundry area and a functional, efficient layout designed for comfortable everyday living. Outside,
Key facts
- Fully renovated
- Remodeled bathroom
- Updated kitchen
Tags
Property features AI
Exterior
- Parking: Open parking on gravel (no garage)
- Utilities: Public water; Public sewer
- Home design: Residential property; Level topography; Located in Central Addition subdivision
- Construction: Vinyl siding; Metal roof; Crawl space foundation; Built with residential construction materials
- Exterior features: Garden; Landscaped, level lot; Has a view
Interior
- Kitchen: Electric water heater
- Bedrooms: 2 main-level bedrooms
- Flooring: Laminate; Other
- Bathrooms: 1 full bathroom
- Heating & cooling: Natural gas heating; No central cooling
- Interior features: Eat-in kitchen; Garden view
- Laundry & utility: Washer hookup on main level
Neighborhood map
What this means for you Summary
Snapshot
- This is a 2-bed/1.0-bath single-family listed at $90k.
Deal economics
- At list price, monthly cash flow is $183 ($2k/yr) — positive.
- The deal already cash-flows at list — no discount required.
- Meets the 1% rule at list price ($1k rent vs $90k).
- Recommended offer: $87k (3.0% below list) — sets the bar for market timing.
- Cap rate 8.7% vs local median 7.0% in Beckley — meaningfully above typical; check what's discounted (condition, days-on-market, listing class) to confirm the premium yield is real.
Location & tenants
- Location reads 59/100 on livability (#235 in WV) — a working-class tenant base; expect higher turnover. Strengths: cost of living A+, housing A-; Watch: employment D, crime F, amenities F.
- Raleigh County Schools (rural): math 29% / reading 42% proficiency, ranked #14 of 55 in WV (top 26%) — families likely to look elsewhere, expect single-tenant / working-renter base with shorter leases.
- Zoned schools: Beckley Elementary (math 17% / reading 22%, grade F, #350 of 377 statewide, top 95%, 320 students, 0% FRL); Beckley-Stratton Middle School (math 14% / reading 27%, grade F, #102 of 109 statewide, top 94%, 674 students, 0% FRL); Woodrow Wilson High School (math 24% / reading 56%, grade F, #20 of 110 statewide, top 17%, 1,330 students, 0% FRL) — zoned schools average 0% FRL vs 46% district-wide (46 pts lower); this property's tenant base skews higher-income than the district average.
- Market conditions: Rents rising fast (+4.2%/yr); 112 active listings in the ZIP; 41 units permitted in Raleigh County in 2024 (0 in 5+ unit buildings).
Forward outlook
- Local home prices are declining (-3.0%/yr); year-one equity from $620 of loan paydown is wiped out by about $3k of value loss. Plan a longer hold.
- Raleigh County population projected at -16% by 2050 — secular population decline; favor cash flow + early exit over multi-decade hold.
- At projected returns (-3.0% appreciation + 4.2% rent growth), your $25k cash investment doubles in ~10 years — after that, you're playing with house money.
Negotiation context
- It's been on market 48 days — a 3% lower offer ($87k) is reasonable based on typical stale-listing flexibility.
- 2 sale attempts with the ask held roughly flat each time — persistent listings suggest the price (not the market) is what's stuck; bring a comps-based counter.
- Current owner paid $22k; list at $90k implies a 308% gain — meaningful room to come down on a strong offer.
Risks & watch-outs
- Watch-outs: built in 1953 — expect roof / HVAC / electrical / plumbing capex.
Questions for the listing agent
- It's been on market 48 days. Have you received any prior offers? Is the seller open to a 3% concession, seller financing, or rate buy-down credit?
- Built in 1953 — when were the roof, HVAC, electrical panel, plumbing, and water heater last replaced?
- Is there a deadline driving the sale (1031 exchange, divorce, estate, relocation)? That informs how much negotiation room exists.
- Schools are D-rated, which usually means shorter tenancies and higher turnover. Who's the typical renter profile here, and what's been the actual vacancy rate?
- Crime grade is F in this area — have there been break-ins, vandalism, or insurance claims at this property in the last 3 years? What carrier currently insures it and at what premium?
- What's the average days-on-market for RENTAL listings here right now (not sales)? A rising rental-DOM trend means longer vacancies and softer asking-rent achievability than the comps imply.
- What's the recent tenant-quality profile in this submarket — average credit score on applications, eviction rate, late-payment / NSF rate, and stable-employment percentage? A property-management company in the area should have these aggregated.
- How much new for-sale + rental construction is in the pipeline within 1–3 miles? Heavy new supply typically softens prices + rents 12–24 months out; constrained supply supports both.
Investment metrics
- 1% rule
- 1.13% ✓
- Cap rate
- 8.74%
- Cash-on-cash
- 8.75%
- DSCR
- 1.39
- GRM
- 7.4
CMA / ARV
No comps found within radius.
Projected returns pro-forma
-3.0% appreciation · 4.25% rent growth · sell at horizon
- IRR
- -1.6%
- Equity multiple
- 0.94×
- Total profit
- $-1,567
- Equity at exit
- $13,375
- IRR
- 9.4%
- Equity multiple
- 1.76×
- Total profit
- $19,159
- Equity at exit
- $7,756
Cash invested: $25,116 (down + closing). Projections, not guarantees.
Landlord ↔ Tenant lean methodology
- Overall (STATE)
- 83 Strongly Landlord-Friendly
- State West Virginia
- 83 Strongly Landlord-Friendly · R+22
- County
- — inherits STATE
- City
- — inherits STATE
ZIP-level market 25801
- Home prices YoY
- -17.8%
- Rents YoY
- 4.2%
- Active inventory
- 112
- Price-to-rent
- 7.4×
Monthly cashflow live
- Estimated rent
- $1,016 medium interval (Pro) →
- Mortgage (P&I)
- −$470
- Tax est. 1.5%
- −$112 /mo · $1,346/yr
- Insurance
- −$37
- HOA
- −$0
- Vacancy / Maint / Mgmt
- −$213
- Net cashflow
- $183
Break-even live
UW: 25.0% down · 7.5% · 30yr · 1.5% tax · 5.0% vac · 8.0% maint · 8.0% mgmt
Financing live
Cash to close
- Down payment
- $22,425
- Closing costs
- $2,691
- Reserves months
- —
- Total cash needed
- —
Loan-product check · same deal, 3 products live
Conventional
25% down · 7.5% · 30yr
- Down + closing
- —
- Monthly P&I
- —
- Monthly cashflow
- —
- DSCR
- —
- Eligible?
- —
Personal DTI + credit; lowest rate.
DSCR
20% down · 8.5% · 30yr
- Down + closing
- —
- Monthly P&I
- —
- Monthly cashflow
- —
- DSCR
- —
- Eligible?
- —
No personal income docs; deal must DSCR.
Hard money
10% down · 12.0% · 12mo
- Down + closing
- —
- Monthly P&I
- —
- Monthly cashflow
- —
- DSCR
- —
- Eligible?
- —
Short-term bridge; refi at stabilization.
Listing history 18 events
-
2026-06-19days on market $89,700 Active 48 DOM
-
2026-06-18days on market $89,700 Active 47 DOM
-
2026-06-17days on market $89,700 Active 46 DOM
-
2026-06-16days on market $89,700 Active 45 DOM
-
2026-06-15days on market $89,700 Active 44 DOM
-
2026-06-14days on market $89,700 Active 42 DOM
-
2026-06-12days on market $89,700 Active 41 DOM
-
2026-06-09days on market $89,700 Active 38 DOM
-
2026-06-08days on market $89,700 Active 37 DOM
-
2026-06-07days on market $89,700 Active 36 DOM
-
2026-06-03days on market $89,700 Active 32 DOM
-
2026-06-02days on market $89,700 Active 31 DOM
-
2026-06-01days on market $89,700 Active 30 DOM
-
2026-05-31days on market $89,700 Active 29 DOM
-
2026-05-30days on market $89,700 Active 28 DOM
-
2026-05-01$89,700 Active
-
2025-04-16Active
-
2007-03-29soldstatus $22,000
ⓘ Source: listings_history table (triggers on properties + properties_extension) + one-shot
backfill from property_details.listing_events for pre-trigger history.
Climate risk First Street
- Flood 1/10 Low FEMA zone X (unshaded) · 0% chance over 30 yrs
- Wildfire 2/10 Low
- Heat 2/10 Low 7 d/yr ≥92°F today · 20 d/yr by 30 yrs out
- Wind 1/10 Low
- Air quality 1/10 Low 0 unhealthy d/yr today · 0 by 30 yrs out
Nearby sold comps map
Loading sold comps map…
Walkable amenities ~0.75 mi
Loading nearby amenities…
Taxation est. · year 1
- Rental income
- $12,197
- − Mortgage interest
- −$5,025
- − Property taxes
- −$1,346
- − Insurance
- −$448
- − Repairs & maintenance
- −$976
- − Management
- −$976
- − Depreciation
- −$2,609
- Taxable income
- $817
- Est. tax owed @ 24.0%
- −$196
- After-tax cash flow
- $2,001/yr
For passive investors: Depreciation is non-cash, so a rental often shows a tax loss while cash-flowing — sheltering income. Rental losses are passive: they offset passive income freely, and up to $25,000/yr can offset ordinary (W-2) income if you actively participate and your MAGI is under $100k (phasing out to $0 by $150k); unused losses carry forward. On sale, claimed depreciation is recaptured at up to 25%, and gains may owe capital-gains tax (a 1031 exchange can defer both). Figures are a year-1 estimate at your 24.0% rate — not tax advice; consult a CPA.
Schools (NCES district)
- District
- Raleigh County Schools
- NCES district ID
- 5401230
- Math proficiency
- 29% ▼ -8.00%
- Reading proficiency
- 42% ▼ -3.00%
- Median HH income
- $39,828
- Composite
- 29.74/100
- National rank
- #6445
- State rank
- #14 of 55 in WV
Livability — Beckley
- Score
- 59/100
- State rank
- #235
- US rank
- #20551
Category grades
Schools grade is shown separately in the Schools card above.
Census & demographics
- Census place
- Beckley, WV
- County
- Raleigh County · 31,128 people
- City population
- 31,128
- Metro
- Beckley, WV
- Population (ZIP)
- 31,128
- Household income
- $56,836
- Rent vs Own
- Severe rent burden
- 1384.0
Population outlook (Raleigh County) Hauer SSP2
- Today (2025)
- 73,505 people
- By 2030
- 70,954 · -3.5%
- By 2040
- 66,038 · -10.2%
- By 2050
- 61,919 · -15.8%
- By 2075
- 51,954 · -29.3%
- By 2100
- 39,724 · -46.0%
Race, ethnicity, and origin ACS 2023
- Neighborhood character
- Predominantly White (81%)
- Race & ethnicity
- White 81% Black 10% Two or more races 7% Hispanic / Latino 2% Asian 2%
- Common ancestry
- Slovak 2% Italian 1% Lithuanian 1%
- Foreign-born
- 2% · Canada
- Languages at home
- 96% English-only · Spanish 2% Other Indo-European 1%
Political lean MEDSL · Raleigh
- 2024 margin
- Solid R (+54.3) · D 22.0% · R 76.3% · Other 1.6%
- 2008→2024 swing
- -28.5pp toward R · 2008: -25.9pp · 2024: -54.3pp
- All cycles
- 2024: R+54.3 2020: R+50.4 2016: R+52.8 2012: R+44.6 2008: R+25.9
Not yet ingested
- Civics
- —
Market trends
- HPI YoY
- ▼ -45.60%
- Current HPI
- 210.0114
- Rent YoY
- ▲ 4.25%
- Metro
- Beckley, WV
- State GDP YoY
- —
- F500 in state
- 0
Price history
+307.7% since first listed3 events — show timeline
- 2026-05-01 Listed $89,700 BBOR
- 2025-04-16 Listed — BBOR
- 2007-03-29 Sold (Public Records) $22,000 Public Records
Property tax history
-10.3%/yrLatest (2025): $89 · +9.2% YoY. Source: county tax records.
Cash-flow waterfall
monthlySold comps — $/sqft
last 12 mo · ≤1 miLoading sold comps…