6536 Dacite Pl · San Antonio, TX
Flood risk 1/10 · Minimal
- FEMA flood zone
- X (unshaded)
- Chance of flooding over 30 yrs
- 0.0%
- Est. flood insurance / yr
- $507 – $1,088
Fire risk 5/10 · Moderate
- Est. fire insurance / yr
- $1,222 – $2,270
Heat risk 8/10 · Major
- Hot days now (above 109°F)
- 5 days/yr
- Hot days in 30 yrs
- 16 days/yr
Wind risk 8/10 · Major
- Chance of severe wind over 30 yrs
- 80.0%
Air-quality risk 1/10 · Minimal
- Unhealthy air days now
- 0 days/yr
- Unhealthy air days in 30 yrs
- 0 days/yr
Risk factors via First Street. Map © Google.
Why this score? — see what drove the D- grade
The composite is a weighted blend of 9 inputs, each scored 0–100. Each bar is that input's sub-score; the figure is the points it added to the 100-point composite (weight × sub-score).
- Cash flow +10.7/30.0
- Appreciation +4.9/10.0
- Livability +4.0/5.0
- Condition / age +4.0/5.0
- 1% rule +3.1/10.0
- DSCR +3.1/10.0
- Rent growth +2.5/5.0
- Schools +1.9/10.0
- ARV discount +1.1/15.0
$205,999
🖨 Deal sheet (PDF) 📄 Offer letter ✓ Due diligence
Listing remarks
This new home offers a modern and low-maintenance design. An open-concept floorplan with convenient access to a covered patio provides seamless entertaining and multitasking. All three bedrooms are tucked away to the side of the home for improved comfort and convenience, including the luxurious owner's suite with a spa-inspired bathroom and walk-in closet.
Key facts
- Walk-in closet
- Covered patio
- Owner's suite
Tags
Property features AI
Finance
- Financial info: List price $205,999
Exterior
- Parking: 2-car garage (total 2 parking spaces)
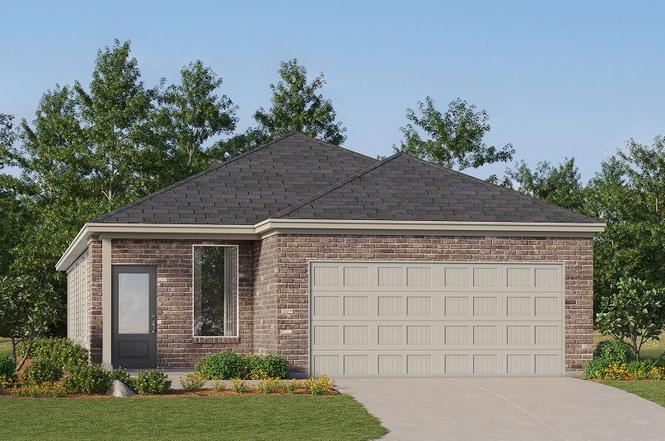
- Home design: Single-family home, Aruba plan; Active listing
- Exterior features: Address: 6536 Dacite Pl, Elmendorf, TX 78112
Interior
- Bedrooms: 3 bedrooms
- Bathrooms: 2 full bathrooms
- Interior features: Spec new construction (Aruba plan); Living area approximately 1502
Neighborhood map
What this means for you Summary
Snapshot
- This is a 3-bed/2.0-bath single-family listed at $206k. Condition is rated good.
Deal economics
- At list price, monthly cash flow is $-98 ($-1k/yr) — negative.
- To cash-flow at today's rent, offer at most $192k (6.9% below list).
- To meet the 1% rule (rent ≥ 1% of price), the offer needs to be $168k (18.6% below list).
- Recommended offer: $168k (18.6% below list) — sets the bar for 1% rule.
- Cap rate 5.7% vs local median 3.8% in San Antonio — top-decile yield for the area; either an underpriced asset or a hidden risk that comps aren't pricing in. Stress-test before assuming the spread holds.
Location & tenants
- Location reads 80/100 on livability (#31 in TX, #1,616 nationally) — a professional / high-income tenant draw. Strengths: amenities A+, commute A+, cost of living A+; Watch: crime F.
- East Central ISD (rural): math 16% / reading 25% proficiency, ranked #758 of 826 in TX (top 92%) — low school quality limits family demand, transient renter base, plan for 1-2y turnover; 61% free/reduced lunch — lower-income household profile, screen leases tightly.
- Zoned schools: Harmony El (math 21% / reading 17%, grade F, #3,739 of 4,322 statewide, top 87%, 684 students, 75% FRL); East Central Heritage Middle (math 11% / reading 26%, grade F, #1,478 of 1,662 statewide, top 90%, 1,120 students, 44% FRL); East Central H S (math 21% / reading 28%, grade F, #1,264 of 1,632 statewide, top 82%, 3,252 students, 52% FRL) — zoned schools at 57% FRL track the district average.
- Market conditions: 451 active listings in the ZIP; 8 comparable units currently listed for rent nearby; rentals leasing fast (median 7d on market — plan ~1-2 weeks tenant-placement turnaround); 8,308 units permitted in Bexar County in 2024 (2,506 in 5+ unit buildings).
Forward outlook
- In year one you build about $1k of equity ($1k loan paydown + $-340 appreciation (-0.2% local appreciation)).
- Bexar County population projected at +50% by 2050 — long-run rental-demand tailwind backs the buy-and-hold thesis.
Negotiation context
- Only 11 days on market — expect competitive offers; lowballing is unlikely to land.
Risks & watch-outs
- Climate carrying-cost: severe wind risk, 80% chance of damaging wind over 30y; moderate wildfire risk; extreme-heat days projected 5→16/yr by 2055 (HVAC capex compounding) — expect insurance premiums to compound above CPI over the hold.
Questions for the listing agent
- What do current leases actually rent for vs. the listed asking? Can we see a recent rent roll and the last 12 months of T-12 income?
- Is there a deadline driving the sale (1031 exchange, divorce, estate, relocation)? That informs how much negotiation room exists.
- Crime grade is F in this area — have there been break-ins, vandalism, or insurance claims at this property in the last 3 years? What carrier currently insures it and at what premium?
- The area grade is low — what's the realistic commute time and amenity access for the typical tenant pool here? Any planned neighborhood developments (good or bad) we should know about?
- What's the average days-on-market for RENTAL listings here right now (not sales)? A rising rental-DOM trend means longer vacancies and softer asking-rent achievability than the comps imply.
- What's the recent tenant-quality profile in this submarket — average credit score on applications, eviction rate, late-payment / NSF rate, and stable-employment percentage? A property-management company in the area should have these aggregated.
- How much new for-sale + rental construction is in the pipeline within 1–3 miles? Heavy new supply typically softens prices + rents 12–24 months out; constrained supply supports both.
Investment metrics
- 1% rule
- 0.81% ✗
- Cap rate
- 5.72%
- Cash-on-cash
- -2.05%
- DSCR
- 0.91
- GRM
- 10.2
CMA / ARV
- ARV (on-the-fly)
- $180,240
- Comps found
- 12
Show comp detail 12 sales within ~0.75 mi
| Address | Dist | Beds/Ba | Sqft | Sold | Price | $/sf | Match |
|---|---|---|---|---|---|---|---|
| 14805 Mudstone Pl | 0.11mi | 4/2.0 (+1) | 1,483 (-1%) | 1mo | $177,999 | $120 | 87 |
| 14809 Granite Gdn | 0.03mi | 3/2.0 | 1,650 (+10%) | 1mo | $221,999 | $135 | 81 |
| 15103 Azzurro Stone | 0.31mi | 4/2.0 (+1) | 1,483 (-1%) | 1mo | $177,999 | $120 | 78 |
| 15106 Azzurro Stone | 0.19mi | 4/2.0 (+1) | 1,575 (+5%) | 1mo | $196,999 | $125 | 77 |
| 6630 Fiore Gdn | 0.16mi | 3/2.0 | 1,354 (-10%) | 1mo | $188,999 | $140 | 76 |
| 15028 Azzurro Stone | 0.19mi | 4/2.0 (+1) | 1,600 (+6%) | 0mo | $197,999 | $124 | 75 |
| 6729 Marble Rdg | 0.21mi | 3/2.5 | 1,360 (-10%) | 0mo | $140,999 | $104 | 72 |
| 6808 Marble Rdg | 0.26mi | 3/2.5 | 1,360 (-10%) | 1mo | $143,999 | $106 | 69 |
| 6844 Marble Rdg | 0.27mi | 3/2.5 | 1,360 (-10%) | 0mo | $139,999 | $103 | 69 |
| 6820 Marble Rdg | 0.26mi | 3/2.5 | 1,360 (-10%) | 2mo | $146,999 | $108 | 68 |
| 15111 Azzurro Stone | 0.31mi | 4/2.0 (+1) | 1,692 (+13%) | 1mo | $195,999 | $116 | 59 |
| 15027 Azzurro Stone | 0.31mi | 4/2.0 (+1) | 1,692 (+13%) | 2mo | $180,999 | $107 | 58 |
Match score weights: distance 35% · size 25% · config 20% · recency 20%. Top-matched comps best support the ARV.
Projected returns pro-forma
-0.17% appreciation · 3.0% rent growth · sell at horizon
- IRR
- -5.2%
- Equity multiple
- 0.76×
- Total profit
- $-13,860
- Equity at exit
- $58,120
- IRR
- 0.9%
- Equity multiple
- 1.09×
- Total profit
- $5,205
- Equity at exit
- $68,523
Cash invested: $57,680 (down + closing). Projections, not guarantees.
Landlord ↔ Tenant lean methodology
- Overall (STATE)
- 87 Strongly Landlord-Friendly
- State Texas
- 87 Strongly Landlord-Friendly · R+5
- County
- — inherits STATE
- City
- — inherits STATE
ZIP-level market 78112
- Home prices YoY
- -0.1%
- Active inventory
- 451
- Price-to-rent
- 10.2×
Monthly cashflow live
- Estimated rent
- $1,678 high interval (Pro) →
- Mortgage (P&I)
- −$1,080
- Tax est. 1.5%
- −$257 /mo · $3,090/yr
- Insurance
- −$86
- HOA
- −$0
- Vacancy / Maint / Mgmt
- −$352
- Net cashflow
- $-98
Break-even live
Sensitivity live
| Price | -10% $44 | -5% $-27 | +0% $-98 | +5% $-170 | +10% $-241 |
|---|---|---|---|---|---|
| Rent | -10% $-231 | -5% $-165 | +0% $-98 | +5% $-32 | +10% $34 |
| Rate | -1.0pp $5 | -0.5pp $-46 | base $-98 | +0.5pp $-152 | +1.0pp $-206 |
UW: 25.0% down · 7.5% · 30yr · 1.5% tax · 5.0% vac · 8.0% maint · 8.0% mgmt
Financing live
Cash to close
- Down payment
- $51,500
- Closing costs
- $6,180
- Reserves months
- —
- Total cash needed
- —
Loan-product check · same deal, 3 products live
Conventional
25% down · 7.5% · 30yr
- Down + closing
- —
- Monthly P&I
- —
- Monthly cashflow
- —
- DSCR
- —
- Eligible?
- —
Personal DTI + credit; lowest rate.
DSCR
20% down · 8.5% · 30yr
- Down + closing
- —
- Monthly P&I
- —
- Monthly cashflow
- —
- DSCR
- —
- Eligible?
- —
No personal income docs; deal must DSCR.
Hard money
10% down · 12.0% · 12mo
- Down + closing
- —
- Monthly P&I
- —
- Monthly cashflow
- —
- DSCR
- —
- Eligible?
- —
Short-term bridge; refi at stabilization.
Rent comps 8 comps
| Address | Beds | Baths | Sqft | Rent | $/sqft | DOM | Units | Dist |
|---|---|---|---|---|---|---|---|---|
| 6941 Dorato Rdg San Antonio, TX | 4.0 | 2.5 | 1952 | $1,750 | $0.90 | 6d | 1 | 0.41mi |
| 6933 Biotite Rdg San Antonio, TX | 3.0 | 2.0 | 1125 | $1,650 | $1.47 | 12d | 1 | 0.41mi |
| 6933 Calcite Trl San Antonio, TX | 4.0 | 2.0 | 1606 | $1,695 | $1.06 | 14d | 1 | 0.41mi |
| 6948 Calcite Trl San Antonio, TX | 3.0 | 2.0 | 1440 | $1,600 | $1.11 | 0d | 1 | 0.46mi |
| 14606 Hackamore Way Elmendorf, TX | 4.0 | 2.0 | 1696 | $1,700 | $1.00 | 0d | 1 | 1.13mi |
| 14606 Hackamore Way Elmendorf, TX | 4.0 | 2.0 | 1699 | $1,700 | $1.00 | 17d | 1 | 1.13mi |
| 14651 Latigo Loop Elmendorf, TX | 4.0 | 2.0 | 1696 | $1,750 | $1.03 | 0d | 1 | 1.24mi |
| 7663 Stud Dr Elmendorf, TX | 3.0 | 2.0 | 1233 | $1,600 | $1.30 | 0d | 1 | 1.26mi |
Listing history 7 events
-
2026-06-21days on market $205,999 Active 11 DOM
-
2026-06-18days on market $205,999 Active 8 DOM
-
2026-06-17days on market $205,999 Active 7 DOM
-
2026-06-16days on market $205,999 Active 6 DOM
-
2026-06-15days on market $205,999 Active 5 DOM
-
2026-06-13remarks 358-char remark
-
2026-06-13$205,999 Active 3 DOM
ⓘ Source: listings_history table (triggers on properties + properties_extension) + one-shot
backfill from property_details.listing_events for pre-trigger history.
Climate risk First Street
- Flood 1/10 Low FEMA zone X (unshaded) · 0% chance over 30 yrs
- Wildfire 5/10 Major
- Heat 8/10 Severe 5 d/yr ≥109°F today · 16 d/yr by 30 yrs out
- Wind 8/10 Severe 80% chance of damaging wind over 30 yrs
- Air quality 1/10 Low 0 unhealthy d/yr today · 0 by 30 yrs out
Nearby sold comps map
Loading sold comps map…
Walkable amenities ~0.75 mi
Loading nearby amenities…
Taxation est. · year 1
- Rental income
- $20,130
- − Mortgage interest
- −$11,539
- − Property taxes
- −$3,090
- − Insurance
- −$1,030
- − Repairs & maintenance
- −$1,610
- − Management
- −$1,610
- − Depreciation
- −$5,993
- Taxable loss
- −$4,742
- Est. tax savings @ 24.0%
- +$1,138
- After-tax cash flow
- $-42/yr
For passive investors: Depreciation is non-cash, so a rental often shows a tax loss while cash-flowing — sheltering income. Rental losses are passive: they offset passive income freely, and up to $25,000/yr can offset ordinary (W-2) income if you actively participate and your MAGI is under $100k (phasing out to $0 by $150k); unused losses carry forward. On sale, claimed depreciation is recaptured at up to 25%, and gains may owe capital-gains tax (a 1031 exchange can defer both). Figures are a year-1 estimate at your 24.0% rate — not tax advice; consult a CPA.
Condition & rehab AI · 13 photos
This modern single-family home offers a good condition with a good condition score of 80. It is move-in ready with a good roof, exterior, and interior condition. The home has a good foundation and structure, and the HVAC system appears to be in good condition. The home has a good curb appeal with a well-maintained lawn and landscaping. The kitchen and bathrooms are modern and well-maintained. The home has a good condition score of 80 and is in good condition. The home is move-in ready with a good roof, exterior, and interior condition. The home has a good foundation and structure, and the HVAC system appears to be in good condition. The home has a good curb appeal with a well-maintained lawn and landscaping. The home has a good condition score of 80 and is in good condition.
Value-add opportunities
- Both Painting the exterior brick — Enhances curb appeal and can increase both resale and rental value
- Both Updating the kitchen backsplash — Modernizes the kitchen and can increase both resale and rental value
- Both Adding a smart home system — Improves convenience and can increase both resale and rental value
Renovation cost estimate screening
Value-add ROI direction
- Both Painting the exterior brick — Enhances curb appeal and can increase both resale and rental value ↑
- Both Updating the kitchen backsplash — Modernizes the kitchen and can increase both resale and rental value ↑
- Both Adding a smart home system — Improves convenience and can increase both resale and rental value ↑
ⓘ Cost ranges are severity-bucket heuristics (US national rule-of-thumb). Get contractor quotes + a written scope before underwriting a rehab budget.
Schools (NCES district)
- District
- East Central ISD
- NCES district ID
- 4817850
- Math proficiency
- 16% ▼ -12.00%
- Reading proficiency
- 25% ▼ -6.00%
- Median HH income
- $53,941
- Composite
- 18.67/100
- National rank
- #8887
- State rank
- #758 of 826 in TX
Livability — San Antonio
- Score
- 80/100
- State rank
- #31
- US rank
- #1616
Category grades
Schools grade is shown separately in the Schools card above.
Census & demographics
- City population
- 1,806,925
- Population (ZIP)
- 9,959
Population outlook (Bexar County) Hauer SSP2
- Today (2025)
- 2,336,851 people
- By 2030
- 2,560,728 · +9.6%
- By 2040
- 3,020,569 · +29.3%
- By 2050
- 3,493,522 · +49.5%
- By 2075
- 4,668,459 · +99.8%
- By 2100
- 5,533,242 · +136.8%
Race, ethnicity, and origin ACS 2023
- Neighborhood character
- Predominantly Hispanic (72%)
- Race & ethnicity
- Hispanic / Latino 72% Two or more races 39% White 24% Asian 1%
- Hispanic origin (detail)
- Mexican 64%
- Common ancestry
- Lithuanian 1%
- Foreign-born
- 14% · Canada
- Languages at home
- 57% English-only · Spanish 42% Tagalog/Filipino 1%
Political lean MEDSL · Bexar
- 2024 margin
- Lean D (+9.8) · D 54.3% · R 44.6% · Other 1.1%
- 2008→2024 swing
- +4.2pp toward D · 2008: 5.6pp · 2024: 9.8pp
- All cycles
- 2024: D+9.8 2020: D+18.2 2016: D+13.5 2012: D+4.6 2008: D+5.6
Not yet ingested
- Civics
- —
Market trends
- HPI YoY
- ▼ -0.17%
- Current HPI
- 276.3302
- Rent YoY
- —
- Metro
- —
- State GDP YoY
- ▲ 3.95%
- F500 in state
- 110
Industry mix (Fortune 500 HQ in TX)
| Industry | F500 HQs | Revenue |
|---|---|---|
| Energy | 16 | $1,198B |
|
||
| Technology | 5 | $198B |
|
||
| Engineering / Construction | 4 | $72B |
|
||
| Energy Services | 3 | $60B |
|
||
| Utilities | 3 | $41B |
|
||
| Healthcare | 2 | $330B |
|
||
Cash-flow waterfall
monthlySold comps — $/sqft
last 12 mo · ≤1 miLoading sold comps…