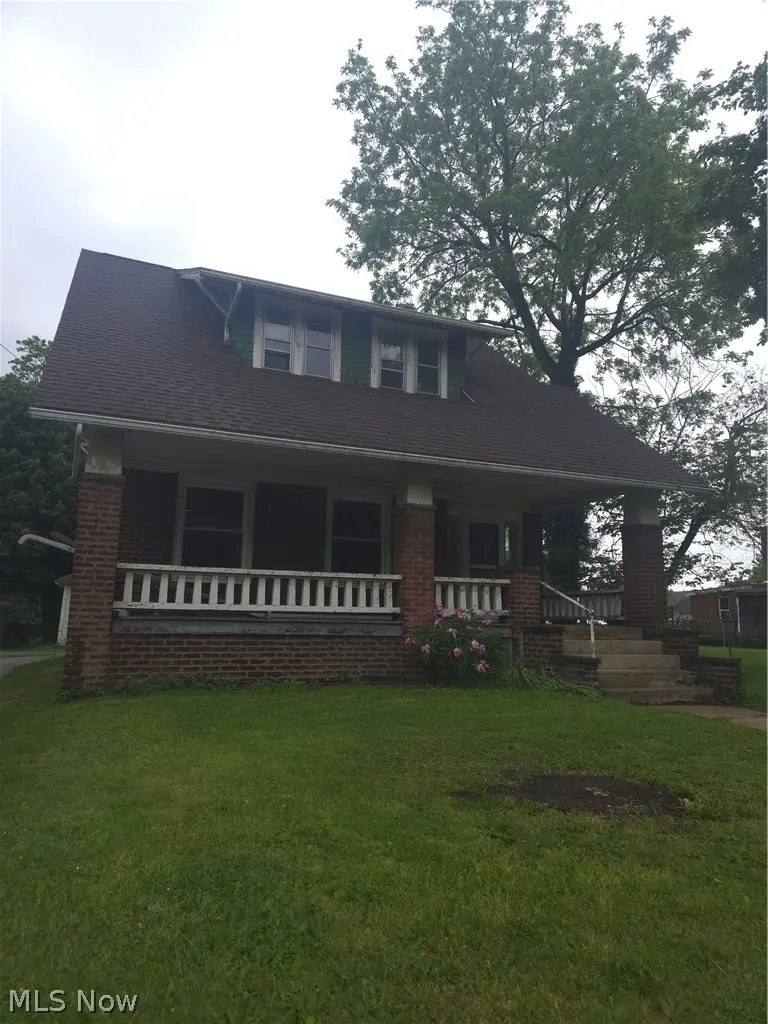
105 W Ely St · Alliance, OH
Flood risk 1/10 · Minimal
- FEMA flood zone
- X (unshaded)
- Chance of flooding over 30 yrs
- 0.0%
- Est. flood insurance / yr
- $507 – $1,088
Fire risk 1/10 · Minimal
- Est. fire insurance / yr
- $713 – $1,323
Heat risk 3/10 · Minor
- Hot days now (above 97°F)
- 7 days/yr
- Hot days in 30 yrs
- 17 days/yr
Wind risk 1/10 · Minimal
- Chance of severe wind over 30 yrs
- —
Air-quality risk 2/10 · Minimal
- Unhealthy air days now
- 1 days/yr
- Unhealthy air days in 30 yrs
- 2 days/yr
Risk factors via First Street. Map © Google.
Why this score? — see what drove the B+ grade
The composite is a weighted blend of 9 inputs, each scored 0–100. Each bar is that input's sub-score; the figure is the points it added to the 100-point composite (weight × sub-score).
- Cash flow +30.0/30.0
- ARV discount +15.0/15.0
- DSCR +10.0/10.0
- 1% rule +9.7/10.0
- Livability +3.9/5.0
- Schools +3.5/10.0
- Rent growth +2.5/5.0
- Condition / age +2.5/5.0
- Appreciation +0.0/10.0
$84,000
🖨 Deal sheet (PDF) 📄 Offer letter ✓ Due diligence
Listing remarks
Investors! 3-bedroom, 2-bath home offering over 1,400 square feet of living space in the heart of Alliance. Built with character and timeless appeal, this property features spacious living areas, a fireplace, detached garage, and a generously sized lot perfect for outdoor enjoyment. Conveniently located near schools, parks, shopping, and local amenities, this home offers a great opportunity for homeowners or investors alike. With solid bones and plenty of potential, this property is ready for your personal touch.
Key facts
- Generously sized lot
- Fireplace
- Detached garage
Tags
Property features AI
Exterior
- Parking: Detached garage with 1 parking space; Shared driveway
- Utilities: Public water service; Public sewer service
- Home design: Two-story home; Brick construction; Asphalt/fiberglass roof
- Construction: Brick construction; Asphalt/fiberglass roof
- Exterior features: Public water; Public sewer
Interior
- Bedrooms: Bedrooms on multiple levels
- Bathrooms: Two full bathrooms; One bathroom on the main level
- Heating & cooling: Gas heating
- Interior features: Unfinished basement; One fireplace
Neighborhood map
What this means for you Summary
Snapshot
- This is a 3-bed/2.0-bath single-family listed at $84k.
Deal economics
- At list price, monthly cash flow is $399 ($5k/yr) — positive.
- The deal already cash-flows at list — no discount required.
- Meets the 1% rule at list price ($1k rent vs $84k).
- Recommended offer: $83k (1.5% below list) — sets the bar for market timing.
- Cap rate 12.0% vs local median 4.8% in Alliance — top-decile yield for the area; either an underpriced asset or a hidden risk that comps aren't pricing in. Stress-test before assuming the spread holds.
Location & tenants
- Location reads 78/100 on livability (#175 in OH, #2,737 nationally) — a middle-class / working-renter tenant base. Strengths: commute A+, cost of living A+, housing A+; Watch: amenities F, employment F.
- Alliance City (town): math 39% / reading 45% proficiency, ranked #536 of 656 in OH (top 82%) — families likely to look elsewhere, expect single-tenant / working-renter base with shorter leases; 71% free/reduced lunch — lower-income household profile, screen leases tightly.
- Zoned schools: Alliance Early Learning School (624 students, 0% FRL); Alliance Middle School (math 33% / reading 40%, grade F, #539 of 654 statewide, top 83%, 602 students, 0% FRL); Alliance High School (math 22% / reading 45%, grade F, #598 of 781 statewide, top 77%, 973 students, 0% FRL) — zoned schools average 0% FRL vs 71% district-wide (71 pts lower); this property's tenant base skews higher-income than the district average.
- Market conditions: 168 active listings in the ZIP; 3 comparable units currently listed for rent nearby; rentals at typical pace (median 15d on market — plan ~3-4 weeks tenant-placement turnaround); 528 units permitted in Stark County in 2024 (84 in 5+ unit buildings).
Forward outlook
- Local home prices are declining (-3.0%/yr); year-one equity from $581 of loan paydown is wiped out by about $3k of value loss. Plan a longer hold.
- Stark County population projected to shrink 8% by 2050 — rents likely to lag national; underwrite the cash flow, not the appreciation.
- At projected returns (-3.0% appreciation + 3.0% rent growth), your $24k cash investment doubles in ~6 years — after that, you're playing with house money.
Negotiation context
- It's been on market 30 days — a 2% lower offer ($83k) is reasonable based on typical stale-listing flexibility.
Risks & watch-outs
- Watch-outs: built in 1916 — expect roof / HVAC / electrical / plumbing capex.
Questions for the listing agent
- Built in 1916 — when were the roof, HVAC, electrical panel, plumbing, and water heater last replaced?
- Is there a deadline driving the sale (1031 exchange, divorce, estate, relocation)? That informs how much negotiation room exists.
- Schools are B-rated — typically a magnet for longer-tenancy family renters. What's the average tenant stay here, and is there a school-zone premium baked into asking?
- What's the average days-on-market for RENTAL listings here right now (not sales)? A rising rental-DOM trend means longer vacancies and softer asking-rent achievability than the comps imply.
- What's the recent tenant-quality profile in this submarket — average credit score on applications, eviction rate, late-payment / NSF rate, and stable-employment percentage? A property-management company in the area should have these aggregated.
- How much new for-sale + rental construction is in the pipeline within 1–3 miles? Heavy new supply typically softens prices + rents 12–24 months out; constrained supply supports both.
Investment metrics
- 1% rule
- 1.47% ✓
- Cap rate
- 11.99%
- Cash-on-cash
- 20.35%
- DSCR
- 1.91
- GRM
- 5.7
CMA / ARV
- ARV (on-the-fly)
- $140,900
- Comps found
- 12
Show comp detail 12 sales within ~0.75 mi
| Address | Dist | Beds/Ba | Sqft | Sold | Price | $/sf | Match |
|---|---|---|---|---|---|---|---|
| 260 W Wayne St | 0.22mi | 3/1.0 | 1,446 (+3%) | 6mo | $144,900 | $100 | 77 |
| 174 W Wayne St | 0.19mi | 3/1.0 | 1,344 (-5%) | 5mo | $105,000 | $78 | 75 |
| 838 Walnut Ave | 0.46mi | 3/2.0 | 1,460 (+4%) | 4mo | $150,000 | $103 | 68 |
| 228 W Oxford St | 0.52mi | 3/1.0 | 1,380 (-2%) | 2mo | $70,000 | $51 | 66 |
| 124 E Wayne St | 0.27mi | 3/2.0 | 1,248 (-11%) | 7mo | $133,000 | $107 | 62 |
| 290 W Broadway St | 0.44mi | 3/2.0 | 1,302 (-8%) | 6mo | $140,000 | $108 | 62 |
| 621 S Haines Ave | 0.58mi | 3/1.0 | 1,456 (+3%) | 2mo | $70,000 | $48 | 61 |
| 430 W Oxford St | 0.59mi | 3/1.0 | 1,472 (+4%) | 0mo | $136,000 | $92 | 60 |
| 170 W Cambridge St | 0.56mi | 3/2.0 | 1,280 (-9%) | 2mo | $145,000 | $113 | 57 |
| 345 W Broadway St | 0.45mi | 3/1.5 | 1,248 (-11%) | 7mo | $120,000 | $96 | 52 |
| 69 E Grant St | 0.75mi | 3/2.0 | 1,492 (+6%) | 5mo | $159,000 | $107 | 51 |
| 140 W Summit St | 0.65mi | 3/1.5 | 1,540 (+9%) | 5mo | $65,000 | $42 | 48 |
Match score weights: distance 35% · size 25% · config 20% · recency 20%. Top-matched comps best support the ARV.
Projected returns pro-forma
-3.0% appreciation · 3.0% rent growth · sell at horizon
- IRR
- 12.6%
- Equity multiple
- 1.50×
- Total profit
- $11,804
- Equity at exit
- $12,525
- IRR
- 21.5%
- Equity multiple
- 2.83×
- Total profit
- $43,053
- Equity at exit
- $7,263
Cash invested: $23,520 (down + closing). Projections, not guarantees.
Landlord ↔ Tenant lean methodology
- Overall (STATE)
- 73 Landlord-Friendly
- State Ohio
- 73 Landlord-Friendly · R+6
- County
- — inherits STATE
- City
- — inherits STATE
ZIP-level market 44601
- Active inventory
- 168
- Price-to-rent
- 5.7×
Monthly cashflow live
- Estimated rent
- $1,237 medium interval (Pro) →
- Mortgage (P&I)
- −$441
- Tax from tax record
- −$103 /mo · $1,232/yr
- Insurance
- −$35
- HOA
- −$0
- Vacancy / Maint / Mgmt
- −$260
- Net cashflow
- $399
Break-even live
Sensitivity live
| Price | -10% $446 | -5% $423 | +0% $399 | +5% $375 | +10% $351 |
|---|---|---|---|---|---|
| Rent | -10% $301 | -5% $350 | +0% $399 | +5% $448 | +10% $496 |
| Rate | -1.0pp $441 | -0.5pp $420 | base $399 | +0.5pp $377 | +1.0pp $355 |
UW: 25.0% down · 7.5% · 30yr · 1.5% tax · 5.0% vac · 8.0% maint · 8.0% mgmt
Financing live
Cash to close
- Down payment
- $21,000
- Closing costs
- $2,520
- Reserves months
- —
- Total cash needed
- —
Loan-product check · same deal, 3 products live
Conventional
25% down · 7.5% · 30yr
- Down + closing
- —
- Monthly P&I
- —
- Monthly cashflow
- —
- DSCR
- —
- Eligible?
- —
Personal DTI + credit; lowest rate.
DSCR
20% down · 8.5% · 30yr
- Down + closing
- —
- Monthly P&I
- —
- Monthly cashflow
- —
- DSCR
- —
- Eligible?
- —
No personal income docs; deal must DSCR.
Hard money
10% down · 12.0% · 12mo
- Down + closing
- —
- Monthly P&I
- —
- Monthly cashflow
- —
- DSCR
- —
- Eligible?
- —
Short-term bridge; refi at stabilization.
Rent comps 3 comps
| Address | Beds | Baths | Sqft | Rent | $/sqft | DOM | Units | Dist |
|---|---|---|---|---|---|---|---|---|
| 109 W Ely St Alliance, OH | 3.0 | 1.0 | 1344 | $1,300 | $0.97 | 15d | 1 | 0.05mi |
| 1329 Auld St Alliance, OH | 2.0 | 2.0 | 900 | $895 | $0.99 | 15d | 1 | 1.41mi |
| 1329 Auld St Unit 1329 Alliance, OH | 2.0 | 2.0 | 900 | $925 | $1.03 | 15d | 1 | 1.41mi |
Listing history 18 events
-
2026-06-22days on market $84,000 Active 30 DOM
-
2026-06-18days on market $84,000 Active 27 DOM
-
2026-06-17days on market $84,000 Active 26 DOM
-
2026-06-16days on market $84,000 Active 25 DOM
-
2026-06-15days on market $84,000 Active 24 DOM
-
2026-06-14days on market $84,000 Active 22 DOM
-
2026-06-13days on market $84,000 Active 21 DOM
-
2026-06-10pricedays on market $84,000 Active 19 DOM
-
2026-06-09days on market $90,000 Active 18 DOM
-
2026-06-08days on market $90,000 Active 17 DOM
-
2026-06-07days on market $90,000 Active 16 DOM
-
2026-06-03price $90,000 Active 11 DOM
-
2026-06-02days on market $100,000 Active 11 DOM
-
2026-06-01days on market $100,000 Active 10 DOM
-
2026-05-31days on market $100,000 Active 9 DOM
-
2026-05-30days on market $100,000 Active 8 DOM
-
2026-05-22$100,000 Active
-
2005-07-13soldstatus $82,000
ⓘ Source: listings_history table (triggers on properties + properties_extension) + one-shot
backfill from property_details.listing_events for pre-trigger history.
Tax reassessment forecast OH · Partial reset (capped growth)
- Current annual tax
- $1,232 · $103/mo
- Projected year-2 tax
- $1,271 · $106/mo
- Expected delta
- +$39/yr (+$3/mo · 3.2%)
ⓘ Screening estimate from a state-policy table — verify with the county assessor before closing.
Climate risk First Street
- Flood 1/10 Low FEMA zone X (unshaded) · 0% chance over 30 yrs
- Wildfire 1/10 Low
- Heat 3/10 Moderate 7 d/yr ≥97°F today · 17 d/yr by 30 yrs out
- Wind 1/10 Low
- Air quality 2/10 Low 1 unhealthy d/yr today · 2 by 30 yrs out
Nearby sold comps map
Loading sold comps map…
Walkable amenities ~0.75 mi
Loading nearby amenities…
Taxation est. · year 1
- Rental income
- $14,840
- − Mortgage interest
- −$4,705
- − Property taxes
- −$1,232
- − Insurance
- −$420
- − Repairs & maintenance
- −$1,187
- − Management
- −$1,187
- − Depreciation
- −$2,444
- Taxable income
- $3,664
- Est. tax owed @ 24.0%
- −$879
- After-tax cash flow
- $3,906/yr
For passive investors: Depreciation is non-cash, so a rental often shows a tax loss while cash-flowing — sheltering income. Rental losses are passive: they offset passive income freely, and up to $25,000/yr can offset ordinary (W-2) income if you actively participate and your MAGI is under $100k (phasing out to $0 by $150k); unused losses carry forward. On sale, claimed depreciation is recaptured at up to 25%, and gains may owe capital-gains tax (a 1031 exchange can defer both). Figures are a year-1 estimate at your 24.0% rate — not tax advice; consult a CPA.
Schools (NCES district)
- District
- Alliance City
- NCES district ID
- 3904349
- Math proficiency
- 39% ▼ -9.00%
- Reading proficiency
- 45% ▼ -5.00%
- Median HH income
- $33,326
- Composite
- 34.54/100
- National rank
- #5176
- State rank
- #536 of 656 in OH
Livability — Alliance
- Score
- 78/100
- State rank
- #175
- US rank
- #2737
Category grades
Schools grade is shown separately in the Schools card above.
Census & demographics
- Census place
- Alliance, OH
- County
- Stark County · 272,865 people
- City population
- 32,696
- Metro
- Canton-Massillon, OH
- Population (ZIP)
- 32,696
- Household income
- $61,965
- Rent vs Own
- Severe rent burden
- 780.0
Population outlook (Stark County) Hauer SSP2
- Today (2025)
- 373,708 people
- By 2030
- 371,245 · -0.7%
- By 2040
- 361,331 · -3.3%
- By 2050
- 345,290 · -7.6%
- By 2075
- 302,669 · -19.0%
- By 2100
- 238,870 · -36.1%
Race, ethnicity, and origin ACS 2023
- Neighborhood character
- Predominantly White (87%)
- Race & ethnicity
- White 87% Black 6% Two or more races 5% Hispanic / Latino 1%
- Common ancestry
- Italian 3% Lithuanian 2% Slovak 2%
- Foreign-born
- 1%
- Languages at home
- 98% English-only · Spanish 1%
Political lean MEDSL · Stark
- 2024 margin
- Strong R (+21.9) · D 38.6% · R 60.5%
- 2008→2024 swing
- -27.4pp toward R · 2008: 5.5pp · 2024: -21.9pp
- All cycles
- 2024: R+21.9 2020: R+18.5 2016: R+17.4 2012: R+0.4 2008: D+5.5
Not yet ingested
- Civics
- —
Market trends
- HPI YoY
- ▼ -174.62%
- Current HPI
- 224.9507
- Rent YoY
- —
- Metro
- Canton-Massillon, OH
- State GDP YoY
- ▲ 1.98%
- F500 in state
- 48
Industry mix (Fortune 500 HQ in OH)
| Industry | F500 HQs | Revenue |
|---|---|---|
| Insurance | 3 | $145B |
|
||
| Industrial Machinery | 3 | $49B |
|
||
| Financial Services | 3 | $24B |
|
||
| Consumer Goods | 2 | $93B |
|
||
| Aerospace / Defense | 2 | $47B |
|
||
| Utilities | 2 | $33B |
|
||
Price history
+22.0% since first listed2 events — show timeline
- 2026-05-22 Listed $100,000 MLSNOW
- 2005-07-13 Sold (Public Records) $82,000 Public Records
Property tax history
+8.0%/yrLatest (2024): $1,232 · +46.0% YoY. Source: county tax records.
Cash-flow waterfall
monthlySold comps — $/sqft
last 12 mo · ≤1 miLoading sold comps…