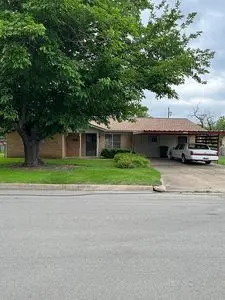
1908 SE 11th St · Mineral Wells, TX
Flood risk 1/10 · Minimal
- FEMA flood zone
- X (unshaded)
- Chance of flooding over 30 yrs
- 0.0%
- Est. flood insurance / yr
- $507 – $1,088
Fire risk 8/10 · Major
- Est. fire insurance / yr
- $1,222 – $2,270
Heat risk 7/10 · Major
- Hot days now (above 109°F)
- 7 days/yr
- Hot days in 30 yrs
- 23 days/yr
Wind risk 4/10 · Minor
- Chance of severe wind over 30 yrs
- 17.0%
Air-quality risk 2/10 · Minimal
- Unhealthy air days now
- 1 days/yr
- Unhealthy air days in 30 yrs
- 1 days/yr
Risk factors via First Street. Map © Google.
Why this score? — see what drove the C grade
The composite is a weighted blend of 9 inputs, each scored 0–100. Each bar is that input's sub-score; the figure is the points it added to the 100-point composite (weight × sub-score).
- Cash flow +20.6/30.0
- ARV discount +15.0/15.0
- 1% rule +6.6/10.0
- DSCR +6.5/10.0
- Livability +3.6/5.0
- Rent growth +2.5/5.0
- Schools +2.5/10.0
- Condition / age +2.5/5.0
- Appreciation +0.0/10.0
$140,000
🖨 Deal sheet 📄 Offer letter ✓ Due diligence
Listing remarks
ATTENTION INVESTORS or SWEAT EQUITY BUYERS. This 3/2 brick fixer-upper is in a desirable neighborhood! At 1,826sf there & acirc; & euro; & trade; s lots more sq footage due to added family room and delightful sun room. Updates over time include LVP flooring, electric cooktop and AC. This Priced-to-Sell home is a great Investor opportunity or perfect for DIY buyer wanting lower priced property. NOTE: Prior to showing an Official pre-qualification letter from lender is required. No Seller financing available. No contingency based on sale of Buyers house. Buyer to verify all information as Sellers have not lived in home. AGENTS: NO solicitation by Agents offering Seller representat
Key facts
- Ac
- Delightful sun room
- Lvp flooring
Tags
Neighborhood map
What this means for you Summary
Snapshot
- This is a 3-bed/2.0-bath single-family listed at $140k.
Deal economics
- At list price, monthly cash flow is $186 ($2k/yr) — positive.
- The deal already cash-flows at list — no discount required.
- Meets the 1% rule at list price ($2k rent vs $140k).
- Cap rate 7.9% vs local median 2.7% in Mineral Wells — top-decile yield for the area; either an underpriced asset or a hidden risk that comps aren't pricing in. Stress-test before assuming the spread holds.
Location & tenants
- Location reads 72/100 on livability (#278 in TX) — a middle-class / working-renter tenant base. Strengths: cost of living A+, housing A+, health & safety A+; Watch: crime D+, employment D, schools F.
- Mineral Wells ISD (town): math 30% / reading 30% proficiency, ranked #636 of 826 in TX (top 77%) — families likely to look elsewhere, expect single-tenant / working-renter base with shorter leases.
- Market conditions: 277 active listings in the ZIP; 5 comparable units currently listed for rent nearby; rentals at typical pace (median 24d on market — plan ~3-4 weeks tenant-placement turnaround); 27 units permitted in Palo Pinto County in 2024 (0 in 5+ unit buildings).
- This rent runs 31% of the median local income ($62k/yr) — at the standard rent-burdened threshold; future hikes will face affordability resistance.
Forward outlook
- Local home prices are declining (-3.0%/yr); year-one equity from $968 of loan paydown is wiped out by about $4k of value loss. Plan a longer hold.
- Palo Pinto County population projected to shrink 8% by 2050 — rents likely to lag national; underwrite the cash flow, not the appreciation.
Negotiation context
- Only 1 days on market — expect competitive offers; lowballing is unlikely to land.
Risks & watch-outs
- Watch-outs: property tax is 2.6% of price.
- Climate carrying-cost: severe wildfire risk; extreme-heat days projected 7→23/yr by 2055 (HVAC capex compounding) — expect insurance premiums to compound above CPI over the hold.
Questions for the listing agent
- Built in 1964 — when were the roof, HVAC, electrical panel, plumbing, and water heater last replaced?
- Property tax is high relative to price — has the assessment been appealed recently, and will the sale trigger a re-assessment?
- Is there a deadline driving the sale (1031 exchange, divorce, estate, relocation)? That informs how much negotiation room exists.
- Schools are F-rated, which usually means shorter tenancies and higher turnover. Who's the typical renter profile here, and what's been the actual vacancy rate?
- Crime grade is D in this area — have there been break-ins, vandalism, or insurance claims at this property in the last 3 years? What carrier currently insures it and at what premium?
- What's the average days-on-market for RENTAL listings here right now (not sales)? A rising rental-DOM trend means longer vacancies and softer asking-rent achievability than the comps imply.
- What's the recent tenant-quality profile in this submarket — average credit score on applications, eviction rate, late-payment / NSF rate, and stable-employment percentage? A property-management company in the area should have these aggregated.
- How much new for-sale + rental construction is in the pipeline within 1–3 miles? Heavy new supply typically softens prices + rents 12–24 months out; constrained supply supports both.
Investment metrics
- 1% rule
- 1.16% ✓
- Cap rate
- 7.89%
- Cash-on-cash
- 5.69%
- DSCR
- 1.25
- GRM
- 7.2
CMA / ARV
- ARV (on-the-fly)
- $220,946
- Comps found
- 12
Show comp detail 12 sales within ~0.75 mi
| Address | Dist | Beds/Ba | Sqft | Sold | Price | $/sf | Match |
|---|---|---|---|---|---|---|---|
| 2300 SE 11th St | 0.26mi | 3/2.0 | 1,791 (-2%) | 2mo | $140,000 | $78 | 84 |
| 1601 SE 23rd Ave | 0.37mi | 3/3.0 | 1,857 (+2%) | 10mo | $225,000 | $121 | 67 |
| 2506 SE 11th St | 0.42mi | 3/2.0 | 1,678 (-8%) | 7mo | $145,000 | $86 | 61 |
| 2107 SE 24th Ave | 0.62mi | 4/2.0 (+1) | 1,789 (-2%) | 3mo | $215,000 | $120 | 60 |
| 2901 S Murco Dr | 0.60mi | 3/2.0 | 1,903 (+4%) | 9mo | $250,000 | $131 | 57 |
| 2105 22nd Ave | 0.56mi | 3/2.0 | 1,987 (+9%) | 5mo | $269,900 | $136 | 55 |
| 2502 SE 14th St | 0.39mi | 4/2.0 (+1) | 1,661 (-9%) | 10mo | $274,900 | $166 | 53 |
| 508 SE 25th Ave | 0.56mi | 3/2.0 | 1,660 (-9%) | 7mo | $165,000 | $99 | 52 |
| 1014 9th St SE | 0.55mi | 3/1.0 | 1,680 (-8%) | 10mo | $35,000 | $21 | 49 |
| 2603 SE 4th St | 0.67mi | 3/2.0 | 1,605 (-12%) | 6mo | $159,900 | $100 | 43 |
| 1015 SE 20th St | 0.72mi | 3/2.0 | 1,569 (-14%) | 3mo | $189,800 | $121 | 41 |
| 2900 S Murco Dr | 0.59mi | 4/3.0 (+1) | 2,027 (+11%) | 10mo | $265,000 | $131 | 36 |
Match score weights: distance 35% · size 25% · config 20% · recency 20%. Top-matched comps best support the ARV.
Projected returns pro-forma
-3.0% appreciation · 3.0% rent growth · sell at horizon
- IRR
- -7.4%
- Equity multiple
- 0.73×
- Total profit
- $-10,746
- Equity at exit
- $20,874
- IRR
- 2.2%
- Equity multiple
- 1.16×
- Total profit
- $6,311
- Equity at exit
- $12,105
Cash invested: $39,200 (down + closing). Projections, not guarantees.
Landlord ↔ Tenant lean methodology
- Overall (STATE)
- 87 Strongly Landlord-Friendly
- State Texas
- 87 Strongly Landlord-Friendly · R+5
- County
- — inherits STATE
- City
- — inherits STATE
ZIP-level market 76067
- Active inventory
- 277
- Price-to-rent
- 7.2×
Monthly cashflow live
- Estimated rent
- $1,627 high interval (Pro) →
- Mortgage (P&I)
- −$734
- Tax from tax record
- −$307 /mo · $3,688/yr
- Insurance
- −$58
- HOA
- −$0
- Vacancy / Maint / Mgmt
- −$342
- Net cashflow
- $186
Break-even live
UW: 25.0% down · 7.5% · 30yr · 1.5% tax · 5.0% vac · 8.0% maint · 8.0% mgmt
Financing live
Cash to close
- Down payment
- $35,000
- Closing costs
- $4,200
- Reserves months
- —
- Total cash needed
- —
Loan-product check · same deal, 3 products live
Conventional
25% down · 7.5% · 30yr
- Down + closing
- —
- Monthly P&I
- —
- Monthly cashflow
- —
- DSCR
- —
- Eligible?
- —
Personal DTI + credit; lowest rate.
DSCR
20% down · 8.5% · 30yr
- Down + closing
- —
- Monthly P&I
- —
- Monthly cashflow
- —
- DSCR
- —
- Eligible?
- —
No personal income docs; deal must DSCR.
Hard money
10% down · 12.0% · 12mo
- Down + closing
- —
- Monthly P&I
- —
- Monthly cashflow
- —
- DSCR
- —
- Eligible?
- —
Short-term bridge; refi at stabilization.
Rent comps 5 comps
| Address | Beds | Baths | Sqft | Rent | $/sqft | DOM | Units | Dist |
|---|---|---|---|---|---|---|---|---|
| 1911 SE 14th St Mineral Wells, TX | 3.0 | 2.0 | 1256 | $1,600 | $1.27 | 24d | 1 | 0.20mi |
| 1303 SE 22nd Ave Mineral Wells, TX | 4.0 | 2.0 | 1960 | $1,872 | $0.96 | 24d | 1 | 0.28mi |
| 1106 SE 12th St Mineral Wells, TX | 3.0 | 2.0 | 1422 | $1,700 | $1.20 | 4d | 1 | 0.48mi |
| 3001 NE 2nd St Mineral Wells, TX | 1.0–3.0 | 1.0–2.0 | 909 | $1,200 | $1.32 | 1d | 10 | 0.91mi |
| 3116 SE Airport Rd Mineral Wells, TX | 4.0 | 2.0 | 1248 | $1,370 | $1.10 | 24d | 1 | 1.04mi |
Listing history 2 events
-
2026-05-13status Under Contract
-
2026-05-12$140,000 Active
ⓘ Source: listings_history table (triggers on properties + properties_extension) + one-shot
backfill from property_details.listing_events for pre-trigger history.
Tax reassessment forecast TX · Resets to sale price
- Current annual tax
- $3,688 · $307/mo
- Projected year-2 tax
- $3,688 · $307/mo
- Expected delta
- $0/yr ($0/mo · 0.0%)
ⓘ Screening estimate from a state-policy table — verify with the county assessor before closing.
Climate risk First Street
- Flood 1/10 Low FEMA zone X (unshaded) · 0% chance over 30 yrs
- Wildfire 8/10 Severe
- Heat 7/10 Severe 7 d/yr ≥109°F today · 23 d/yr by 30 yrs out
- Wind 4/10 Moderate 17% chance of damaging wind over 30 yrs
- Air quality 2/10 Low 1 unhealthy d/yr today · 1 by 30 yrs out
Nearby sold comps map
Loading sold comps map…
Walkable amenities ~0.75 mi
Loading nearby amenities…
Taxation est. · year 1
- Rental income
- $19,529
- − Mortgage interest
- −$7,842
- − Property taxes
- −$3,688
- − Insurance
- −$700
- − Repairs & maintenance
- −$1,562
- − Management
- −$1,562
- − Depreciation
- −$4,073
- Taxable income
- $101
- Est. tax owed @ 24.0%
- −$24
- After-tax cash flow
- $2,205/yr
For passive investors: Depreciation is non-cash, so a rental often shows a tax loss while cash-flowing — sheltering income. Rental losses are passive: they offset passive income freely, and up to $25,000/yr can offset ordinary (W-2) income if you actively participate and your MAGI is under $100k (phasing out to $0 by $150k); unused losses carry forward. On sale, claimed depreciation is recaptured at up to 25%, and gains may owe capital-gains tax (a 1031 exchange can defer both). Figures are a year-1 estimate at your 24.0% rate — not tax advice; consult a CPA.
Schools (NCES district)
- District
- Mineral Wells ISD
- NCES district ID
- 4830950
- Math proficiency
- 30% ▼ -10.00%
- Reading proficiency
- 30% ▼ -5.00%
- Median HH income
- $40,027
- Composite
- 25.26/100
- National rank
- #7500
- State rank
- #636 of 826 in TX
Livability — Mineral Wells
- Score
- 72/100
- State rank
- #278
- US rank
- #6474
Category grades
Schools grade is shown separately in the Schools card above.
Census & demographics
- Census place
- Mineral Wells, TX
- County
- Palo Pinto County · 21,080 people
- City population
- 21,080
- Metro
- Mineral Wells, TX
- Population (ZIP)
- 21,080
- Household income
- $62,190
- Rent vs Own
- Severe rent burden
- 745.0
Population outlook (Palo Pinto County) Hauer SSP2
- Today (2025)
- 27,500 people
- By 2030
- 27,079 · -1.5%
- By 2040
- 26,135 · -5.0%
- By 2050
- 25,215 · -8.3%
- By 2075
- 23,416 · -14.9%
- By 2100
- 20,300 · -26.2%
Race, ethnicity, and origin ACS 2023
- Neighborhood character
- Predominantly White (70%)
- Race & ethnicity
- White 70% Hispanic / Latino 22% Two or more races 9% Black 4% Asian 1%
- Hispanic origin (detail)
- Mexican 19%
- Common ancestry
- Lithuanian 4% Italian 1% Slovak 1%
- Foreign-born
- 6% · Canada
- Languages at home
- 86% English-only · Spanish 13% Other Indo-European 1%
Political lean MEDSL · Palo Pinto
- 2024 margin
- Solid R (+67.1) · D 16.1% · R 83.2%
- 2008→2024 swing
- -18.9pp toward R · 2008: -48.2pp · 2024: -67.1pp
- All cycles
- 2024: R+67.1 2020: R+64.1 2016: R+64.1 2012: R+59.8 2008: R+48.2
Not yet ingested
- Civics
- —
Market trends
- HPI YoY
- ▼ -134.09%
- Current HPI
- 240.3647
- Rent YoY
- —
- Metro
- Mineral Wells, TX
- State GDP YoY
- ▲ 3.95%
- F500 in state
- 110
Industry mix (Fortune 500 HQ in TX)
| Industry | F500 HQs | Revenue |
|---|---|---|
| Energy | 16 | $1,198B |
|
||
| Technology | 5 | $198B |
|
||
| Engineering / Construction | 4 | $72B |
|
||
| Energy Services | 3 | $60B |
|
||
| Utilities | 3 | $41B |
|
||
| Healthcare | 2 | $330B |
|
||
Price history
2 events — show timeline
- 2026-05-13 Pending — FSBO.com
- 2026-05-12 Listed $140,000 FSBO.com
Property tax history
+6.4%/yrLatest (2025): $3,688 · +8.5% YoY. Source: county tax records.
Cash-flow waterfall
monthlySold comps — $/sqft
last 12 mo · ≤1 miLoading sold comps…