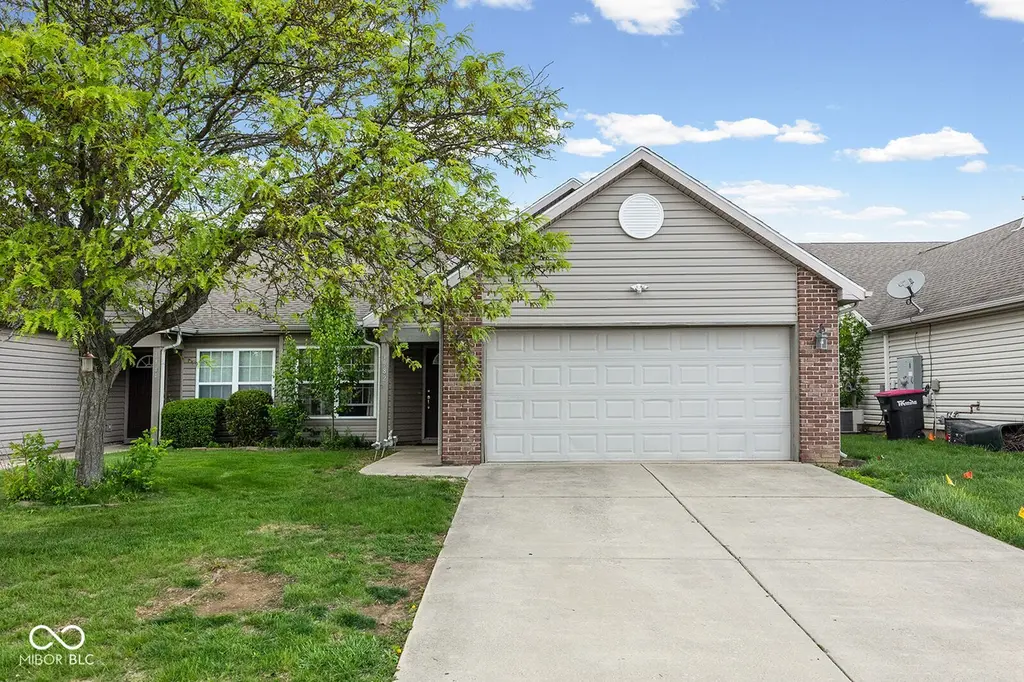
1982 Cal Dr · West Lafayette, IN
Flood risk 1/10 · Minimal
- FEMA flood zone
- X (unshaded)
- Chance of flooding over 30 yrs
- 0.0%
- Est. flood insurance / yr
- $507 – $1,088
Fire risk 1/10 · Minimal
- Est. fire insurance / yr
- $717 – $1,331
Heat risk 3/10 · Minor
- Hot days now (above 102°F)
- 7 days/yr
- Hot days in 30 yrs
- 19 days/yr
Wind risk 2/10 · Minimal
- Chance of severe wind over 30 yrs
- —
Air-quality risk 2/10 · Minimal
- Unhealthy air days now
- 1 days/yr
- Unhealthy air days in 30 yrs
- 2 days/yr
Risk factors via First Street. Map © Google.
Why this score? — see what drove the D grade
The composite is a weighted blend of 9 inputs, each scored 0–100. Each bar is that input's sub-score; the figure is the points it added to the 100-point composite (weight × sub-score).
- Cash flow +12.0/30.0
- ARV discount +9.6/15.0
- Livability +4.5/5.0
- Schools +4.0/10.0
- DSCR +3.6/10.0
- Rent growth +3.3/5.0
- 1% rule +2.7/10.0
- Condition / age +2.5/5.0
- Appreciation +0.0/10.0
$260,000
🖨 Deal sheet (PDF) 📄 Offer letter ✓ Due diligence
Listing remarks MLS
Great location for this 3-BR, 2.5-BA westside home near campus and bus line. Main floor master bedroom and bath + 2 additional upstairs bedrooms. Move-in ready condition. HOA covers lawn, snow removal, and trash. Closing and possesion August 30 or later.
Key facts
- Primary suite
- 4,680 sq ft lot
- 2 garage spots
Tags
Property features AI
Finance
- HOA & community: Homeowners association with an annual fee of $700 (about $58.33/month)
Exterior
- Parking: Attached garage with garage door opener; 2 garage spaces
- Security: Smoke detectors
- Utilities: Public water; Public sewer
- Home design: Single-family residence (site-built); Two-story home; Subdivision: Colony Pines; PUD zoning
- Construction: Brick and vinyl siding exterior; Slab foundation; Built area above grade: 1,816
- Exterior features: Patio; Level lot
Interior
- Kitchen: Disposal; Dishwasher; Microwave; Refrigerator; Electric range and oven; Water softener (owned)
- Bedrooms: Primary bedroom located on the main level
- Bathrooms: 2 full bathrooms; 1 half bathroom; Two main-level bathrooms
- Heating & cooling: Natural gas forced-air heating; Central air conditioning; Ceiling fans
- Interior features: Cathedral ceilings; Walk-in closets; Ceiling fans; Eat-in kitchen; Primary bedroom on main level; Living room fireplace
- Laundry & utility: Washer hookup; Electric dryer hookup; Laundry on main level; Washer and dryer included
Neighborhood map
What this means for you Summary
Snapshot
- This is a 3-bed/2.5-bath single-family listed at $260k.
Deal economics
- At list price, monthly cash flow is $-60 ($-721/yr) — negative.
- To cash-flow at today's rent, offer at most $249k (4.1% below list).
- To meet the 1% rule (rent ≥ 1% of price), the offer needs to be $201k (22.8% below list).
- Recommended offer: $201k (22.8% below list) — sets the bar for 1% rule.
- Cap rate 6.0% vs local median 3.0% in West Lafayette — top-decile yield for the area; either an underpriced asset or a hidden risk that comps aren't pricing in. Stress-test before assuming the spread holds.
Location & tenants
- Location reads 90/100 on livability (#1 in IN, #74 nationally) — a professional / high-income tenant draw. Strengths: crime A+, amenities A+, commute A+; Watch: housing C-, employment D.
- Tippecanoe School Corporation (rural): math 44% / reading 49% proficiency, ranked #80 of 301 in IN (top 27%) — families likely to look elsewhere, expect single-tenant / working-renter base with shorter leases.
- Zoned schools: Klondike Elementary School (math 46% / reading 44%, grade D-, #374 of 994 statewide, top 38%, 981 students, 39% FRL); Klondike Middle School (math 45% / reading 57%, grade C, #40 of 330 statewide, top 12%, 465 students, 36% FRL); William Henry Harrison High School (math 53% / reading 73%, grade B-, #39 of 369 statewide, top 11%, 2,136 students, 30% FRL).
- Market conditions: Rents rising (+3.2%/yr); 342 active listings in the ZIP; 13 comparable units currently listed for rent nearby; rentals at typical pace (median 15d on market — plan ~3-4 weeks tenant-placement turnaround); 1,341 units permitted in Tippecanoe County in 2024 (869 in 5+ unit buildings).
- At $2,007/mo this rent would consume 45% of the median local household income ($53k/yr) (locally 5978% of renters already pay >50% of income on rent) — very limited rent-growth headroom before tenants either downsize or default.
Forward outlook
- Local home prices are declining (-3.0%/yr); year-one equity from $2k of loan paydown is wiped out by about $8k of value loss. Plan a longer hold.
- Tippecanoe County population projected at +41% by 2050 — long-run rental-demand tailwind backs the buy-and-hold thesis.
Negotiation context
- It's been on market 46 days — a 3% lower offer ($252k) is reasonable based on typical stale-listing flexibility.
- 4 sale attempts since 9y ago with the ask held roughly flat each time — persistent listings suggest the price (not the market) is what's stuck; bring a comps-based counter.
- Current owner paid $215k; 21% above their basis — modest negotiation headroom, anchor on the comps not their cost.
Questions for the listing agent
- What do current leases actually rent for vs. the listed asking? Can we see a recent rent roll and the last 12 months of T-12 income?
- It's been on market 46 days. Have you received any prior offers? Is the seller open to a 23% concession, seller financing, or rate buy-down credit?
- What does the HOA fee cover, when was the last increase, and are there any pending special assessments or reserve-fund shortfalls?
- Is there a deadline driving the sale (1031 exchange, divorce, estate, relocation)? That informs how much negotiation room exists.
- Schools are A-rated — typically a magnet for longer-tenancy family renters. What's the average tenant stay here, and is there a school-zone premium baked into asking?
- The area grade is low — what's the realistic commute time and amenity access for the typical tenant pool here? Any planned neighborhood developments (good or bad) we should know about?
- What's the average days-on-market for RENTAL listings here right now (not sales)? A rising rental-DOM trend means longer vacancies and softer asking-rent achievability than the comps imply.
- What's the recent tenant-quality profile in this submarket — average credit score on applications, eviction rate, late-payment / NSF rate, and stable-employment percentage? A property-management company in the area should have these aggregated.
- How much new for-sale + rental construction is in the pipeline within 1–3 miles? Heavy new supply typically softens prices + rents 12–24 months out; constrained supply supports both.
Investment metrics
- 1% rule
- 0.77% ✗
- Cap rate
- 6.02%
- Cash-on-cash
- -0.99%
- DSCR
- 0.96
- GRM
- 10.8
CMA / ARV
- ARV (median comp)
- $272,523
- List price
- $260,000
- Delta
- -4.60%
- Verdict
- FAIR
- Comps
- 20 within 1.0 mi
Show comp detail 12 sales within ~0.75 mi
| Address | Dist | Beds/Ba | Sqft | Sold | Price | $/sf | Match |
|---|---|---|---|---|---|---|---|
| 1940 Ellison Dr | 0.06mi | 3/2.5 | 1,822 (+0%) | 2mo | $250,000 | $137 | 95 |
| 1949 Abnaki Way | 0.12mi | 3/2.5 | 1,802 (-1%) | 13mo | $298,000 | $165 | 82 |
| 1436 Solemar Dr | 0.46mi | 2/2.0 (-1) | 1,806 (-1%) | 14mo | $359,900 | $199 | 59 |
| 2335 Bainbridge Ct | 0.57mi | 4/2.0 (+1) | 1,890 (+4%) | 1mo | $205,000 | $108 | 59 |
| 3864 Estella Dr | 0.38mi | 2/2.0 (-1) | 1,684 (-7%) | 12mo | $350,000 | $208 | 53 |
| 2306 E Temple Ct | 0.68mi | 3/2.5 | 1,800 (-1%) | 17mo | $320,000 | $178 | 53 |
| 1544 Shining Armor Ln | 0.68mi | 3/2.5 | 1,751 (-4%) | 12mo | $293,000 | $167 | 53 |
| 1408 Solemar Dr | 0.45mi | 2/2.0 (-1) | 1,652 (-9%) | 5mo | $330,000 | $200 | 52 |
| 4315 Hadley Ct | 0.58mi | 3/2.5 | 1,697 (-7%) | 12mo | $334,600 | $197 | 52 |
| 3212 Hunter Rd | 0.71mi | 4/2.5 (+1) | 1,876 (+3%) | 19mo | $295,000 | $157 | 41 |
| 3150 Cirrus Ct | 0.66mi | 3/2.0 | 1,592 (-12%) | 11mo | $283,000 | $178 | 38 |
| 3141 Bluster Dr | 0.65mi | 3/2.0 | 1,602 (-12%) | 17mo | $272,750 | $170 | 34 |
Match score weights: distance 35% · size 25% · config 20% · recency 20%. Top-matched comps best support the ARV.
Projected returns pro-forma
-3.0% appreciation · 3.2% rent growth · sell at horizon
- IRR
- -17.8%
- Equity multiple
- 0.37×
- Total profit
- $-45,616
- Equity at exit
- $38,767
- IRR
- -9.6%
- Equity multiple
- 0.41×
- Total profit
- $-43,237
- Equity at exit
- $22,480
Cash invested: $72,800 (down + closing). Projections, not guarantees.
Landlord ↔ Tenant lean methodology
- Overall (STATE)
- 90 Strongly Landlord-Friendly
- State Indiana
- 90 Strongly Landlord-Friendly · R+11
- County
- — inherits STATE
- City
- — inherits STATE
ZIP-level market 47906
- Rents YoY
- 3.2%
- Active inventory
- 342
- Price-to-rent
- 10.8×
Monthly cashflow live
- Estimated rent
- $2,007 high interval (Pro) →
- Mortgage (P&I)
- −$1,363
- Tax from tax record
- −$115 /mo · $1,385/yr
- Insurance
- −$108
- HOA
- −$58
- Vacancy / Maint / Mgmt
- −$421
- Net cashflow
- $-60
Break-even live
Sensitivity live
| Price | -10% $87 | -5% $14 | +0% $-60 | +5% $-134 | +10% $-207 |
|---|---|---|---|---|---|
| Rent | -10% $-219 | -5% $-139 | +0% $-60 | +5% $19 | +10% $98 |
| Rate | -1.0pp $71 | -0.5pp $6 | base $-60 | +0.5pp $-127 | +1.0pp $-196 |
UW: 25.0% down · 7.5% · 30yr · 1.5% tax · 5.0% vac · 8.0% maint · 8.0% mgmt
Financing live
Cash to close
- Down payment
- $65,000
- Closing costs
- $7,800
- Reserves months
- —
- Total cash needed
- —
Loan-product check · same deal, 3 products live
Conventional
25% down · 7.5% · 30yr
- Down + closing
- —
- Monthly P&I
- —
- Monthly cashflow
- —
- DSCR
- —
- Eligible?
- —
Personal DTI + credit; lowest rate.
DSCR
20% down · 8.5% · 30yr
- Down + closing
- —
- Monthly P&I
- —
- Monthly cashflow
- —
- DSCR
- —
- Eligible?
- —
No personal income docs; deal must DSCR.
Hard money
10% down · 12.0% · 12mo
- Down + closing
- —
- Monthly P&I
- —
- Monthly cashflow
- —
- DSCR
- —
- Eligible?
- —
Short-term bridge; refi at stabilization.
Rent comps 13 comps
| Address | Beds | Baths | Sqft | Rent | $/sqft | DOM | Units | Dist |
|---|---|---|---|---|---|---|---|---|
| 1940 Ellison Dr West Lafayette, IN | 3.0 | 3.0 | 1822 | $2,100 | $1.15 | 23d | 1 | 0.08mi |
| 1860 Ellison Dr West Lafayette, IN | 3.0 | 2.5 | 1700 | $1,800 | $1.06 | 23d | 1 | 0.12mi |
| 3915 Ledyard St West Lafayette, IN | 3.0 | 2.0 | 1250 | $1,750 | $1.40 | 23d | 1 | 0.20mi |
| 3850 Amber Ct West Lafayette, IN | 2.0–3.0 | 1.5–2.5 | 1440 | $1,699 | $1.18 | 15d | 1 | 0.58mi |
| 1600 Lionheart Ln West Lafayette, IN | 3.0 | 2.0 | 1300 | $1,650 | $1.27 | 15d | 1 | 0.70mi |
| 2447 Easton Ln Unit NA West Lafayette, IN | 3.0 | 2.5 | 1950 | $2,250 | $1.15 | 23d | 1 | 0.71mi |
| 2117 Cumulus Ct West Lafayette, IN | 3.0 | 2.0 | 1270 | $2,200 | $1.73 | 15d | 1 | 0.73mi |
| 3551 Bethel Dr Unit 3555 Townhome West Lafayette, IN | 3.0 | 2.0 | 1500 | $1,650 | $1.10 | 15d | 1 | 0.77mi |
| 1403 Crusade Dr West Lafayette, IN | 3.0 | 2.0 | 1309 | $1,850 | $1.41 | 15d | 1 | 0.81mi |
| 1900 Foxglove Way West Lafayette, IN | 1.0–3.0 | 1.0–2.5 | 988 | $2,099 | $2.12 | 15d | 58 | 0.82mi |
| 2726 Wyndham Ct West Lafayette, IN | 3.0 | 3.5 | 1952 | $1,679 | $0.86 | 45d | 1 | 0.92mi |
| 3400 Wyndham Way West Lafayette, IN | 3.0 | 2.5 | 1950 | $1,900 | $0.97 | 15d | 1 | 1.00mi |
| 3301 Maitland Dr West Lafayette, IN | 3.0 | 2.0 | 1650 | $1,950 | $1.18 | 45d | 1 | 1.49mi |
HOA detail
- Monthly dues
- $58 · $696/yr
- Likely covers
- trashsnow removal
Listing history 20 events
-
2026-06-16status $260,000 Pending 46 DOM
-
2026-06-15days on market $260,000 Active 46 DOM
-
2026-06-14days on market $260,000 Active 44 DOM
-
2026-06-13days on market $260,000 Active 43 DOM
-
2026-06-10days on market $260,000 Active 41 DOM
-
2026-06-09days on market $260,000 Active 40 DOM
-
2026-06-08days on market $260,000 Active 39 DOM
-
2026-06-07days on market $260,000 Active 38 DOM
-
2026-06-05pricedays on market $260,000 Active 35 DOM
-
2026-06-02days on market $270,000 Active 33 DOM
-
2026-06-01days on market $270,000 Active 32 DOM
-
2026-05-31days on market $270,000 Active 31 DOM
-
2026-05-30days on market $270,000 Active 30 DOM
-
2026-04-30$270,000 Active 501-char remark
-
2026-04-30$270,000 Active 495-char remark
-
2021-08-16soldstatus $215,000
Show marketing remark (254 chars)
Great location for this 3-BR, 2.5-BA westside home near campus and bus line. Main floor master bedroom and bath + 2 additional upstairs bedrooms. Move-in ready condition. HOA covers lawn, snow removal, and trash. Closing and possesion August 30 or later.
-
2021-07-14$210,000
Show marketing remark (254 chars)
Great location for this 3-BR, 2.5-BA westside home near campus and bus line. Main floor master bedroom and bath + 2 additional upstairs bedrooms. Move-in ready condition. HOA covers lawn, snow removal, and trash. Closing and possesion August 30 or later.
-
2017-06-19soldstatus $29,000
-
2017-05-31soldstatus $129,000
-
2017-02-22$129,900
ⓘ Source: listings_history table (triggers on properties + properties_extension) + one-shot
backfill from property_details.listing_events for pre-trigger history.
Tax reassessment forecast IN · Partial reset (capped growth)
- Current annual tax
- $1,385 · $115/mo
- Projected year-2 tax
- $1,798 · $150/mo
- Expected delta
- +$412/yr (+$34/mo · 29.8%)
ⓘ Screening estimate from a state-policy table — verify with the county assessor before closing.
Climate risk First Street
- Flood 1/10 Low FEMA zone X (unshaded) · 0% chance over 30 yrs
- Wildfire 1/10 Low
- Heat 3/10 Moderate 7 d/yr ≥102°F today · 19 d/yr by 30 yrs out
- Wind 2/10 Low
- Air quality 2/10 Low 1 unhealthy d/yr today · 2 by 30 yrs out
Nearby sold comps map
Loading sold comps map…
Walkable amenities ~0.75 mi
Loading nearby amenities…
Taxation est. · year 1
- Rental income
- $24,078
- − Mortgage interest
- −$14,564
- − Property taxes
- −$1,385
- − Insurance
- −$1,300
- − Repairs & maintenance
- −$1,926
- − Management
- −$1,926
- − HOA
- −$696
- − Depreciation
- −$7,564
- Taxable loss
- −$5,283
- Est. tax savings @ 24.0%
- +$1,268
- After-tax cash flow
- $547/yr
For passive investors: Depreciation is non-cash, so a rental often shows a tax loss while cash-flowing — sheltering income. Rental losses are passive: they offset passive income freely, and up to $25,000/yr can offset ordinary (W-2) income if you actively participate and your MAGI is under $100k (phasing out to $0 by $150k); unused losses carry forward. On sale, claimed depreciation is recaptured at up to 25%, and gains may owe capital-gains tax (a 1031 exchange can defer both). Figures are a year-1 estimate at your 24.0% rate — not tax advice; consult a CPA.
Schools (NCES district)
- District
- Tippecanoe School Corporation
- NCES district ID
- 1811340
- Math proficiency
- 44% ▼ -6.00%
- Reading proficiency
- 49% ▼ -5.00%
- Median HH income
- $55,087
- Composite
- 40.36/100
- National rank
- #3741
- State rank
- #80 of 301 in IN
Livability — West Lafayette
- Score
- 90/100
- State rank
- #1
- US rank
- #74
Category grades
Schools grade is shown separately in the Schools card above.
Census & demographics
- County
- Tippecanoe County · 181,820 people
- City population
- 75,198
- Metro
- Lafayette-West Lafayette, IN
- Population (ZIP)
- 75,198
- Household income
- $53,103
- Rent vs Own
- Severe rent burden
- 5978.0
Population outlook (Tippecanoe County) Hauer SSP2
- Today (2025)
- 215,327 people
- By 2030
- 232,284 · +7.9%
- By 2040
- 266,517 · +23.8%
- By 2050
- 302,826 · +40.6%
- By 2075
- 394,445 · +83.2%
- By 2100
- 463,500 · +115.3%
Race, ethnicity, and origin ACS 2023
- Neighborhood character
- Predominantly White (69%)
- Race & ethnicity
- White 69% Asian 16% Hispanic / Latino 7% Two or more races 5% Black 5%
- Hispanic origin (detail)
- Mexican 4%
- Common ancestry
- Romanian 4% Slovak 3% Italian 2%
- Foreign-born
- 18% · China, Canada, South Korea
- Languages at home
- 79% English-only · Chinese 5% Spanish 4% Other Indo-European 4%
Political lean MEDSL · Tippecanoe
- 2024 margin
- Toss-up / Even · D 49.0% · R 49.1% · Other 1.9%
- 2008→2024 swing
- -11.8pp toward R · 2008: 11.6pp · 2024: -0.1pp
- All cycles
- 2024: R+0.1 2020: D+0.6 2016: R+5.7 2012: R+3.6 2008: D+11.6
Not yet ingested
- Civics
- —
Market trends
- HPI YoY
- ▼ -134.80%
- Current HPI
- 210.545
- Rent YoY
- ▲ 3.20%
- Metro
- Lafayette-West Lafayette, IN
- State GDP YoY
- ▲ 2.90%
- F500 in state
- 18
Industry mix (Fortune 500 HQ in IN)
| Industry | F500 HQs | Revenue |
|---|---|---|
| Industrial Machinery | 2 | $37B |
|
||
| Healthcare | 1 | $177B |
|
||
| Pharmaceuticals | 1 | $45B |
|
||
| Metals / Steel | 1 | $18B |
|
||
| Agriculture | 1 | $17B |
|
||
| Packaging | 1 | $12B |
|
||
Price history
+100.2% since first listed10 events — show timeline
- 2026-06-16 Pending — IRMLS
- 2026-06-04 Price Changed $260,000 IRMLS
- 2026-06-04 Price Changed $260,000 MIBOR as Distributed by MLS Grid
- 2026-04-30 Listed $270,000 IRMLS
- 2026-04-30 Listed $270,000 MIBOR as Distributed by MLS Grid
- 2021-08-16 Sold (MLS) $215,000 IRMLS
- 2021-07-14 Listed $210,000 IRMLS
- 2017-06-19 Sold (Public Records) $29,000 Public Records
- 2017-05-31 Sold (MLS) $129,000 IRMLS
- 2017-02-22 Listed $129,900 IRMLS
Property tax history
-1.1%/yrLatest (2024): $1,385 · +10.8% YoY. Source: county tax records.
Cash-flow waterfall
monthlySold comps — $/sqft
last 12 mo · ≤1 miLoading sold comps…