 🏗️ New Construction
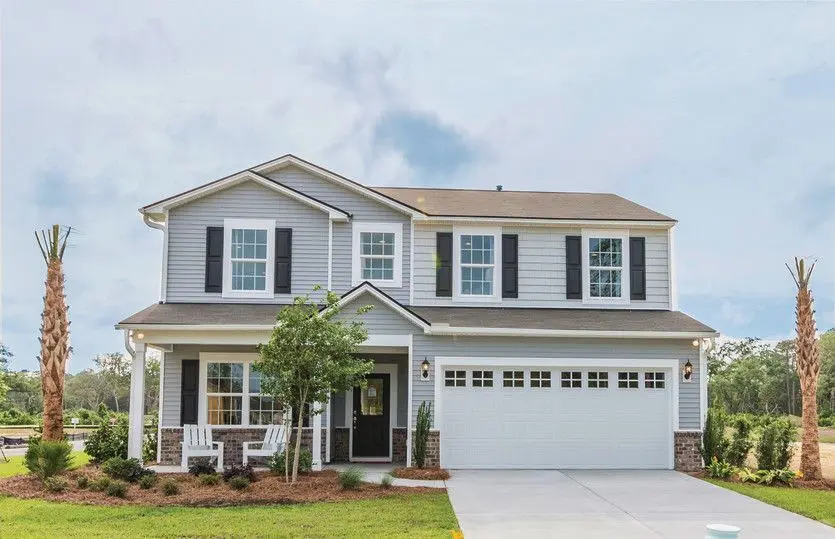
Aspire Plan · Savannah, GA
Flood risk No data
- FEMA flood zone
- —
- Chance of flooding over 30 yrs
- —
- Est. flood insurance / yr
- —
Fire risk No data
- Est. fire insurance / yr
- —
Heat risk No data
- Hot days now (above threshold)
- —
- Hot days in 30 yrs
- —
Wind risk No data
- Chance of severe wind over 30 yrs
- —
Air-quality risk No data
- Unhealthy air days now
- —
- Unhealthy air days in 30 yrs
- —
Risk factors via First Street. Map © Google.
Why this score? — see what drove the F grade
The composite is a weighted blend of 9 inputs, each scored 0–100. Each bar is that input's sub-score; the figure is the points it added to the 100-point composite (weight × sub-score).
- ARV discount +7.5/15.0
- Schools +4.5/10.0
- Livability +4.3/5.0
- Cash flow +4.1/30.0
- Rent growth +3.0/5.0
- Condition / age +2.5/5.0
- 1% rule +0.2/10.0
- DSCR +0.0/10.0
- Appreciation +0.0/10.0
$410,990
🖨 Deal sheet 📄 Offer letter ✓ Due diligence
Listing remarks MLS
In the Aspire new home plan, you will find the value - and elbow room - you need. This 2 story layout boasts three bedrooms as well as an upstairs loft for relaxing together. The downstairs lends itself to entertaining, with conversation flowing easily from the kitchen to the café dining area and comfy gathering room. The flex space off the foyer multitasks as a home office or secluded study.
Key facts
- Secluded study
- Upstairs loft
- Flex space
Tags
Neighborhood map
What this means for you Summary
Snapshot
- This is a 3-bed/2.5-bath single-family listed at $411k.
Deal economics
- At list price, monthly cash flow is $-2k ($-19k/yr) — negative.
- To cash-flow at today's rent, offer at most $339k (17.5% below list).
- To meet the 1% rule (rent ≥ 1% of price), the offer needs to be $297k (27.8% below list).
- Recommended offer: $297k (27.8% below list) — sets the bar for 1% rule.
- Cap rate 3.0% vs local median 4.0% in Savannah — below-typical yield; the buyer is paying a premium for something (appreciation thesis, condition, location) that the cap rate doesn't capture.
Location & tenants
- Location reads 86/100 on livability (#1 in GA, #397 nationally) — a professional / high-income tenant draw. Strengths: crime A+, amenities A+, commute A+; Watch: employment D, schools F.
- Bryan County (rural): math 49% / reading 53% proficiency, ranked #14 of 174 in GA (top 8%) — acceptable for families but not a draw, mixed tenant base, ~2y average lease.
- Market conditions: Rents rising (+2.2%/yr); 482 active listings in the ZIP; 3 comparable units currently listed for rent nearby; rentals leasing fast (median 14d on market — plan ~1-2 weeks tenant-placement turnaround); high-income renter base; 510 units permitted in Bryan County in 2024 (68 in 5+ unit buildings).
Forward outlook
- Local home prices are declining (-3.0%/yr); year-one equity from $4k of loan paydown is wiped out by about $17k of value loss. Plan a longer hold.
- Bryan County population projected at +64% by 2050 — long-run rental-demand tailwind backs the buy-and-hold thesis.
Negotiation context
- It's been on market 155 days — a 12% lower offer ($362k) is reasonable based on typical stale-listing flexibility.
Questions for the listing agent
- What do current leases actually rent for vs. the listed asking? Can we see a recent rent roll and the last 12 months of T-12 income?
- It's been on market 155 days. Have you received any prior offers? Is the seller open to a 28% concession, seller financing, or rate buy-down credit?
- Why hasn't it sold? Are there any deal-killer items the seller is aware of (foundation, flood, title, zoning, code violations)?
- Is there a deadline driving the sale (1031 exchange, divorce, estate, relocation)? That informs how much negotiation room exists.
- Schools are F-rated, which usually means shorter tenancies and higher turnover. Who's the typical renter profile here, and what's been the actual vacancy rate?
- The area grade is low — what's the realistic commute time and amenity access for the typical tenant pool here? Any planned neighborhood developments (good or bad) we should know about?
- What's the average days-on-market for RENTAL listings here right now (not sales)? A rising rental-DOM trend means longer vacancies and softer asking-rent achievability than the comps imply.
- What's the recent tenant-quality profile in this submarket — average credit score on applications, eviction rate, late-payment / NSF rate, and stable-employment percentage? A property-management company in the area should have these aggregated.
- How much new for-sale + rental construction is in the pipeline within 1–3 miles? Heavy new supply typically softens prices + rents 12–24 months out; constrained supply supports both.
Investment metrics
- 1% rule
- 0.52% ✗
- Cap rate
- 2.98%
- Cash-on-cash
- -11.84%
- DSCR
- 0.47
- GRM
- 15.9
CMA / ARV
- ARV (median comp)
- $565,181
- List price
- $410,990
- Delta
- -27.28%
- Verdict
- UNDERPRICED
- Comps
- 20 within 1.0 mi
Show comp detail 11 sales within ~0.75 mi
| Address | Dist | Beds/Ba | Sqft | Sold | Price | $/sf | Match |
|---|---|---|---|---|---|---|---|
| 15 Trail View Ct | 0.15mi | 3/2.5 | 2,174 (-4%) | 2mo | $556,165 | $256 | 85 |
| 140 Sandy Bend Dr | 0.20mi | 3/3.0 | 2,385 (+6%) | 4mo | $640,840 | $269 | 77 |
| 145 Blackjack Oak Dr E | 0.29mi | 4/2.5 (+1) | 2,165 (-4%) | 1mo | $490,000 | $226 | 74 |
| 190 Blackjack Oak Dr E | 0.32mi | 4/3.0 (+1) | 2,187 (-3%) | 0mo | $455,000 | $208 | 73 |
| 200 Ridgewood Park Ct | 0.45mi | 4/3.0 (+1) | 2,362 (+4%) | 5mo | $505,000 | $214 | 60 |
| 98 Castnet Dr | 0.21mi | 3/2.0 | 1,969 (-13%) | 10mo | $659,115 | $335 | 59 |
| 125 Wildlife View Ct N | 0.56mi | 3/2.0 | 2,197 (-3%) | 13mo | $575,000 | $262 | 57 |
| 414 Ridgewood Park Dr S | 0.70mi | 4/2.5 (+1) | 2,183 (-3%) | 0mo | $555,000 | $254 | 57 |
| 105 Wildlife View Ct N | 0.54mi | 4/2.5 (+1) | 2,132 (-6%) | 12mo | $565,000 | $265 | 50 |
| 88 Bradford Pear Dr | 0.56mi | 4/3.0 (+1) | 2,229 (-1%) | 23mo | $593,000 | $266 | 45 |
| 279 Ridgewood Park Dr S | 0.59mi | 4/3.0 (+1) | 2,529 (+12%) | 21mo | $650,000 | $257 | 28 |
Match score weights: distance 35% · size 25% · config 20% · recency 20%. Top-matched comps best support the ARV.
Projected returns pro-forma
-3.0% appreciation · 2.17% rent growth · sell at horizon
- IRR
- -39.0%
- Equity multiple
- -0.22×
- Total profit
- $-193,478
- Equity at exit
- $84,270
- IRR
- -66.0%
- Equity multiple
- -0.94×
- Total profit
- $-306,310
- Equity at exit
- $48,866
Cash invested: $158,251 (down + closing). Projections, not guarantees.
Landlord ↔ Tenant lean methodology
- Overall (STATE)
- 90 Strongly Landlord-Friendly
- State Georgia
- 90 Strongly Landlord-Friendly · R+3
- County
- — inherits STATE
- City
- — inherits STATE
ZIP-level market 31324
- Home prices YoY
- -30.8%
- Rents YoY
- 2.2%
- Active inventory
- 482
- Price-to-rent
- 11.5×
Monthly cashflow live
- Estimated rent
- $2,967 medium interval (Pro) →
- Mortgage (P&I)
- −$2,964
- Tax est. 1.5%
- −$706 /mo · $8,478/yr
- Insurance
- −$235
- HOA
- −$0
- Vacancy / Maint / Mgmt
- −$623
- Net cashflow
- $-1,562
Break-even live
UW: 25.0% down · 7.5% · 30yr · 1.5% tax · 5.0% vac · 8.0% maint · 8.0% mgmt
Financing live
Cash to close
- Down payment
- $141,295
- Closing costs
- $16,955
- Reserves months
- —
- Total cash needed
- —
Loan-product check · same deal, 3 products live
Conventional
25% down · 7.5% · 30yr
- Down + closing
- —
- Monthly P&I
- —
- Monthly cashflow
- —
- DSCR
- —
- Eligible?
- —
Personal DTI + credit; lowest rate.
DSCR
20% down · 8.5% · 30yr
- Down + closing
- —
- Monthly P&I
- —
- Monthly cashflow
- —
- DSCR
- —
- Eligible?
- —
No personal income docs; deal must DSCR.
Hard money
10% down · 12.0% · 12mo
- Down + closing
- —
- Monthly P&I
- —
- Monthly cashflow
- —
- DSCR
- —
- Eligible?
- —
Short-term bridge; refi at stabilization.
Rent comps 3 comps
| Address | Beds | Baths | Sqft | Rent | $/sqft | DOM | Units | Dist |
|---|---|---|---|---|---|---|---|---|
| 157 Lower Creek Dr Richmond Hill, GA | 3.0 | 2.5 | 1886 | $2,700 | $1.43 | 13d | 1 | 0.36mi |
| 265 Blackjack Oak Dr W Richmond Hill, GA | 4.0 | 2.5 | 2750 | $3,600 | $1.31 | 43d | 1 | 0.44mi |
| 62 Monterey Loop Richmond Hill, GA | 4.0 | 3.5 | 2394 | $2,975 | $1.24 | 13d | 1 | 1.50mi |
Listing history 17 events
-
2026-06-18days on market $410,990 Active 155 DOM
-
2026-06-17days on market $410,990 Active 154 DOM
-
2026-06-16days on market $410,990 Active 153 DOM
-
2026-06-15days on market $410,990 Active 152 DOM
-
2026-06-14days on market $410,990 Active 150 DOM
-
2026-06-13days on market $410,990 Active 149 DOM
-
2026-06-10days on market $410,990 Active 147 DOM
-
2026-06-09days on market $410,990 Active 146 DOM
-
2026-06-08days on market $410,990 Active 145 DOM
-
2026-06-07days on market $410,990 Active 144 DOM
-
2026-06-05days on market $410,990 Active 141 DOM
-
2026-06-03days on market $410,990 Active 140 DOM
-
2026-06-02days on market $410,990 Active 139 DOM
-
2026-06-01days on market $410,990 Active 138 DOM
-
2026-05-31days on market $410,990 Active 137 DOM
-
2026-05-30days on market $410,990 Active 136 DOM
-
2026-01-15$410,990 Active 402-char remark
Show marketing remark (402 chars)
In the Aspire new home plan, you will find the value - and elbow room - you need. This 2 story layout boasts three bedrooms as well as an upstairs loft for relaxing together. The downstairs lends itself to entertaining, with conversation flowing easily from the kitchen to the café dining area and comfy gathering room. The flex space off the foyer multitasks as a home office or secluded study.
ⓘ Source: listings_history table (triggers on properties + properties_extension) + one-shot
backfill from property_details.listing_events for pre-trigger history.
Nearby sold comps map
Loading sold comps map…
Walkable amenities ~0.75 mi
Loading nearby amenities…
Taxation est. · year 1
- Rental income
- $35,603
- − Mortgage interest
- −$31,659
- − Property taxes
- −$8,478
- − Insurance
- −$2,826
- − Repairs & maintenance
- −$2,848
- − Management
- −$2,848
- − Depreciation
- −$16,442
- Taxable loss
- −$29,497
- Est. tax savings @ 24.0%
- +$7,079
- After-tax cash flow
- $-11,664/yr
For passive investors: Depreciation is non-cash, so a rental often shows a tax loss while cash-flowing — sheltering income. Rental losses are passive: they offset passive income freely, and up to $25,000/yr can offset ordinary (W-2) income if you actively participate and your MAGI is under $100k (phasing out to $0 by $150k); unused losses carry forward. On sale, claimed depreciation is recaptured at up to 25%, and gains may owe capital-gains tax (a 1031 exchange can defer both). Figures are a year-1 estimate at your 24.0% rate — not tax advice; consult a CPA.
Schools (NCES district)
- District
- Bryan County
- NCES district ID
- 1300570
- Math proficiency
- 49% ▼ -2.00%
- Reading proficiency
- 53% ▼ -2.00%
- Median HH income
- $64,465
- Composite
- 44.99/100
- National rank
- #2701
- State rank
- #14 of 174 in GA
Livability — Savannah
- Score
- 86/100
- State rank
- #1
- US rank
- #397
Category grades
Schools grade is shown separately in the Schools card above.
Census & demographics
- County
- Bryan County · 37,406 people
- City population
- 216,564
- Metro
- Savannah, GA
- Population (ZIP)
- 37,406
- Household income
- $122,378
- Rent vs Own
- Severe rent burden
- 562.0
Population outlook (Bryan County) Hauer SSP2
- Today (2025)
- 45,980 people
- By 2030
- 51,583 · +12.2%
- By 2040
- 63,184 · +37.4%
- By 2050
- 75,400 · +64.0%
- By 2075
- 105,363 · +129.1%
- By 2100
- 124,959 · +171.8%
Race, ethnicity, and origin ACS 2023
- Neighborhood character
- Predominantly White (70%)
- Race & ethnicity
- White 70% Black 12% Hispanic / Latino 9% Two or more races 8% Asian 3%
- Hispanic origin (detail)
- Mexican 2% Puerto Rican 5%
- Common ancestry
- Lithuanian 3% Romanian 2% Slovak 2%
- Foreign-born
- 6% · Canada, Jamaica
- Languages at home
- 89% English-only · Spanish 7% Other Indo-European 2% German/W. Germanic 1%
Political lean MEDSL · Bryan
- 2024 margin
- Solid R (+36.3) · D 31.6% · R 67.9%
- 2008→2024 swing
- +6.3pp toward D · 2008: -42.6pp · 2024: -36.3pp
- All cycles
- 2024: R+36.3 2020: R+35.2 2016: R+43.2 2012: R+43.6 2008: R+42.6
Not yet ingested
- Civics
- —
Market trends
- HPI YoY
- ▼ -95.54%
- Current HPI
- 215.1789
- Rent YoY
- ▲ 2.17%
- Metro
- Savannah, GA
- State GDP YoY
- ▲ 2.66%
- F500 in state
- 28
Industry mix (Fortune 500 HQ in GA)
| Industry | F500 HQs | Revenue |
|---|---|---|
| Paper / Packaging | 2 | $29B |
|
||
| Retail | 1 | $160B |
|
||
| Transportation / Logistics | 1 | $91B |
|
||
| Airlines | 1 | $62B |
|
||
| Consumer Goods | 1 | $47B |
|
||
| Utilities | 1 | $25B |
|
||
Price history
1 event — show timeline
- 2026-01-15 Listed $410,990 Zillow
Cash-flow waterfall
monthlySold comps — $/sqft
last 12 mo · ≤1 miLoading sold comps…