 🔨 Auction
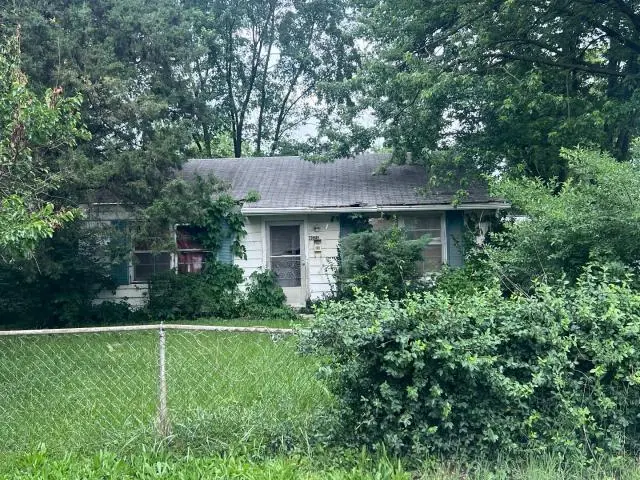
4626 Langley Ave · Whitehall, OH
Flood risk 1/10 · Minimal
- FEMA flood zone
- X (unshaded)
- Chance of flooding over 30 yrs
- 0.0%
- Est. flood insurance / yr
- $507 – $1,088
Fire risk 1/10 · Minimal
- Est. fire insurance / yr
- $713 – $1,323
Heat risk 3/10 · Minor
- Hot days now (above 99°F)
- 7 days/yr
- Hot days in 30 yrs
- 18 days/yr
Wind risk 2/10 · Minimal
- Chance of severe wind over 30 yrs
- 1.0%
Air-quality risk 2/10 · Minimal
- Unhealthy air days now
- 1 days/yr
- Unhealthy air days in 30 yrs
- 3 days/yr
Risk factors via First Street. Map © Google.
Why this score? — see what drove the F grade
The composite is a weighted blend of 9 inputs, each scored 0–100. Each bar is that input's sub-score; the figure is the points it added to the 100-point composite (weight × sub-score).
- ARV discount +7.5/15.0
- Cash flow +7.1/30.0
- Livability +3.6/5.0
- Rent growth +3.1/5.0
- Condition / age +2.5/5.0
- Schools +2.1/10.0
- 1% rule +1.9/10.0
- DSCR +1.3/10.0
- Appreciation +0.0/10.0
$1
🖨 Deal sheet (PDF) 📄 Offer letter ✓ Due diligence
Listing remarks
Court Ordered Sale by Private Selling Officer. Auction ends on June 18, 2026. All information we have on the property is included. We have no additional information, property condition is unknown. NO SHOWINGS, NO trespassing for any reason. Information is thought to be correct but not guaranteed. 5% Buyer Premium added to the high bid, $5,000 deposit is due within 24 hours of bidding end.
Key facts
- 6,098 sq ft lot
- Built 1954
Neighborhood map
What this means for you Summary
Snapshot
- This is a 2-bed/1.0-bath single-family listed at $1.
Deal economics
- At list price, monthly cash flow is $-259 ($-3k/yr) — negative.
- The deal already cash-flows at list — no discount required.
- Meets the 1% rule at list price ($1k rent vs $1).
Location & tenants
- Location reads 71/100 on livability (#399 in OH) — a middle-class / working-renter tenant base. Strengths: commute A+, cost of living A+, housing A+; Watch: crime F, employment D-.
- Whitehall City (suburban): math 18% / reading 33% proficiency, ranked #603 of 656 in OH (top 92%) — low school quality limits family demand, transient renter base, plan for 1-2y turnover; 69% free/reduced lunch — lower-income household profile, screen leases tightly.
- Zoned schools: Kae Avenue Elementary School (609 students, 0% FRL); Rosemore Middle School (math 17% / reading 29%, grade F, #600 of 654 statewide, top 92%, 774 students, 0% FRL); Whitehall Yearling High School (math 12% / reading 46%, grade F, #627 of 781 statewide, top 81%, 810 students, 0% FRL) — zoned schools average 0% FRL vs 69% district-wide (69 pts lower); this property's tenant base skews higher-income than the district average.
- Market conditions: Rents rising (+2.3%/yr); 67 active listings in the ZIP; 23 comparable units currently listed for rent nearby; rentals at typical pace (median 26d on market — plan ~3-4 weeks tenant-placement turnaround); 8,139 units permitted in Franklin County in 2024 (5,940 in 5+ unit buildings).
Forward outlook
- Local home prices are declining (-3.0%/yr); year-one equity from $1k of loan paydown is wiped out by about $5k of value loss. Plan a longer hold.
- Franklin County population projected at +34% by 2050 — long-run rental-demand tailwind backs the buy-and-hold thesis.
Negotiation context
- Only 0 days on market — expect competitive offers; lowballing is unlikely to land.
Risks & watch-outs
- Watch-outs: property tax is 273312.0% of price; built in 1954 — expect roof / HVAC / electrical / plumbing capex.
Questions for the listing agent
- What do current leases actually rent for vs. the listed asking? Can we see a recent rent roll and the last 12 months of T-12 income?
- Built in 1954 — when were the roof, HVAC, electrical panel, plumbing, and water heater last replaced?
- Property tax is high relative to price — has the assessment been appealed recently, and will the sale trigger a re-assessment?
- Is there a deadline driving the sale (1031 exchange, divorce, estate, relocation)? That informs how much negotiation room exists.
- Schools are D-rated, which usually means shorter tenancies and higher turnover. Who's the typical renter profile here, and what's been the actual vacancy rate?
- Crime grade is F in this area — have there been break-ins, vandalism, or insurance claims at this property in the last 3 years? What carrier currently insures it and at what premium?
- The area grade is low — what's the realistic commute time and amenity access for the typical tenant pool here? Any planned neighborhood developments (good or bad) we should know about?
- What's the average days-on-market for RENTAL listings here right now (not sales)? A rising rental-DOM trend means longer vacancies and softer asking-rent achievability than the comps imply.
- What's the recent tenant-quality profile in this submarket — average credit score on applications, eviction rate, late-payment / NSF rate, and stable-employment percentage? A property-management company in the area should have these aggregated.
- How much new for-sale + rental construction is in the pipeline within 1–3 miles? Heavy new supply typically softens prices + rents 12–24 months out; constrained supply supports both.
Investment metrics
- 1% rule
- 0.69% ✗
- Cap rate
- 4.59%
- Cash-on-cash
- -6.10%
- DSCR
- 0.73
- GRM
- 12.0
CMA / ARV
- ARV (on-the-fly)
- $182,208
- Comps found
- 12
Show comp detail 12 sales within ~0.75 mi
| Address | Dist | Beds/Ba | Sqft | Sold | Price | $/sf | Match |
|---|---|---|---|---|---|---|---|
| 4623 Langley Ave | 0.03mi | 2/1.0 | 832 (0%) | 1mo | $180,000 | $216 | 98 |
| 579 Westphal Ave | 0.40mi | 2/1.0 | 781 (-6%) | 6mo | $92,999 | $119 | 66 |
| 290 Little Flower Ln | 0.61mi | 2/1.0 | 875 (+5%) | 8mo | $147,500 | $169 | 56 |
| 725 Pierce Ave | 0.43mi | 2/1.0 | 754 (-9%) | 9mo | $170,000 | $225 | 56 |
| 1193 Marble Dr | 0.65mi | 3/1.0 (+1) | 912 (+10%) | 2mo | $185,000 | $203 | 48 |
| 1211 Shady Lane Rd | 0.68mi | 3/1.0 (+1) | 912 (+10%) | 1mo | $169,900 | $186 | 46 |
| 224 Ross Rd | 0.72mi | 3/1.0 (+1) | 875 (+5%) | 8mo | $205,000 | $234 | 46 |
| 4619 Saint Ann Ln | 0.63mi | 2/1.0 | 750 (-10%) | 12mo | $179,000 | $239 | 44 |
| 4561 Saint Rita Ln | 0.69mi | 3/1.0 (+1) | 875 (+5%) | 12mo | $217,900 | $249 | 44 |
| 1243 Simpson Dr | 0.72mi | 3/2.0 (+1) | 912 (+10%) | 1mo | $200,000 | $219 | 40 |
| 4517 Saint Rita Ln | 0.73mi | 3/1.0 (+1) | 923 (+11%) | 3mo | $130,000 | $141 | 40 |
| 1195 Huntly Dr | 0.68mi | 3/2.0 (+1) | 912 (+10%) | 4mo | $230,000 | $252 | 40 |
Match score weights: distance 35% · size 25% · config 20% · recency 20%. Top-matched comps best support the ARV.
Projected returns pro-forma
-3.0% appreciation · 2.29% rent growth · sell at horizon
- IRR
- -27.6%
- Equity multiple
- 0.08×
- Total profit
- $-46,919
- Equity at exit
- $27,168
- IRR
- -28.6%
- Equity multiple
- -0.29×
- Total profit
- $-65,677
- Equity at exit
- $15,754
Cash invested: $51,018 (down + closing). Projections, not guarantees.
Landlord ↔ Tenant lean methodology
- Overall (STATE)
- 73 Landlord-Friendly
- State Ohio
- 73 Landlord-Friendly · R+6
- County
- — inherits STATE
- City
- — inherits STATE
ZIP-level market 43213
- Rents YoY
- 2.3%
- Active inventory
- 67
Monthly cashflow live
- Estimated rent
- $1,266 high interval (Pro) →
- Mortgage (P&I)
- −$956
- Tax est. 1.5%
- −$228 /mo · $2,733/yr
- Insurance
- −$76
- HOA
- −$0
- Vacancy / Maint / Mgmt
- −$266
- Net cashflow
- $-259
Break-even live
Sensitivity live
| Price | -10% $-133 | -5% $-196 | +0% $-259 | +5% $-322 | +10% $-385 |
|---|---|---|---|---|---|
| Rent | -10% $-359 | -5% $-309 | +0% $-259 | +5% $-209 | +10% $-159 |
| Rate | -1.0pp $-168 | -0.5pp $-213 | base $-259 | +0.5pp $-307 | +1.0pp $-355 |
UW: 25.0% down · 7.5% · 30yr · 1.5% tax · 5.0% vac · 8.0% maint · 8.0% mgmt
Financing live
Cash to close
- Down payment
- $45,552
- Closing costs
- $5,466
- Reserves months
- —
- Total cash needed
- —
Loan-product check · same deal, 3 products live
Conventional
25% down · 7.5% · 30yr
- Down + closing
- —
- Monthly P&I
- —
- Monthly cashflow
- —
- DSCR
- —
- Eligible?
- —
Personal DTI + credit; lowest rate.
DSCR
20% down · 8.5% · 30yr
- Down + closing
- —
- Monthly P&I
- —
- Monthly cashflow
- —
- DSCR
- —
- Eligible?
- —
No personal income docs; deal must DSCR.
Hard money
10% down · 12.0% · 12mo
- Down + closing
- —
- Monthly P&I
- —
- Monthly cashflow
- —
- DSCR
- —
- Eligible?
- —
Short-term bridge; refi at stabilization.
Rent comps 23 comps
| Address | Beds | Baths | Sqft | Rent | $/sqft | DOM | Units | Dist |
|---|---|---|---|---|---|---|---|---|
| 685-687 Valerie Ln Whitehall, OH | 2.0 | 1.0 | 800 | $1,153 | $1.44 | 45d | 1 | 0.16mi |
| 496 S Hamilton Rd Whitehall, OH | 1.0–2.0 | 1.0 | 663 | $850 | $1.28 | 25d | 4 | 0.39mi |
| 973 Exeter Rd Columbus, OH | 3.0 | 1.0 | 1054 | $1,710 | $1.62 | 45d | 1 | 0.47mi |
| 280 Barkley Pl W Columbus, OH | 2.0 | 1.5 | 1077 | $1,362 | $1.26 | 45d | 1 | 0.65mi |
| 4163 Wright Park Columbus, OH | 2.0 | 2.0 | 1008 | $1,750 | $1.74 | 45d | 1 | 0.71mi |
| 381 S Yearling Rd Unit 381 Yearling Whitehall, OH | 3.0 | 1.0 | 850 | $1,095 | $1.29 | 25d | 1 | 0.75mi |
| 1250 Kelburn Rd Columbus, OH | 2.0 | 1.0 | 970 | $1,099 | $1.13 | 45d | 1 | 0.76mi |
| 1250 Kelburn Rd Columbus, OH | 2.0 | 1.0 | 970 | $1,099 | $1.13 | 23d | 1 | 0.76mi |
| 1250 Kelburn Rd Columbus, OH | 2.0 | 1.0 | 970 | $1,200 | $1.24 | 14d | 1 | 0.76mi |
| 3974 Andrus Ct E Unit 3982D Columbus, OH | 2.0 | 1.5 | 950 | $1,285 | $1.35 | 25d | 1 | 0.92mi |
| 3974 Andrus Ct E Unit 3996C Columbus, OH | 2.0 | 1.5 | 950 | $1,185 | $1.25 | 25d | 1 | 0.92mi |
| 3974 Andrus Ave Columbus, OH | 2.0 | 1.5 | 950 | $1,235 | $1.30 | 25d | 3 | 0.96mi |
| 406 Beechtree Rd Whitehall, OH | 3.0 | 1.0 | 950 | $1,300 | $1.37 | 25d | 1 | 1.08mi |
| 4657 E Broad St Columbus, OH | 1.0–2.0 | 1.0–2.0 | 850 | $1,667 | $1.96 | 4d | 48 | 1.08mi |
| 5312 Gatehouse Dr Columbus, OH | 1.0–2.0 | 1.0–1.5 | 1171 | $1,499 | $1.28 | 3d | 15 | 1.10mi |
| 1537 Duffield Dr Columbus, OH | 3.0 | 2.0 | 1020 | $1,500 | $1.47 | 45d | 1 | 1.14mi |
| 4048 E Livingston Ave Columbus, OH | 3.0 | 1.0 | 961 | $1,000 | $1.04 | 22d | 1 | 1.20mi |
| 1462 Elaine Rd Columbus, OH | 2.0 | 1.5 | 975 | $1,324 | $1.36 | 25d | 1 | 1.23mi |
| 4264 E Broad St Columbus, OH | 1.0 | 1.0 | 484 | $905 | $1.87 | 3d | 15 | 1.24mi |
| 1303 Dellwood Ave Columbus, OH | 3.0 | 1.0 | 900 | $1,500 | $1.67 | 45d | 1 | 1.30mi |
| 1246 Arkwood Ave Columbus, OH | 3.0 | 1.0 | 1094 | $1,740 | $1.59 | 45d | 1 | 1.38mi |
| 4056 Carlton Ave Columbus, OH | 2.0 | 1.5 | 1100 | $1,250 | $1.14 | 25d | 1 | 1.41mi |
| 5680 Hibernia Dr Columbus, OH | 1.0–2.0 | 1.0–1.5 | 1045 | $1,340 | $1.28 | 0d | 12 | 1.41mi |
Listing history 2 events
-
2026-06-18remarks 391-char remark
-
2026-06-18$1 Pending
ⓘ Source: listings_history table (triggers on properties + properties_extension) + one-shot
backfill from property_details.listing_events for pre-trigger history.
Climate risk First Street
- Flood 1/10 Low FEMA zone X (unshaded) · 0% chance over 30 yrs
- Wildfire 1/10 Low
- Heat 3/10 Moderate 7 d/yr ≥99°F today · 18 d/yr by 30 yrs out
- Wind 2/10 Low 100% chance of damaging wind over 30 yrs
- Air quality 2/10 Low 1 unhealthy d/yr today · 3 by 30 yrs out
Nearby sold comps map
Loading sold comps map…
Walkable amenities ~0.75 mi
Loading nearby amenities…
Taxation est. · year 1
- Rental income
- $15,188
- − Mortgage interest
- −$10,206
- − Property taxes
- −$2,733
- − Insurance
- −$911
- − Repairs & maintenance
- −$1,215
- − Management
- −$1,215
- − Depreciation
- −$5,301
- Taxable loss
- −$6,393
- Est. tax savings @ 24.0%
- +$1,534
- After-tax cash flow
- $-1,577/yr
For passive investors: Depreciation is non-cash, so a rental often shows a tax loss while cash-flowing — sheltering income. Rental losses are passive: they offset passive income freely, and up to $25,000/yr can offset ordinary (W-2) income if you actively participate and your MAGI is under $100k (phasing out to $0 by $150k); unused losses carry forward. On sale, claimed depreciation is recaptured at up to 25%, and gains may owe capital-gains tax (a 1031 exchange can defer both). Figures are a year-1 estimate at your 24.0% rate — not tax advice; consult a CPA.
Schools (NCES district)
- District
- Whitehall City
- NCES district ID
- 3904507
- Math proficiency
- 18% ▼ -17.00%
- Reading proficiency
- 33% ▼ -11.00%
- Median HH income
- $36,092
- Composite
- 21.08/100
- National rank
- #8442
- State rank
- #603 of 656 in OH
Livability — Whitehall
- Score
- 71/100
- State rank
- #399
- US rank
- #6587
Category grades
Schools grade is shown separately in the Schools card above.
Census & demographics
- Census place
- Whitehall, OH
- County
- Franklin County · 1,351,780 people
- City population
- 36,273
- Metro
- Columbus, OH
- Population (ZIP)
- 36,273
- Household income
- $54,704
- Rent vs Own
- Severe rent burden
- 2583.0
Population outlook (Franklin County) Hauer SSP2
- Today (2025)
- 1,456,139 people
- By 2030
- 1,556,890 · +6.9%
- By 2040
- 1,757,349 · +20.7%
- By 2050
- 1,950,539 · +34.0%
- By 2075
- 2,376,171 · +63.2%
- By 2100
- 2,636,796 · +81.1%
Race, ethnicity, and origin ACS 2023
- Neighborhood character
- Diverse neighborhood (Simpson 0.66)
- Race & ethnicity
- Black 45% White 36% Hispanic / Latino 10% Two or more races 9% Asian 3%
- Hispanic origin (detail)
- Mexican 4% Puerto Rican 2%
- Common ancestry
- Romanian 2% Slovak 1% Lithuanian 1%
- Foreign-born
- 15% · Canada, China
- Languages at home
- 79% English-only · Spanish 8% Other Indo-European 1% French/Haitian/Cajun 1%
Political lean MEDSL · Franklin
- 2024 margin
- Strong D (+28.4) · D 63.7% · R 35.3% · Other 1.0%
- 2008→2024 swing
- +7.7pp toward D · 2008: 20.7pp · 2024: 28.4pp
- All cycles
- 2024: D+28.4 2020: D+31.4 2016: D+25.9 2012: D+21.7 2008: D+20.7
Not yet ingested
- Civics
- —
Market trends
- HPI YoY
- ▼ -243.35%
- Current HPI
- 198.5072
- Rent YoY
- ▲ 2.29%
- Metro
- Columbus, OH
- State GDP YoY
- ▲ 1.98%
- F500 in state
- 48
Industry mix (Fortune 500 HQ in OH)
| Industry | F500 HQs | Revenue |
|---|---|---|
| Insurance | 3 | $145B |
|
||
| Industrial Machinery | 3 | $49B |
|
||
| Financial Services | 3 | $24B |
|
||
| Consumer Goods | 2 | $93B |
|
||
| Aerospace / Defense | 2 | $47B |
|
||
| Utilities | 2 | $33B |
|
||
Property tax history
+4.7%/yrLatest (2024): $1,651 · -6.0% YoY. Source: county tax records.
Cash-flow waterfall
monthlySold comps — $/sqft
last 12 mo · ≤1 miLoading sold comps…