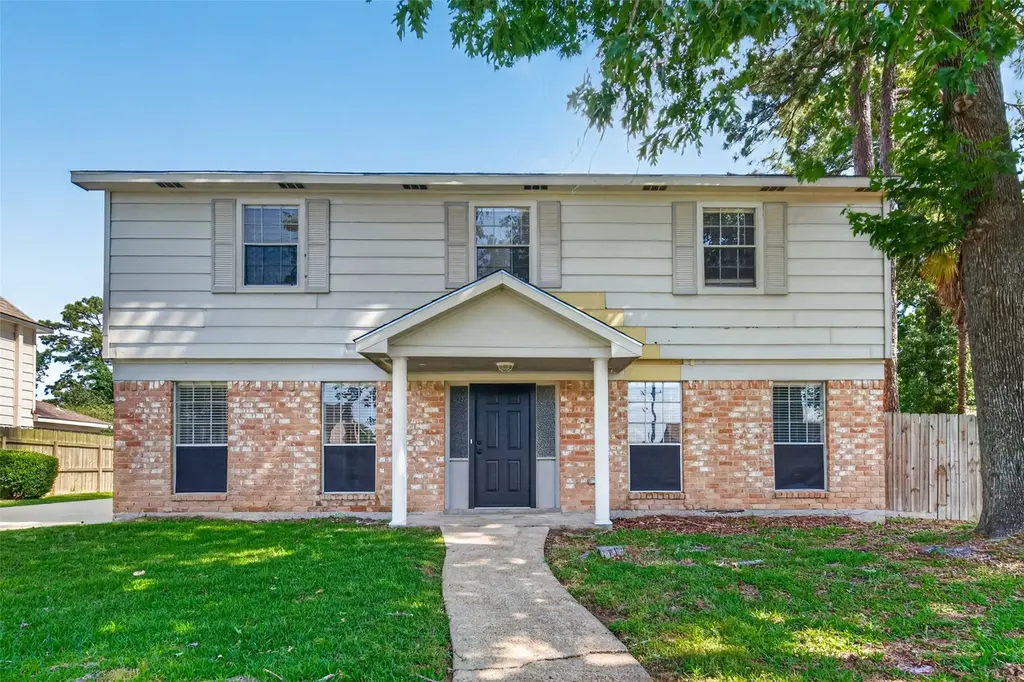
5515 Green Timbers Dr · Atascocita, TX
Flood risk 1/10 · Minimal
- FEMA flood zone
- X (unshaded)
- Chance of flooding over 30 yrs
- 0.0%
- Est. flood insurance / yr
- $507 – $1,088
Fire risk 2/10 · Minimal
- Est. fire insurance / yr
- $1,222 – $2,270
Heat risk 9/10 · Severe
- Hot days now (above 110°F)
- 7 days/yr
- Hot days in 30 yrs
- 24 days/yr
Wind risk 9/10 · Severe
- Chance of severe wind over 30 yrs
- 99.0%
Air-quality risk 3/10 · Minor
- Unhealthy air days now
- 3 days/yr
- Unhealthy air days in 30 yrs
- 3 days/yr
Risk factors via First Street. Map © Google.
Why this score? — see what drove the C+ grade
The composite is a weighted blend of 9 inputs, each scored 0–100. Each bar is that input's sub-score; the figure is the points it added to the 100-point composite (weight × sub-score).
- Cash flow +20.4/30.0
- ARV discount +11.6/15.0
- DSCR +6.5/10.0
- 1% rule +6.4/10.0
- Appreciation +4.5/10.0
- Schools +3.9/10.0
- Livability +3.5/5.0
- Rent growth +2.5/5.0
- Condition / age +2.5/5.0
$249,900
🖨 Deal sheet 📄 Offer letter ✓ Due diligence
Listing remarks
Four bedroom, 2.5-bath home nestled in the desirable Oaks of Atascocita and offers a versatile layout ideal for both daily living and entertaining. Upon entry, you’re greeted by a formal dining room on the left, while a flexible space on the right can easily serve as a home office, second living area, or game room. The first floor features an open-concept design with seamless trendy flooring throughout. The kitchen is equipped with white cabinetry and flows into the family room, which overlooks the backyard and includes a wet bar & cozy fireplace. Step outside to a spacious backyard complete with a large pool, perfect for hosting summer gatherings. Additional highlights include
Key facts
- 8,280 sq ft lot
- 2 garage spots
- Pool
Property features AI
Finance
- HOA & community: Association: Goodwin & Co; Annual association fee $550; Community features include curbs
Exterior
- Parking: Detached garage; 2 garage spaces
- Utilities: Public water; Public sewer
- Home design: Residential property; Full ownership; Slab foundation; Composition roof; Built in 1976; Living area about 2,599
- Construction: Cement siding and wood siding
- Exterior features: Fenced backyard; Subdivision lot; Concrete road access; Private in-ground pool
Interior
- Kitchen: Dishwasher; Electric range; Microwave; Garbage disposal; Butler's pantry / pantry (approx. 10 x 4)
- Bedrooms: Primary bedroom (second floor) approximately 14 x 20; Bedroom (second floor) approximately 12 x 11; Bedroom (second floor) approximately 10.5 x 13; Bedroom (second floor) approximately 10.5 x 13; Up to 4 possible bedrooms
- Flooring: Carpet; Laminate
- Bathrooms: 2 full bathrooms; 1 half bathroom
- Heating & cooling: Central heating (electric); Central air conditioning (electric)
- Interior features: Gas fireplace with gas log; Tub with shower; Vanity; Ceiling fans; Kitchen/dining combo; Programmable thermostat; 10 total rooms
- Laundry & utility: Washer hookup; Electric dryer hookup; Gas dryer hookup; Utility room (first floor) approx. 8 x 8
Neighborhood map
What this means for you Summary
Snapshot
- This is a 4-bed/2.5-bath single-family listed at $250k.
Deal economics
- At list price, monthly cash flow is $323 ($4k/yr) — positive.
- The deal already cash-flows at list — no discount required.
- Meets the 1% rule at list price ($3k rent vs $250k).
- Recommended offer: $246k (1.5% below list) — sets the bar for market timing.
- Cap rate 7.8% vs local median 4.1% in Atascocita — top-decile yield for the area; either an underpriced asset or a hidden risk that comps aren't pricing in. Stress-test before assuming the spread holds.
Location & tenants
- Location reads 70/100 on livability (#346 in TX) — a middle-class / working-renter tenant base. Strengths: employment A+, cost of living A+, housing A+; Watch: amenities F, commute F, health & safety F.
- Humble ISD (urban): math 38% / reading 44% proficiency, ranked #262 of 826 in TX (top 32%) — families likely to look elsewhere, expect single-tenant / working-renter base with shorter leases.
- Zoned schools: Timberwood Middle (math 31% / reading 46%, grade F, #704 of 1,662 statewide, top 43%, 1,094 students, 54% FRL); Atascocita H S (math 41% / reading 52%, grade D-, #621 of 1,632 statewide, top 38%, 3,829 students, 42% FRL) — zoned schools average 48% FRL vs 32% district-wide (16 pts higher); higher-poverty schools than district average — tighter screening recommended.
- Market conditions: Rents flat; 669 active listings in the ZIP; 15 comparable units currently listed for rent nearby; rentals at typical pace (median 24d on market — plan ~3-4 weeks tenant-placement turnaround); 47% of comp listings sitting > 30 days — soft ceiling on asking rent; high-income renter base; 29,883 units permitted in Harris County in 2024 (8,621 in 5+ unit buildings).
Forward outlook
- Local home prices are declining (-0.9%/yr); year-one equity from $2k of loan paydown is wiped out by about $2k of value loss. Plan a longer hold.
- Harris County population projected at +47% by 2050 — long-run rental-demand tailwind backs the buy-and-hold thesis.
Negotiation context
- It's been on market 17 days — a 2% lower offer ($246k) is reasonable based on typical stale-listing flexibility.
- Current owner paid $200k; 25% above their basis — modest negotiation headroom, anchor on the comps not their cost.
Risks & watch-outs
- Climate carrying-cost: severe wind risk, 99% chance of damaging wind over 30y; extreme-heat days projected 7→24/yr by 2055 (HVAC capex compounding) — expect insurance premiums to compound above CPI over the hold.
Questions for the listing agent
- Built in 1976 — when were the roof, HVAC, electrical panel, plumbing, and water heater last replaced?
- What does the HOA fee cover, when was the last increase, and are there any pending special assessments or reserve-fund shortfalls?
- Is there a deadline driving the sale (1031 exchange, divorce, estate, relocation)? That informs how much negotiation room exists.
- What's the average days-on-market for RENTAL listings here right now (not sales)? A rising rental-DOM trend means longer vacancies and softer asking-rent achievability than the comps imply.
- What's the recent tenant-quality profile in this submarket — average credit score on applications, eviction rate, late-payment / NSF rate, and stable-employment percentage? A property-management company in the area should have these aggregated.
- How much new for-sale + rental construction is in the pipeline within 1–3 miles? Heavy new supply typically softens prices + rents 12–24 months out; constrained supply supports both.
Investment metrics
- 1% rule
- 1.14% ✓
- Cap rate
- 7.84%
- Cash-on-cash
- 5.54%
- DSCR
- 1.25
- GRM
- 7.3
CMA / ARV
- ARV (median comp)
- $275,142
- List price
- $249,900
- Delta
- -9.17%
- Verdict
- FAIR
- Comps
- 20 within 1.0 mi
Show comp detail 12 sales within ~0.75 mi
| Address | Dist | Beds/Ba | Sqft | Sold | Price | $/sf | Match |
|---|---|---|---|---|---|---|---|
| 5726 Green Timbers Dr | 0.26mi | 4/2.5 | 2,592 (-0%) | 1mo | $249,999 | $96 | 87 |
| 19518 Alinawood Dr | 0.29mi | 4/2.5 | 2,634 (+1%) | 1mo | $265,000 | $101 | 83 |
| 5527 Enchanted Timbers Dr | 0.07mi | 4/2.5 | 2,348 (-10%) | 1mo | $279,900 | $119 | 80 |
| 5606 Timbers Trail Dr | 0.39mi | 4/2.5 | 2,498 (-4%) | 1mo | $255,000 | $102 | 75 |
| 5535 Enchanted Timbers Dr | 0.09mi | 4/2.5 | 2,931 (+13%) | 2mo | $265,900 | $91 | 73 |
| 5706 Upper Lake Dr | 0.47mi | 4/2.5 | 2,667 (+3%) | 1mo | $285,000 | $107 | 72 |
| 19311 Forest Fern Ct | 0.16mi | 4/2.5 | 2,276 (-12%) | 0mo | $299,900 | $132 | 72 |
| 5531 Flax Bourton St | 0.48mi | 4/2.5 | 2,318 (-11%) | 1mo | $285,000 | $123 | 59 |
| 19102 Milloak Dr | 0.73mi | 4/2.5 | 2,490 (-4%) | 2mo | $315,000 | $127 | 58 |
| 5811 Forest Timbers Dr | 0.53mi | 4/2.5 | 2,292 (-12%) | 1mo | $264,500 | $115 | 55 |
| 5422 Enchanted Mist Dr | 0.57mi | 4/2.5 | 2,876 (+11%) | 2mo | $299,900 | $104 | 54 |
| 6007 Summer Oaks Dr | 0.71mi | 4/2.0 | 2,821 (+8%) | 1mo | $299,500 | $106 | 50 |
Match score weights: distance 35% · size 25% · config 20% · recency 20%. Top-matched comps best support the ARV.
Projected returns pro-forma
-0.95% appreciation · 0.09% rent growth · sell at horizon
- IRR
- -1.9%
- Equity multiple
- 0.92×
- Total profit
- $-5,659
- Equity at exit
- $60,873
- IRR
- 2.0%
- Equity multiple
- 1.17×
- Total profit
- $11,817
- Equity at exit
- $64,391
Cash invested: $69,972 (down + closing). Projections, not guarantees.
Landlord ↔ Tenant lean methodology
- Overall (STATE)
- 87 Strongly Landlord-Friendly
- State Texas
- 87 Strongly Landlord-Friendly · R+5
- County
- — inherits STATE
- City
- — inherits STATE
ZIP-level market 77346
- Home prices YoY
- -0.4%
- Rents YoY
- 0.1%
- Active inventory
- 669
- Price-to-rent
- 7.3×
Monthly cashflow live
- Estimated rent
- $2,839 high interval (Pro) →
- Mortgage (P&I)
- −$1,311
- Tax from tax record
- −$459 /mo · $5,511/yr
- Insurance
- −$104
- HOA
- −$46
- Vacancy / Maint / Mgmt
- −$596
- Net cashflow
- $323
Break-even live
UW: 25.0% down · 7.5% · 30yr · 1.5% tax · 5.0% vac · 8.0% maint · 8.0% mgmt
Financing live
Cash to close
- Down payment
- $62,475
- Closing costs
- $7,497
- Reserves months
- —
- Total cash needed
- —
Loan-product check · same deal, 3 products live
Conventional
25% down · 7.5% · 30yr
- Down + closing
- —
- Monthly P&I
- —
- Monthly cashflow
- —
- DSCR
- —
- Eligible?
- —
Personal DTI + credit; lowest rate.
DSCR
20% down · 8.5% · 30yr
- Down + closing
- —
- Monthly P&I
- —
- Monthly cashflow
- —
- DSCR
- —
- Eligible?
- —
No personal income docs; deal must DSCR.
Hard money
10% down · 12.0% · 12mo
- Down + closing
- —
- Monthly P&I
- —
- Monthly cashflow
- —
- DSCR
- —
- Eligible?
- —
Short-term bridge; refi at stabilization.
Rent comps 15 comps
| Address | Beds | Baths | Sqft | Rent | $/sqft | DOM | Units | Dist |
|---|---|---|---|---|---|---|---|---|
| 19322 Forest Fern Ct Humble, TX | 4.0 | 2.5 | 2626 | $3,500 | $1.33 | 43d | 1 | 0.15mi |
| 5303 Hill Timbers Dr Humble, TX | 3.0 | 2.0 | 1884 | $2,050 | $1.09 | 43d | 1 | 0.53mi |
| 18406 S Roaring River Ct Humble, TX | 4.0 | 4.0 | 3319 | $3,600 | $1.08 | 43d | 1 | 1.02mi |
| 18810 Woodbreeze Dr Humble, TX | 4.0 | 2.5 | 2200 | $2,279 | $1.04 | 24d | 1 | 1.17mi |
| 12214 Landsdown Ridge Way Humble, TX | 4.0 | 2.5 | 2389 | $2,165 | $0.91 | 11d | 1 | 1.21mi |
| 20914 Lake Park Trl Humble, TX | 5.0 | 2.5 | 2462 | $2,460 | $1.00 | 5d | 1 | 1.25mi |
| 18810 Summer Anne Dr Humble, TX | 4.0 | 2.5 | 3000 | $2,376 | $0.79 | 43d | 1 | 1.25mi |
| 18222 Noble Forest Dr Humble, TX | 4.0 | 2.5 | 3265 | $2,851 | $0.87 | 5d | 1 | 1.26mi |
| 20906 Greenfield Trl Humble, TX | 4.0 | 3.0 | 2603 | $2,200 | $0.85 | 43d | 1 | 1.28mi |
| 20823 Water Point Trl Humble, TX | 4.0 | 3.5 | 2550 | $2,525 | $0.99 | 22d | 1 | 1.33mi |
| 20618 Carmine Oak Ct Humble, TX | 3.0 | 2.0 | 2087 | $2,195 | $1.05 | 43d | 1 | 1.33mi |
| 7131 Maple Walk Dr Humble, TX | 3.0 | 2.0 | 1808 | $1,895 | $1.05 | 5d | 1 | 1.35mi |
| 18123 Noble Forest Dr Humble, TX | 4.0 | 2.5 | 2328 | $2,595 | $1.11 | 5d | 1 | 1.39mi |
| 18103 Yellowstone Trl Humble, TX | 4.0 | 2.5 | 2602 | $2,371 | $0.91 | 43d | 1 | 1.41mi |
| 20707 Redbud Trl Humble, TX | 3.0 | 2.5 | 1965 | $2,450 | $1.25 | 22d | 1 | 1.44mi |
HOA detail
- Monthly dues
- $46 · $552/yr
- Likely covers
- pool
Listing history 4 events
-
2026-05-07$249,900 Active 963-char remark
-
2024-11-04soldstatus $200,000
-
1998-09-21soldstatus
-
1998-09-01soldstatus $94,900
ⓘ Source: listings_history table (triggers on properties + properties_extension) + one-shot
backfill from property_details.listing_events for pre-trigger history.
Tax reassessment forecast TX · Resets to sale price
- Current annual tax
- $5,511 · $459/mo
- Projected year-2 tax
- $5,511 · $459/mo
- Expected delta
- $0/yr ($0/mo · 0.0%)
ⓘ Screening estimate from a state-policy table — verify with the county assessor before closing.
Climate risk First Street
- Flood 1/10 Low FEMA zone X (unshaded) · 0% chance over 30 yrs
- Wildfire 2/10 Low
- Heat 9/10 Extreme 7 d/yr ≥110°F today · 24 d/yr by 30 yrs out
- Wind 9/10 Extreme 99% chance of damaging wind over 30 yrs
- Air quality 3/10 Moderate 3 unhealthy d/yr today · 3 by 30 yrs out
Nearby sold comps map
Loading sold comps map…
Walkable amenities ~0.75 mi
Loading nearby amenities…
Taxation est. · year 1
- Rental income
- $34,066
- − Mortgage interest
- −$13,998
- − Property taxes
- −$5,511
- − Insurance
- −$1,250
- − Repairs & maintenance
- −$2,725
- − Management
- −$2,725
- − HOA
- −$552
- − Depreciation
- −$7,270
- Taxable income
- $34
- Est. tax owed @ 24.0%
- −$8
- After-tax cash flow
- $3,865/yr
For passive investors: Depreciation is non-cash, so a rental often shows a tax loss while cash-flowing — sheltering income. Rental losses are passive: they offset passive income freely, and up to $25,000/yr can offset ordinary (W-2) income if you actively participate and your MAGI is under $100k (phasing out to $0 by $150k); unused losses carry forward. On sale, claimed depreciation is recaptured at up to 25%, and gains may owe capital-gains tax (a 1031 exchange can defer both). Figures are a year-1 estimate at your 24.0% rate — not tax advice; consult a CPA.
Schools (NCES district)
- District
- Humble ISD
- NCES district ID
- 4823910
- Math proficiency
- 38% ▼ -11.00%
- Reading proficiency
- 44% ▼ -7.00%
- Median HH income
- $83,946
- Composite
- 38.55/100
- National rank
- #4171
- State rank
- #262 of 826 in TX
Livability — Atascocita
- Score
- 70/100
- State rank
- #346
- US rank
- #7586
Category grades
Schools grade is shown separately in the Schools card above.
Census & demographics
- Census place
- Atascocita, TX
- County
- Harris County · 4,702,590 people
- City population
- 79,538
- Metro
- Houston-The Woodlands-Sugar Land, TX
- Population (ZIP)
- 79,538
- Household income
- $122,241
- Rent vs Own
- Severe rent burden
- 1072.0
Population outlook (Harris County) Hauer SSP2
- Today (2025)
- 5,571,493 people
- By 2030
- 6,089,821 · +9.3%
- By 2040
- 7,142,806 · +28.2%
- By 2050
- 8,185,864 · +46.9%
- By 2075
- 10,574,329 · +89.8%
- By 2100
- 12,109,958 · +117.4%
Race, ethnicity, and origin ACS 2023
- Neighborhood character
- Diverse neighborhood (Simpson 0.70)
- Race & ethnicity
- White 42% Hispanic / Latino 28% Black 21% Two or more races 18% Asian 4%
- Hispanic origin (detail)
- Mexican 20% Puerto Rican 2%
- Common ancestry
- Lithuanian 4% Slovak 1% Italian 1%
- Foreign-born
- 10% · Canada, Vietnam, China
- Languages at home
- 78% English-only · Spanish 17% Other Indo-European 1% German/W. Germanic 1%
Political lean MEDSL · Harris
- 2024 margin
- Lean D (+5.5) · D 52.0% · R 46.4% · Other 1.6%
- 2008→2024 swing
- +3.9pp toward D · 2008: 1.6pp · 2024: 5.5pp
- All cycles
- 2024: D+5.5 2020: D+13.3 2016: D+12.4 2012: D+0.1 2008: D+1.6
Not yet ingested
- Civics
- —
Market trends
- HPI YoY
- ▼ -0.95%
- Current HPI
- 218.0478
- Rent YoY
- ▲ 0.09%
- Metro
- Houston-The Woodlands-Sugar Land, TX
- State GDP YoY
- ▲ 3.95%
- F500 in state
- 110
Industry mix (Fortune 500 HQ in TX)
| Industry | F500 HQs | Revenue |
|---|---|---|
| Energy | 16 | $1,198B |
|
||
| Technology | 5 | $198B |
|
||
| Engineering / Construction | 4 | $72B |
|
||
| Energy Services | 3 | $60B |
|
||
| Utilities | 3 | $41B |
|
||
| Healthcare | 2 | $330B |
|
||
Price history
+163.3% since first listed6 events — show timeline
- 2026-05-25 Pending — HARMLS
- 2026-05-19 Pending — HARMLS
- 2026-05-07 Listed $249,900 HARMLS
- 2024-11-04 Sold (Public Records) $200,000 Public Records
- 1998-09-21 Sold (Public Records) — Public Records
- 1998-09-01 Sold (Public Records) $94,900 Public Records
Property tax history
+2.0%/yrLatest (2025): $5,511 · -6.3% YoY. Source: county tax records.
Cash-flow waterfall
monthlySold comps — $/sqft
last 12 mo · ≤1 miLoading sold comps…