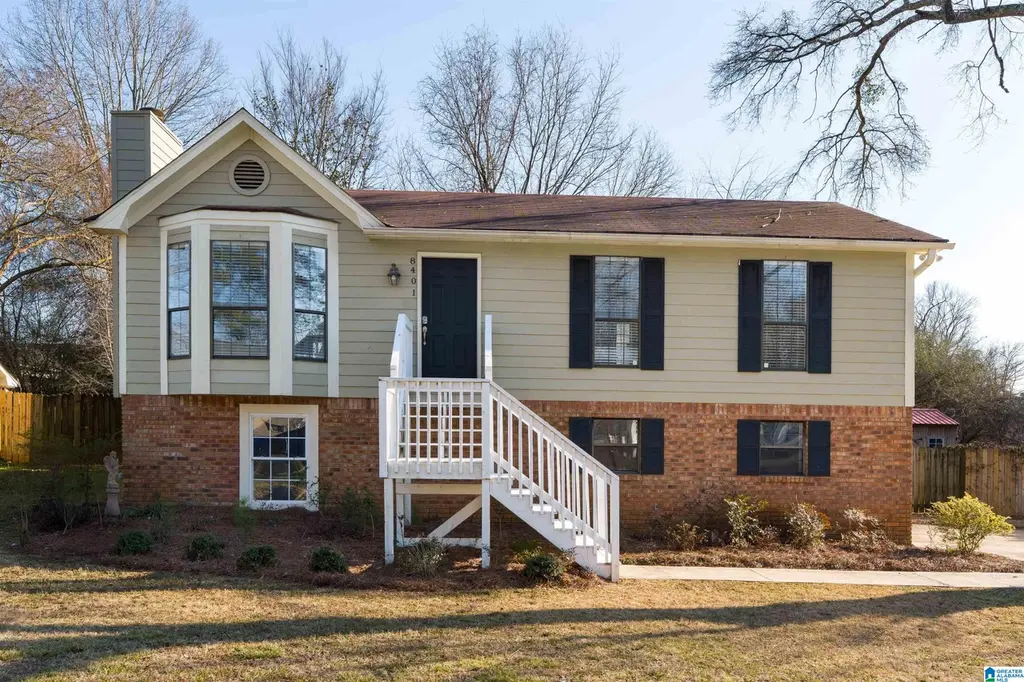
8401 Lanewood Cir · Leeds, AL
Flood risk 8/10 · Major
- FEMA flood zone
- X (unshaded)
- Chance of flooding over 30 yrs
- 0.99%
- Est. flood insurance / yr
- $507 – $1,088
Fire risk 4/10 · Minor
- Est. fire insurance / yr
- $916 – $1,700
Heat risk 6/10 · Moderate
- Hot days now (above 106°F)
- 7 days/yr
- Hot days in 30 yrs
- 20 days/yr
Wind risk 6/10 · Moderate
- Chance of severe wind over 30 yrs
- 27.0%
Air-quality risk 4/10 · Minor
- Unhealthy air days now
- 3 days/yr
- Unhealthy air days in 30 yrs
- 7 days/yr
Risk factors via First Street. Map © Google.
Why this score? — see what drove the F grade
The composite is a weighted blend of 9 inputs, each scored 0–100. Each bar is that input's sub-score; the figure is the points it added to the 100-point composite (weight × sub-score).
- Cash flow +8.2/30.0
- ARV discount +7.4/15.0
- Livability +3.0/5.0
- Schools +2.8/10.0
- Rent growth +2.5/5.0
- Condition / age +2.5/5.0
- DSCR +2.2/10.0
- 1% rule +1.5/10.0
- Appreciation +0.0/10.0
$254,900
🖨 Deal sheet 📄 Offer letter ✓ Due diligence
Listing remarks MLS
Welcome to 8401 Lanewood Circle! This beautiful 4-bedroom, 3-bath home offers comfort, style, and space for everyday living. The inviting living room features a stone fireplace with built-in shelving. The kitchen includes an eat-in area, stainless steel appliances, granite countertops, and a tile backsplash. Spacious primary suite. Step outside to the open porch overlooking the fenced backyard, perfect for entertaining or unwinding. Complete with a 1-car garage and additional storage building. Schedule your showing today!
Key facts
- 0.28 acre lot
- Garage
- Built 1986
Neighborhood map
What this means for you Summary
Snapshot
- This is a 4-bed/2.0-bath single-family listed at $255k.
Deal economics
- At list price, monthly cash flow is $-303 ($-4k/yr) — negative.
- To cash-flow at today's rent, offer at most $201k (21.0% below list).
- To meet the 1% rule (rent ≥ 1% of price), the offer needs to be $166k (34.9% below list).
- Recommended offer: $166k (34.9% below list) — sets the bar for 1% rule.
- Cap rate 5.2% vs local median 4.2% in Leeds — meaningfully above typical; check what's discounted (condition, days-on-market, listing class) to confirm the premium yield is real.
Location & tenants
- Location reads 60/100 on livability (#286 in AL) — a middle-class / working-renter tenant base. Strengths: cost of living A+, housing A+, employment B+; Watch: schools C-, crime D+, amenities F.
- Leeds City (suburban): math 20% / reading 45% proficiency, ranked #51 of 129 in AL (top 40%) — families likely to look elsewhere, expect single-tenant / working-renter base with shorter leases.
- Market conditions: 158 active listings in the ZIP; 3 comparable units currently listed for rent nearby; rentals leasing fast (median 2d on market — plan ~1-2 weeks tenant-placement turnaround); 557 units permitted in St. Clair County in 2024 (0 in 5+ unit buildings).
Forward outlook
- Local home prices are declining (-3.0%/yr); year-one equity from $2k of loan paydown is wiped out by about $8k of value loss. Plan a longer hold.
- St. Clair County population projected at +11% by 2050 — modest demand growth; plan on rents tracking national, not racing it.
Negotiation context
- It's been on market 133 days — a 12% lower offer ($224k) is reasonable based on typical stale-listing flexibility.
- 3 sale attempts since 10y ago with the ask held roughly flat each time — persistent listings suggest the price (not the market) is what's stuck; bring a comps-based counter.
- Current owner paid $156k; list at $255k implies a 63% gain — meaningful room to come down on a strong offer.
Risks & watch-outs
- Watch-outs: flood insurance adds $66/mo.
- Climate carrying-cost: severe flood risk; major wind risk, 27% chance of damaging wind over 30y; extreme-heat days projected 7→20/yr by 2055 (HVAC capex compounding) — expect insurance premiums to compound above CPI over the hold.
Questions for the listing agent
- What do current leases actually rent for vs. the listed asking? Can we see a recent rent roll and the last 12 months of T-12 income?
- It's been on market 133 days. Have you received any prior offers? Is the seller open to a 35% concession, seller financing, or rate buy-down credit?
- What's the actual annual flood-insurance premium (NFIP or private), and is the property in a SFHA with mandatory coverage?
- Why hasn't it sold? Are there any deal-killer items the seller is aware of (foundation, flood, title, zoning, code violations)?
- Is there a deadline driving the sale (1031 exchange, divorce, estate, relocation)? That informs how much negotiation room exists.
- Crime grade is D in this area — have there been break-ins, vandalism, or insurance claims at this property in the last 3 years? What carrier currently insures it and at what premium?
- The area grade is low — what's the realistic commute time and amenity access for the typical tenant pool here? Any planned neighborhood developments (good or bad) we should know about?
- What's the average days-on-market for RENTAL listings here right now (not sales)? A rising rental-DOM trend means longer vacancies and softer asking-rent achievability than the comps imply.
- What's the recent tenant-quality profile in this submarket — average credit score on applications, eviction rate, late-payment / NSF rate, and stable-employment percentage? A property-management company in the area should have these aggregated.
- How much new for-sale + rental construction is in the pipeline within 1–3 miles? Heavy new supply typically softens prices + rents 12–24 months out; constrained supply supports both.
Investment metrics
- 1% rule
- 0.65% ✗
- Cap rate
- 5.18%
- Cash-on-cash
- -3.98%
- DSCR
- 0.82
- GRM
- 12.8
CMA / ARV
- ARV (median comp)
- $254,054
- List price
- $254,900
- Delta
- 0.33%
- Verdict
- FAIR
- Comps
- 20 within 1.0 mi
Show comp detail 12 sales within ~0.75 mi
| Address | Dist | Beds/Ba | Sqft | Sold | Price | $/sf | Match |
|---|---|---|---|---|---|---|---|
| 8425 Lanewood Cir | 0.09mi | 3/2.0 (-1) | 1,034 (-1%) | 4mo | $160,000 | $155 | 87 |
| 8409 Lanewood Cir | 0.03mi | 3/2.0 (-1) | 1,050 (+1%) | 9mo | $222,200 | $212 | 84 |
| 1609 Ray St | 0.35mi | 3/2.0 (-1) | 1,064 (+2%) | 8mo | $80,000 | $75 | 68 |
| 2025 Phillips Cir | 0.38mi | 3/2.0 (-1) | 1,092 (+5%) | 2mo | $210,000 | $192 | 68 |
| 8148 Lyle Ave | 0.20mi | 3/1.0 (-1) | 989 (-5%) | 8mo | $179,900 | $182 | 67 |
| 1900 Self St | 0.41mi | 3/1.0 (-1) | 1,037 (-0%) | 7mo | $175,500 | $169 | 65 |
| 1824 Linden St | 0.17mi | 3/1.5 (-1) | 1,080 (+4%) | 21mo | $250,000 | $231 | 61 |
| 8216 Franklin Ave | 0.43mi | 3/2.0 (-1) | 1,048 (+1%) | 16mo | $140,000 | $134 | 60 |
| 8110 Skinner Ave | 0.36mi | 3/1.0 (-1) | 1,172 (+13%) | 1mo | $195,000 | $166 | 52 |
| 8604 Blair St | 0.72mi | 3/1.5 (-1) | 1,154 (+11%) | 3mo | $198,000 | $172 | 38 |
| 1801 Whitmire St | 0.47mi | 3/1.0 (-1) | 1,188 (+14%) | 18mo | $169,900 | $143 | 30 |
| 8608 Blair St | 0.74mi | 3/1.0 (-1) | 1,188 (+14%) | 8mo | $210,000 | $177 | 26 |
Match score weights: distance 35% · size 25% · config 20% · recency 20%. Top-matched comps best support the ARV.
Projected returns pro-forma
-3.0% appreciation · 3.0% rent growth · sell at horizon
- IRR
- -25.0%
- Equity multiple
- 0.15×
- Total profit
- $-60,684
- Equity at exit
- $38,006
- IRR
- -21.1%
- Equity multiple
- -0.09×
- Total profit
- $-77,980
- Equity at exit
- $22,039
Cash invested: $71,372 (down + closing). Projections, not guarantees.
Landlord ↔ Tenant lean methodology
- Overall (STATE)
- 90 Strongly Landlord-Friendly
- State Alabama
- 90 Strongly Landlord-Friendly · R+15
- County
- — inherits STATE
- City
- — inherits STATE
ZIP-level market 35094
- Home prices YoY
- -9.7%
- Active inventory
- 158
- Price-to-rent
- 12.8×
Monthly cashflow live
- Estimated rent
- $1,658 medium interval (Pro) →
- Mortgage (P&I)
- −$1,337
- Tax from tax record
- −$104 /mo · $1,248/yr
- Insurance
- −$106
- Flood insurance flood zone
- −$66 /mo · $798/yr
- HOA
- −$0
- Vacancy / Maint / Mgmt
- −$348
- Net cashflow
- $-303
Break-even live
UW: 25.0% down · 7.5% · 30yr · 1.5% tax · 5.0% vac · 8.0% maint · 8.0% mgmt
Financing live
Cash to close
- Down payment
- $63,725
- Closing costs
- $7,647
- Reserves months
- —
- Total cash needed
- —
Loan-product check · same deal, 3 products live
Conventional
25% down · 7.5% · 30yr
- Down + closing
- —
- Monthly P&I
- —
- Monthly cashflow
- —
- DSCR
- —
- Eligible?
- —
Personal DTI + credit; lowest rate.
DSCR
20% down · 8.5% · 30yr
- Down + closing
- —
- Monthly P&I
- —
- Monthly cashflow
- —
- DSCR
- —
- Eligible?
- —
No personal income docs; deal must DSCR.
Hard money
10% down · 12.0% · 12mo
- Down + closing
- —
- Monthly P&I
- —
- Monthly cashflow
- —
- DSCR
- —
- Eligible?
- —
Short-term bridge; refi at stabilization.
Rent comps 3 comps
| Address | Beds | Baths | Sqft | Rent | $/sqft | DOM | Units | Dist |
|---|---|---|---|---|---|---|---|---|
| 1609 Ray St Leeds, AL | 3.0 | 2.0 | 1064 | $1,200 | $1.13 | 2d | 1 | 0.32mi |
| 8665 Mohring Pl Leeds, AL | 4.0 | 2.0 | 1459 | $1,895 | $1.30 | 1d | 1 | 0.87mi |
| 1400 Illinois St Leeds, AL | 3.0 | 1.5 | 995 | $1,200 | $1.21 | 19d | 1 | 1.10mi |
Listing history 34 events
-
2026-06-18days on market $254,900 Active 133 DOM
-
2026-06-17days on market $254,900 Active 132 DOM
-
2026-06-16days on market $254,900 Active 131 DOM
-
2026-06-15days on market $254,900 Active 130 DOM
-
2026-06-13days on market $254,900 Active 128 DOM
-
2026-06-10days on market $254,900 Active 125 DOM
-
2026-06-09days on market $254,900 Active 124 DOM
-
2026-06-08days on market $254,900 Active 123 DOM
-
2026-06-07days on market $254,900 Active 122 DOM
-
2026-06-05days on market $254,900 Active 119 DOM
-
2026-06-03days on market $254,900 Active 118 DOM
-
2026-06-02days on market $254,900 Active 117 DOM
-
2026-06-01days on market $254,900 Active 116 DOM
-
2026-05-31days on market $254,900 Active 115 DOM
-
2026-03-24price $254,900 527-char remark
Show marketing remark (527 chars)
Welcome to 8401 Lanewood Circle! This beautiful 4-bedroom, 3-bath home offers comfort, style, and space for everyday living. The inviting living room features a stone fireplace with built-in shelving. The kitchen includes an eat-in area, stainless steel appliances, granite countertops, and a tile backsplash. Spacious primary suite. Step outside to the open porch overlooking the fenced backyard, perfect for entertaining or unwinding. Complete with a 1-car garage and additional storage building. Schedule your showing today!
-
2026-03-06price $259,900 527-char remark
Show marketing remark (527 chars)
Welcome to 8401 Lanewood Circle! This beautiful 4-bedroom, 3-bath home offers comfort, style, and space for everyday living. The inviting living room features a stone fireplace with built-in shelving. The kitchen includes an eat-in area, stainless steel appliances, granite countertops, and a tile backsplash. Spacious primary suite. Step outside to the open porch overlooking the fenced backyard, perfect for entertaining or unwinding. Complete with a 1-car garage and additional storage building. Schedule your showing today!
-
2026-02-06$261,000 Active 527-char remark
Show marketing remark (527 chars)
Welcome to 8401 Lanewood Circle! This beautiful 4-bedroom, 3-bath home offers comfort, style, and space for everyday living. The inviting living room features a stone fireplace with built-in shelving. The kitchen includes an eat-in area, stainless steel appliances, granite countertops, and a tile backsplash. Spacious primary suite. Step outside to the open porch overlooking the fenced backyard, perfect for entertaining or unwinding. Complete with a 1-car garage and additional storage building. Schedule your showing today!
-
2026-01-29historical $261,000 527-char remark
Show marketing remark (527 chars)
Welcome to 8401 Lanewood Circle! This beautiful 4-bedroom, 3-bath home offers comfort, style, and space for everyday living. The inviting living room features a stone fireplace with built-in shelving. The kitchen includes an eat-in area, stainless steel appliances, granite countertops, and a tile backsplash. Spacious primary suite. Step outside to the open porch overlooking the fenced backyard, perfect for entertaining or unwinding. Complete with a 1-car garage and additional storage building. Schedule your showing today!
-
2024-01-21historical $1,550
-
2024-01-12price $1,550
-
2024-01-04price $1,600
-
2023-12-28price $1,695
-
2023-12-07price $1,795
-
2023-11-29price $1,950
-
2023-11-16price $2,000
-
2023-11-04price $249,000
-
2023-11-04$2,500
-
2023-10-26price $254,000
-
2023-07-24soldstatus $156,000
-
2017-03-17soldstatus $131,000 Sold
-
2017-03-17soldstatus $131,000
-
2017-01-31historical Contingent
-
2017-01-17price $148,500
-
2016-11-29$154,500 Active
ⓘ Source: listings_history table (triggers on properties + properties_extension) + one-shot
backfill from property_details.listing_events for pre-trigger history.
Tax reassessment forecast AL · Resets to sale price
- Current annual tax
- $1,248 · $104/mo
- Projected year-2 tax
- $1,248 · $104/mo
- Expected delta
- $0/yr ($0/mo · 0.0%)
ⓘ Screening estimate from a state-policy table — verify with the county assessor before closing.
Climate risk First Street
- Flood 8/10 Severe FEMA zone X (unshaded) · 99% chance over 30 yrs
- Wildfire 4/10 Moderate
- Heat 6/10 Major 7 d/yr ≥106°F today · 20 d/yr by 30 yrs out
- Wind 6/10 Major 27% chance of damaging wind over 30 yrs
- Air quality 4/10 Moderate 3 unhealthy d/yr today · 7 by 30 yrs out
Nearby sold comps map
Loading sold comps map…
Walkable amenities ~0.75 mi
Loading nearby amenities…
Taxation est. · year 1
- Rental income
- $19,901
- − Mortgage interest
- −$14,278
- − Property taxes
- −$1,248
- − Insurance
- −$2,072
- − Repairs & maintenance
- −$1,592
- − Management
- −$1,592
- − Depreciation
- −$7,415
- Taxable loss
- −$8,297
- Est. tax savings @ 24.0%
- +$1,991
- After-tax cash flow
- $-1,648/yr
For passive investors: Depreciation is non-cash, so a rental often shows a tax loss while cash-flowing — sheltering income. Rental losses are passive: they offset passive income freely, and up to $25,000/yr can offset ordinary (W-2) income if you actively participate and your MAGI is under $100k (phasing out to $0 by $150k); unused losses carry forward. On sale, claimed depreciation is recaptured at up to 25%, and gains may owe capital-gains tax (a 1031 exchange can defer both). Figures are a year-1 estimate at your 24.0% rate — not tax advice; consult a CPA.
Schools (NCES district)
- District
- Leeds City
- NCES district ID
- 0100011
- Math proficiency
- 20% ▼ -25.00%
- Reading proficiency
- 45% ▲ 3.00%
- Median HH income
- $50,367
- Composite
- 28.21/100
- National rank
- #6803
- State rank
- #51 of 129 in AL
Livability — Leeds
- Score
- 60/100
- State rank
- #286
- US rank
- #18674
Category grades
Schools grade is shown separately in the Schools card above.
Census & demographics
- Census place
- Leeds, AL
- County
- Jefferson County · 527,445 people
- City population
- 14,854
- Metro
- Birmingham-Hoover, AL
- Population (ZIP)
- 14,854
- Household income
- $74,625
- Rent vs Own
- Severe rent burden
- 248.0
Population outlook (St. Clair County) Hauer SSP2
- Today (2025)
- 94,158 people
- By 2030
- 97,008 · +3.0%
- By 2040
- 101,615 · +7.9%
- By 2050
- 104,537 · +11.0%
- By 2075
- 109,350 · +16.1%
- By 2100
- 106,785 · +13.4%
Race, ethnicity, and origin ACS 2023
- Neighborhood character
- Predominantly White (77%)
- Race & ethnicity
- White 77% Black 12% Hispanic / Latino 9% Two or more races 7%
- Hispanic origin (detail)
- Mexican 5% Puerto Rican 2%
- Common ancestry
- Slovak 3% Serbian 2% Italian 1%
- Foreign-born
- 3% · Canada
- Languages at home
- 92% English-only · Spanish 8%
Political lean MEDSL · St. Clair
- 2024 margin
- Solid R (+64.1) · D 17.6% · R 81.7%
- 2008→2024 swing
- -0.9pp no change · 2008: -63.2pp · 2024: -64.1pp
- All cycles
- 2024: R+64.1 2020: R+64.0 2016: R+68.6 2012: R+66.1 2008: R+63.2
Not yet ingested
- Civics
- —
Market trends
- HPI YoY
- ▼ -23.99%
- Current HPI
- 223.9527
- Rent YoY
- —
- Metro
- Birmingham-Hoover, AL
- State GDP YoY
- ▲ 2.94%
- F500 in state
- 4
Industry mix (Fortune 500 HQ in AL)
| Industry | F500 HQs | Revenue |
|---|---|---|
| Financial Services | 1 | $8B |
|
||
| Healthcare | 1 | $5B |
|
||
Price history
+65.0% since first listed20 events — show timeline
- 2026-03-24 Price Changed $254,900 Greater Alabama MLS
- 2026-03-06 Price Changed $259,900 Greater Alabama MLS
- 2026-02-06 Listed $261,000 Greater Alabama MLS
- 2026-01-29 Coming Soon $261,000 Greater Alabama MLS
- 2024-01-21 Rental Removed $1,550 APPFOLIO
- 2024-01-12 Price Changed $1,550 APPFOLIO
- 2024-01-04 Price Changed $1,600 APPFOLIO
- 2023-12-28 Price Changed $1,695 APPFOLIO
- 2023-12-07 Price Changed $1,795 APPFOLIO
- 2023-11-29 Price Changed $1,950 APPFOLIO
- 2023-11-16 Price Changed $2,000 APPFOLIO
- 2023-11-04 Price Changed $249,000 Greater Alabama MLS
- 2023-11-04 Listed for Rent $2,500 APPFOLIO
- 2023-10-26 Price Changed $254,000 Greater Alabama MLS
- 2023-07-24 Sold (Public Records) $156,000 Public Records
- 2017-03-17 Sold (Public Records) $131,000 Public Records
- 2017-03-17 Sold (MLS) $131,000 Greater Alabama MLS
- 2017-01-31 Contingent — Greater Alabama MLS
- 2017-01-17 Price Changed $148,500 Greater Alabama MLS
- 2016-11-29 Listed $154,500 Greater Alabama MLS
Property tax history
+11.6%/yrLatest (2024): $1,248 · +116.3% YoY. Source: county tax records.
Cash-flow waterfall
monthlySold comps — $/sqft
last 12 mo · ≤1 miLoading sold comps…