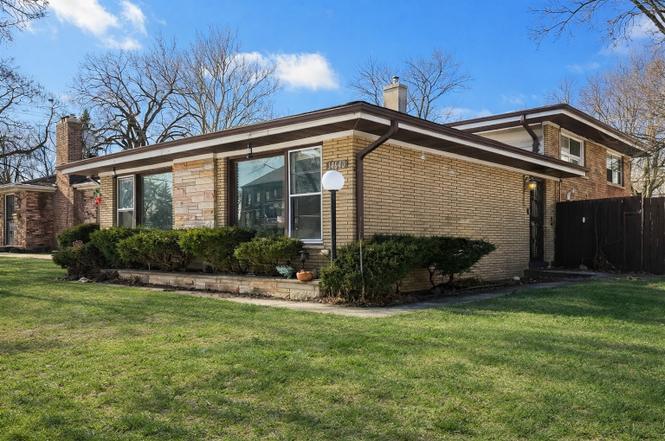
14640 Martin Luther King Dr · Dolton, IL
Flood risk 1/10 · Minimal
- FEMA flood zone
- X (unshaded)
- Chance of flooding over 30 yrs
- 0.0%
- Est. flood insurance / yr
- $473 – $860
Fire risk 1/10 · Minimal
- Est. fire insurance / yr
- $804 – $1,492
Heat risk 3/10 · Minor
- Hot days now (above 101°F)
- 7 days/yr
- Hot days in 30 yrs
- 15 days/yr
Wind risk 2/10 · Minimal
- Chance of severe wind over 30 yrs
- —
Air-quality risk 4/10 · Minor
- Unhealthy air days now
- 4 days/yr
- Unhealthy air days in 30 yrs
- 5 days/yr
Risk factors via First Street. Map © Google.
Why this score? — see what drove the D grade
The composite is a weighted blend of 9 inputs, each scored 0–100. Each bar is that input's sub-score; the figure is the points it added to the 100-point composite (weight × sub-score).
- Cash flow +17.9/30.0
- 1% rule +6.6/10.0
- DSCR +5.6/10.0
- Rent growth +4.9/5.0
- Livability +3.7/5.0
- Condition / age +2.5/5.0
- Schools +0.7/10.0
- ARV discount +0.0/15.0
- Appreciation +0.0/10.0
$198,500
🖨 Deal sheet 📄 Offer letter ✓ Due diligence
Listing remarks MLS
Beautiful Quad updated with Hardwood Floors, Granite Counter Tops, Stainless Steel appliances. Beautifully Rehabbed Bathrooms, 2.5 Car Garage with access in front and back of home. Patio for outside entertainment. Schedule your Clients for Viewing.
Key facts
- 6,250 sq ft lot
- 2 garage spots
- Built 1963
Property features AI
Finance
- Other: Ownership is fee simple; Property not currently leased; Rehab year: 2018; Parcel number on record
- HOA & community: No master association fee required
Exterior
- Parking: Attached garage (garage owned) with 2 garage spaces; Concrete driveway; Garage door opener
- Utilities: Public water; Public sewer
- Home design: Detached single-family home; Quad-level layout; Built before 1978; rehab completed in 2018; Brick construction
- Construction: Asphalt roof; Concrete perimeter foundation; Brick exterior; Age approximately 61–70 years
- Exterior features: Lot approximately 50 x 126 (less than 0.25 acre); County-recorded lot dimensions; School bus and commuter transit access nearby; Interstate access
Interior
- Kitchen: Kitchen on the main level (14 x 10) with blinds and hardwood floors
- Bedrooms: 4 bedrooms; Master bedroom on the second level; Bedroom 2 on the second level (13 x 10) with hardwood floors; Bedroom 3 on the second level (10 x 10) with hardwood floors; Bedroom 4 on the fourth level (11 x 10) with ceramic tile
- Flooring: Hardwood flooring in main living areas and most bedrooms; Ceramic tile in one bedroom
- Bathrooms: 2 full bathrooms; Basement contains a bathroom
- Heating & cooling: Natural gas forced-air heating; Central air conditioning
- Interior features: Finished full basement; 8 total rooms
- Laundry & utility: Dedicated laundry room
Neighborhood map
What this means for you Summary
Snapshot
- This is a 3-bed/1.0-bath single-family listed at $198k.
Deal economics
- At list price, monthly cash flow is $167 ($2k/yr) — positive.
- The deal already cash-flows at list — no discount required.
- Meets the 1% rule at list price ($2k rent vs $198k).
- Recommended offer: $175k (12.0% below list) — sets the bar for market timing.
- Cap rate 7.3% vs local median 9.3% in Dolton — below-typical yield; the buyer is paying a premium for something (appreciation thesis, condition, location) that the cap rate doesn't capture.
Location & tenants
- Location reads 74/100 on livability (#263 in IL, #4,883 nationally) — a middle-class / working-renter tenant base. Strengths: commute A+, cost of living A+, housing A+; Watch: employment C-, health & safety C-, schools F.
- Thornton Twp Hsd 205 (suburban): math 7% / reading 8% proficiency, ranked #594 of 620 in IL (top 96%) — low school quality limits family demand, transient renter base, plan for 1-2y turnover.
- Market conditions: Rents rising fast (+9.7%/yr); 130 active listings in the ZIP; 18 comparable units currently listed for rent nearby; rentals at typical pace (median 23d on market — plan ~3-4 weeks tenant-placement turnaround); 6,272 units permitted in Cook County in 2024 (4,658 in 5+ unit buildings).
- At $2,305/mo this rent would consume 48% of the median local household income ($58k/yr) (locally 919% of renters already pay >50% of income on rent) — very limited rent-growth headroom before tenants either downsize or default.
Forward outlook
- Local home prices are declining (-3.0%/yr); year-one equity from $1k of loan paydown is wiped out by about $6k of value loss. Plan a longer hold.
- At projected returns (-3.0% appreciation + 8.0% rent growth), your $56k cash investment doubles in ~9 years — after that, you're playing with house money.
Negotiation context
- It's been on market 144 days — a 12% lower offer ($175k) is reasonable based on typical stale-listing flexibility.
- 8 sale attempts since 16y ago with the ask held roughly flat each time — persistent listings suggest the price (not the market) is what's stuck; bring a comps-based counter.
- Current owner paid $155k; 28% above their basis — modest negotiation headroom, anchor on the comps not their cost.
Risks & watch-outs
- Watch-outs: property tax is 3.2% of price.
Questions for the listing agent
- It's been on market 144 days. Have you received any prior offers? Is the seller open to a 12% concession, seller financing, or rate buy-down credit?
- Built in 1963 — when were the roof, HVAC, electrical panel, plumbing, and water heater last replaced?
- Property tax is high relative to price — has the assessment been appealed recently, and will the sale trigger a re-assessment?
- Why hasn't it sold? Are there any deal-killer items the seller is aware of (foundation, flood, title, zoning, code violations)?
- Is there a deadline driving the sale (1031 exchange, divorce, estate, relocation)? That informs how much negotiation room exists.
- Schools are F-rated, which usually means shorter tenancies and higher turnover. Who's the typical renter profile here, and what's been the actual vacancy rate?
- Crime grade is D in this area — have there been break-ins, vandalism, or insurance claims at this property in the last 3 years? What carrier currently insures it and at what premium?
- The area grade is low — what's the realistic commute time and amenity access for the typical tenant pool here? Any planned neighborhood developments (good or bad) we should know about?
- What's the average days-on-market for RENTAL listings here right now (not sales)? A rising rental-DOM trend means longer vacancies and softer asking-rent achievability than the comps imply.
- What's the recent tenant-quality profile in this submarket — average credit score on applications, eviction rate, late-payment / NSF rate, and stable-employment percentage? A property-management company in the area should have these aggregated.
- How much new for-sale + rental construction is in the pipeline within 1–3 miles? Heavy new supply typically softens prices + rents 12–24 months out; constrained supply supports both.
Investment metrics
- 1% rule
- 1.16% ✓
- Cap rate
- 7.30%
- Cash-on-cash
- 3.60%
- DSCR
- 1.16
- GRM
- 7.2
CMA / ARV
- ARV (on-the-fly)
- $138,320
- Comps found
- 12
Show comp detail 12 sales within ~0.75 mi
| Address | Dist | Beds/Ba | Sqft | Sold | Price | $/sf | Match |
|---|---|---|---|---|---|---|---|
| 506 E 144th St | 0.38mi | 3/1.0 | 1,020 (-2%) | 2mo | $48,500 | $48 | 78 |
| 14619 Martin Luther King Jr Dr | 0.07mi | 3/1.0 | 1,153 (+11%) | 2mo | $163,000 | $141 | 77 |
| 14819 Irving Ave | 0.35mi | 3/1.0 | 980 (-6%) | 4mo | $130,000 | $133 | 71 |
| 14813 Evers St | 0.24mi | 4/1.0 (+1) | 1,127 (+8%) | 3mo | $82,000 | $73 | 67 |
| 14915 Irving Ave | 0.43mi | 2/1.0 (-1) | 980 (-6%) | 4mo | $68,000 | $69 | 62 |
| 14647 Irving Ave | 0.28mi | 3/2.0 | 889 (-14%) | 2mo | $138,000 | $155 | 57 |
| 14927 Cottage Grove Ave | 0.64mi | 3/2.0 | 1,095 (+5%) | 1mo | $250,000 | $228 | 57 |
| 14840 Langley Ave | 0.46mi | 2/1.0 (-1) | 936 (-10%) | 2mo | $37,000 | $40 | 55 |
| 15061 Wabash Ave | 0.64mi | 3/1.5 | 1,116 (+7%) | 2mo | $150,000 | $134 | 54 |
| 619 E 152nd St | 0.67mi | 3/1.5 | 1,146 (+10%) | 1mo | $153,000 | $134 | 49 |
| 201 E 143rd St | 0.66mi | 4/2.0 (+1) | 1,129 (+9%) | 0mo | $95,000 | $84 | 45 |
| 14633 Wabash Ave | 0.65mi | 3/7.0 | 1,150 (+11%) | 1mo | $95,000 | $83 | 31 |
Match score weights: distance 35% · size 25% · config 20% · recency 20%. Top-matched comps best support the ARV.
Projected returns pro-forma
-3.0% appreciation · 8.0% rent growth · sell at horizon
- IRR
- -4.2%
- Equity multiple
- 0.84×
- Total profit
- $-9,167
- Equity at exit
- $29,597
- IRR
- 11.2%
- Equity multiple
- 2.11×
- Total profit
- $61,970
- Equity at exit
- $17,163
Cash invested: $55,580 (down + closing). Projections, not guarantees.
Landlord ↔ Tenant lean methodology
- Overall (STATE)
- 43 Moderately Tenant-Leaning
- State Illinois
- 43 Moderately Tenant-Leaning · D+7
- County
- — inherits STATE
- City
- — inherits STATE
ZIP-level market 60419
- Home prices YoY
- -25.7%
- Rents YoY
- 9.7%
- Active inventory
- 130
- Price-to-rent
- 7.2×
Monthly cashflow live
- Estimated rent
- $2,305 high interval (Pro) →
- Mortgage (P&I)
- −$1,041
- Tax from tax record
- −$531 /mo · $6,370/yr
- Insurance
- −$83
- HOA
- −$0
- Vacancy / Maint / Mgmt
- −$484
- Net cashflow
- $167
Break-even live
UW: 25.0% down · 7.5% · 30yr · 1.5% tax · 5.0% vac · 8.0% maint · 8.0% mgmt
Financing live
Cash to close
- Down payment
- $49,625
- Closing costs
- $5,955
- Reserves months
- —
- Total cash needed
- —
Loan-product check · same deal, 3 products live
Conventional
25% down · 7.5% · 30yr
- Down + closing
- —
- Monthly P&I
- —
- Monthly cashflow
- —
- DSCR
- —
- Eligible?
- —
Personal DTI + credit; lowest rate.
DSCR
20% down · 8.5% · 30yr
- Down + closing
- —
- Monthly P&I
- —
- Monthly cashflow
- —
- DSCR
- —
- Eligible?
- —
No personal income docs; deal must DSCR.
Hard money
10% down · 12.0% · 12mo
- Down + closing
- —
- Monthly P&I
- —
- Monthly cashflow
- —
- DSCR
- —
- Eligible?
- —
Short-term bridge; refi at stabilization.
Rent comps 18 comps
| Address | Beds | Baths | Sqft | Rent | $/sqft | DOM | Units | Dist |
|---|---|---|---|---|---|---|---|---|
| 14817 Champlain Ave Dolton, IL | 2.0 | 1.0 | 980 | $2,430 | $2.48 | 22d | 1 | 0.39mi |
| 14916 Langley Ave Dolton, IL | 3.0 | 1.5 | 1418 | $2,500 | $1.76 | 25d | 1 | 0.49mi |
| 14305 Irving Ave Unit 2 Dolton, IL | 3.0 | 1.0 | 1100 | $2,200 | $2.00 | 25d | 1 | 0.56mi |
| 14500 Cottage Grove Ave Unit 3 Dolton, IL | 2.0 | 1.0 | 1000 | $1,475 | $1.48 | 25d | 1 | 0.58mi |
| 14844 Wabash Ave Dolton, IL | 3.0 | 1.5 | 1277 | $2,320 | $1.82 | 25d | 1 | 0.72mi |
| 15238 Doctor Martin Luther King Junior Dr Unit 2W Dolton, IL | 2.0 | 1.0 | 800 | $1,500 | $1.88 | 11d | 1 | 0.72mi |
| 14124 Manor Ave Dolton, IL | 3.0 | 2.0 | 1440 | $2,390 | $1.66 | 25d | 1 | 0.78mi |
| 15509 Park Ln South Holland, IL | 4.0 | 1.5 | 1200 | $3,400 | $2.83 | 8d | 1 | 1.03mi |
| 15509 Park Ln South Holland, IL | 4.0 | 1.5 | 1200 | $3,400 | $2.83 | 25d | 1 | 1.03mi |
| 13841 Forest Ave Dolton, IL | 3.0 | 1.0 | 930 | $1,895 | $2.04 | 25d | 1 | 1.06mi |
| 14433 Woodlawn Ave Dolton, IL | 4.0 | 2.0 | 1300 | $2,000 | $1.54 | 19d | 1 | 1.08mi |
| 14716 Dorchester Ave Dolton, IL | 3.0 | 2.0 | 1250 | $2,800 | $2.24 | 19d | 1 | 1.27mi |
| 14101 S Atlantic Ave Riverdale, IL | 2.0 | 1.0 | 790 | $1,140 | $1.44 | 8d | 1 | 1.27mi |
| 15231 Hastings Dr Dolton, IL | 4.0 | 1.5 | 1487 | $2,146 | $1.44 | 8d | 1 | 1.31mi |
| 14610 Blackstone Ave Dolton, IL | 3.0 | 1.0 | 1017 | $2,400 | $2.36 | 6d | 1 | 1.39mi |
| 14738 Blackstone Ave Dolton, IL | 3.0 | 1.0 | 1017 | $2,400 | $2.36 | 10d | 1 | 1.39mi |
| 13810 S La Salle St #1 Riverdale, IL | 3.0 | 1.0 | 800 | $1,550 | $1.94 | 2d | 1 | 1.45mi |
| 14015 S Stewart Ave Unit 2W Riverdale, IL | 2.0 | 1.0 | 800 | $1,400 | $1.75 | 25d | 1 | 1.48mi |
Listing history 41 events
-
2026-06-18days on market $198,500 Active 144 DOM
-
2026-06-17days on market $198,500 Active 143 DOM
-
2026-06-16days on market $198,500 Active 142 DOM
-
2026-06-15days on market $198,500 Active 141 DOM
-
2026-06-13days on market $198,500 Active 139 DOM
-
2026-06-13days on market $198,500 Active 138 DOM
-
2026-06-09days on market $198,500 Active 135 DOM
-
2026-06-08days on market $198,500 Active 134 DOM
-
2026-06-07days on market $198,500 Active 133 DOM
-
2026-06-04days on market $198,500 Active 130 DOM
-
2026-06-03days on market $198,500 Active 129 DOM
-
2026-06-02days on market $198,500 Active 128 DOM
-
2026-06-01days on market $198,500 Active 127 DOM
-
2026-05-31days on market $198,500 Active 126 DOM
-
2026-03-20price $201,500
-
2026-01-25$206,500 Active
-
2019-07-24soldstatus $155,000
-
2019-07-16soldstatus $155,000 Closed Sale 248-char remark
Show marketing remark (248 chars)
Beautiful Quad updated with Hardwood Floors, Granite Counter Tops, Stainless Steel appliances. Beautifully Rehabbed Bathrooms, 2.5 Car Garage with access in front and back of home. Patio for outside entertainment. Schedule your Clients for Viewing.
-
2019-05-17historical Contingent 248-char remark
Show marketing remark (248 chars)
Beautiful Quad updated with Hardwood Floors, Granite Counter Tops, Stainless Steel appliances. Beautifully Rehabbed Bathrooms, 2.5 Car Garage with access in front and back of home. Patio for outside entertainment. Schedule your Clients for Viewing.
-
2019-04-11status Reactivated 248-char remark
Show marketing remark (248 chars)
Beautiful Quad updated with Hardwood Floors, Granite Counter Tops, Stainless Steel appliances. Beautifully Rehabbed Bathrooms, 2.5 Car Garage with access in front and back of home. Patio for outside entertainment. Schedule your Clients for Viewing.
-
2019-04-08historical Contingent 248-char remark
Show marketing remark (248 chars)
Beautiful Quad updated with Hardwood Floors, Granite Counter Tops, Stainless Steel appliances. Beautifully Rehabbed Bathrooms, 2.5 Car Garage with access in front and back of home. Patio for outside entertainment. Schedule your Clients for Viewing.
-
2019-03-29$155,000 New 248-char remark
Show marketing remark (248 chars)
Beautiful Quad updated with Hardwood Floors, Granite Counter Tops, Stainless Steel appliances. Beautifully Rehabbed Bathrooms, 2.5 Car Garage with access in front and back of home. Patio for outside entertainment. Schedule your Clients for Viewing.
-
2019-03-12historical
-
2019-03-05status Active
-
2019-03-04historical
-
2019-02-21New
-
2019-02-12historical
-
2018-11-08price
-
2018-10-12New
-
2017-06-08soldstatus $60,000
-
2017-06-06soldstatus $60,000 Closed Sale
-
2017-05-04status Pending
-
2017-04-28$59,995 New
-
2013-01-09soldstatus $2,400,000
-
2010-07-01soldstatus $35,626 Closed Sale
-
2010-03-23status Pending
-
2010-02-19price $52,200 Price Change
-
2010-01-15$58,000 New
-
2002-01-04soldstatus $127,500
-
1991-07-23soldstatus $98,000
-
1984-06-04soldstatus $80,000
ⓘ Source: listings_history table (triggers on properties + properties_extension) + one-shot
backfill from property_details.listing_events for pre-trigger history.
Tax reassessment forecast IL · Partial reset (capped growth)
- Current annual tax
- $6,370 · $531/mo
- Projected year-2 tax
- $6,370 · $531/mo
- Expected delta
- $0/yr ($0/mo · 0.0%)
ⓘ Screening estimate from a state-policy table — verify with the county assessor before closing.
Climate risk First Street
- Flood 1/10 Low FEMA zone X (unshaded) · 0% chance over 30 yrs
- Wildfire 1/10 Low
- Heat 3/10 Moderate 7 d/yr ≥101°F today · 15 d/yr by 30 yrs out
- Wind 2/10 Low
- Air quality 4/10 Moderate 4 unhealthy d/yr today · 5 by 30 yrs out
Nearby sold comps map
Loading sold comps map…
Walkable amenities ~0.75 mi
Loading nearby amenities…
Taxation est. · year 1
- Rental income
- $27,661
- − Mortgage interest
- −$11,119
- − Property taxes
- −$6,370
- − Insurance
- −$992
- − Repairs & maintenance
- −$2,213
- − Management
- −$2,213
- − Depreciation
- −$5,775
- Taxable loss
- −$1,020
- Est. tax savings @ 24.0%
- +$245
- After-tax cash flow
- $2,244/yr
For passive investors: Depreciation is non-cash, so a rental often shows a tax loss while cash-flowing — sheltering income. Rental losses are passive: they offset passive income freely, and up to $25,000/yr can offset ordinary (W-2) income if you actively participate and your MAGI is under $100k (phasing out to $0 by $150k); unused losses carry forward. On sale, claimed depreciation is recaptured at up to 25%, and gains may owe capital-gains tax (a 1031 exchange can defer both). Figures are a year-1 estimate at your 24.0% rate — not tax advice; consult a CPA.
Schools (NCES district)
- District
- Thornton Twp Hsd 205
- NCES district ID
- 1738970
- Math proficiency
- 7% ▬ 0.00%
- Reading proficiency
- 8% ▼ -2.00%
- Median HH income
- $43,392
- Composite
- 6.92/100
- National rank
- #9976
- State rank
- #594 of 620 in IL
Livability — Dolton
- Score
- 74/100
- State rank
- #263
- US rank
- #4883
Category grades
Schools grade is shown separately in the Schools card above.
Census & demographics
- Census place
- Dolton, IL
- County
- Cook County · 4,486,803 people
- City population
- 20,825
- Metro
- Chicago-Naperville-Elgin, IL-IN-WI
- Population (ZIP)
- 20,825
- Household income
- $57,887
- Rent vs Own
- Severe rent burden
- 919.0
Population outlook (Cook County) Hauer SSP2
- Today (2025)
- 5,347,519 people
- By 2030
- 5,357,703 · +0.2%
- By 2040
- 5,324,924 · -0.4%
- By 2050
- 5,230,762 · -2.2%
- By 2075
- 4,785,735 · -10.5%
- By 2100
- 4,188,836 · -21.7%
Race, ethnicity, and origin ACS 2023
- Neighborhood character
- Predominantly Black (91%)
- Race & ethnicity
- Black 91% White 4% Two or more races 3% Hispanic / Latino 1%
- Common ancestry
- Romanian 1% Hispanic 1%
- Foreign-born
- 3% · Canada
- Languages at home
- 95% English-only · French/Haitian/Cajun 2% Spanish 1%
Political lean MEDSL · Cook
- 2024 margin
- Solid D (+42.0) · D 70.4% · R 28.4% · Other 1.2%
- 2008→2024 swing
- -11.4pp toward R · 2008: 53.4pp · 2024: 42.0pp
- All cycles
- 2024: D+42.0 2020: D+50.3 2016: D+53.0 2012: D+49.4 2008: D+53.4
Not yet ingested
- Civics
- —
Market trends
- HPI YoY
- ▼ -66.88%
- Current HPI
- 193.2346
- Rent YoY
- ▲ 9.65%
- Metro
- Chicago-Naperville-Elgin, IL-IN-WI
- State GDP YoY
- ▲ 1.59%
- F500 in state
- 60
Industry mix (Fortune 500 HQ in IL)
| Industry | F500 HQs | Revenue |
|---|---|---|
| Insurance | 4 | $201B |
|
||
| Consumer Goods | 4 | $87B |
|
||
| Industrial Machinery | 3 | $64B |
|
||
| Healthcare | 2 | $55B |
|
||
| Retail / Pharmacy | 1 | $148B |
|
||
| Agriculture / Food | 1 | $86B |
|
||
Price history
+151.9% since first listed27 events — show timeline
- 2026-03-20 Price Changed $201,500 MRED as Distributed by MLS Grid
- 2026-01-25 Listed $206,500 MRED as Distributed by MLS Grid
- 2019-07-24 Sold (Public Records) $155,000 Public Records
- 2019-07-16 Sold (MLS) $155,000 MRED as Distributed by MLS Grid
- 2019-05-17 Contingent — MRED as Distributed by MLS Grid
- 2019-04-11 Relisted — MRED as Distributed by MLS Grid
- 2019-04-08 Contingent — MRED as Distributed by MLS Grid
- 2019-03-29 Listed $155,000 MRED as Distributed by MLS Grid
- 2019-03-12 Listing Removed — MRED as Distributed by MLS Grid
- 2019-03-05 Relisted — MRED as Distributed by MLS Grid
- 2019-03-04 Listing Removed — MRED as Distributed by MLS Grid
- 2019-02-21 Listed — MRED as Distributed by MLS Grid
- 2019-02-12 Listing Removed — MRED as Distributed by MLS Grid
- 2018-11-08 Price Changed — MRED as Distributed by MLS Grid
- 2018-10-12 Listed — MRED as Distributed by MLS Grid
- 2017-06-08 Sold (Public Records) $60,000 Public Records
- 2017-06-06 Sold (MLS) $60,000 MRED as Distributed by MLS Grid
- 2017-05-04 Pending — MRED as Distributed by MLS Grid
- 2017-04-28 Listed $59,995 MRED as Distributed by MLS Grid
- 2013-01-09 Sold (Public Records) $2,400,000 Public Records
- 2010-07-01 Sold (MLS) $35,626 MRED as Distributed by MLS Grid
- 2010-03-23 Pending — MRED as Distributed by MLS Grid
- 2010-02-19 Price Changed $52,200 MRED as Distributed by MLS Grid
- 2010-01-15 Listed $58,000 MRED as Distributed by MLS Grid
- 2002-01-04 Sold (Public Records) $127,500 Public Records
- 1991-07-23 Sold (Public Records) $98,000 Public Records
- 1984-06-04 Sold (Public Records) $80,000 Public Records
Property tax history
+3.3%/yrLatest (2023): $6,370 · -0.1% YoY. Source: county tax records.
Cash-flow waterfall
monthlySold comps — $/sqft
last 12 mo · ≤1 miLoading sold comps…