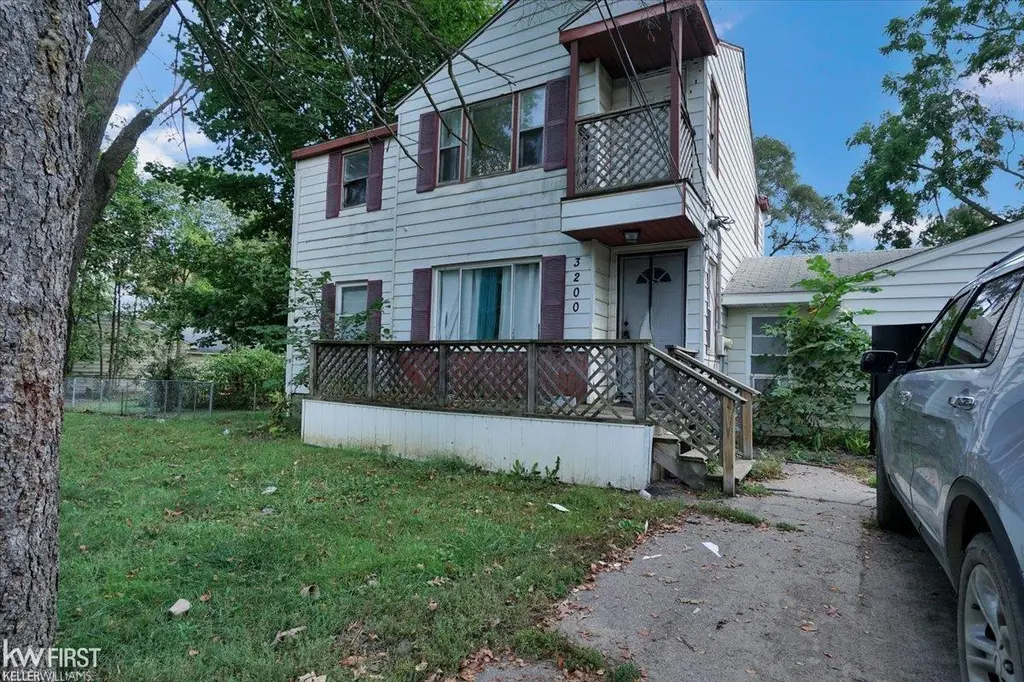
3200 N Averill Ave · Genesee, MI
Flood risk 1/10 · Minimal
- FEMA flood zone
- X (unshaded)
- Chance of flooding over 30 yrs
- 0.0%
- Est. flood insurance / yr
- $473 – $860
Fire risk 1/10 · Minimal
- Est. fire insurance / yr
- $784 – $1,456
Heat risk 2/10 · Minimal
- Hot days now (above 96°F)
- 7 days/yr
- Hot days in 30 yrs
- 15 days/yr
Wind risk 2/10 · Minimal
- Chance of severe wind over 30 yrs
- —
Air-quality risk 2/10 · Minimal
- Unhealthy air days now
- 1 days/yr
- Unhealthy air days in 30 yrs
- 2 days/yr
Risk factors via First Street. Map © Google.
Why this score? — see what drove the D grade
The composite is a weighted blend of 9 inputs, each scored 0–100. Each bar is that input's sub-score; the figure is the points it added to the 100-point composite (weight × sub-score).
- Cash flow +13.8/30.0
- ARV discount +7.5/15.0
- 1% rule +4.6/10.0
- DSCR +4.2/10.0
- Schools +2.7/10.0
- Rent growth +2.5/5.0
- Livability +2.5/5.0
- Condition / age +2.5/5.0
- Appreciation +0.0/10.0
$139,900
🖨 Deal sheet (PDF) 📄 Offer letter ✓ Due diligence
Listing remarks MLS
You do not want to miss out on this cash flowing duplex in Genesee Township and Kearsley School District! The 3 bedroom 2 bath unit is rented at $1,100/month. The 2 bedroom unit is rented for $700/month. It is completely updated! Separate meters for electric and gas. Separate room for laundry. Call today for more information and to schedule a showing!
Key facts
- Cash flowing duplex
- Updated
- Separate meters
Tags
Property features AI
Finance
- Financial info: Annual property tax approximately $3,099
Exterior
- Utilities: Public water; Public sewer
- Home design: Multi-family residential property; Two levels
- Construction: Above-grade finished area approximately 1,392 (square feet)
- Exterior features: Lot roughly 61 x 150
Interior
- Bathrooms: 3 full bathrooms
- Heating & cooling: Forced air heating (natural gas); Separate meters for heating; No central cooling
- Interior features: Basement included; Three full bathrooms
Neighborhood map
What this means for you Summary
Snapshot
- This is a 4-bed/3.0-bath single-family listed at $140k.
Deal economics
- At list price, monthly cash flow is $12 ($148/yr) — positive.
- The deal already cash-flows at list — no discount required.
- To meet the 1% rule (rent ≥ 1% of price), the offer needs to be $134k (3.9% below list).
- Recommended offer: $134k (3.9% below list) — sets the bar for 1% rule.
Location & tenants
- Location reads: area grade D — affects rentability + tenant quality, not the cash-flow math above.
- Kearsley Community School District (suburban): math 24% / reading 38% proficiency, ranked #343 of 540 in MI (top 64%) — families likely to look elsewhere, expect single-tenant / working-renter base with shorter leases.
- Zoned schools: Weston Elementary School (424 students, 80% FRL); Armstrong Middle School (math 22% / reading 38%, grade F, #337 of 493 statewide, top 69%, 651 students, 85% FRL); Kearsley High School (math 27% / reading 47%, grade F, #334 of 713 statewide, top 51%, 887 students, 82% FRL) — zoned schools average 82% FRL vs 55% district-wide (27 pts higher); higher-poverty schools than district average — tighter screening recommended.
- Market conditions: 204 active listings in the ZIP; 1 comparable units currently listed for rent nearby; 419 units permitted in Genesee County in 2024 (68 in 5+ unit buildings).
- This rent runs 34% of the median local income ($48k/yr) — at the standard rent-burdened threshold; future hikes will face affordability resistance.
Forward outlook
- Local home prices are declining (-3.0%/yr); year-one equity from $967 of loan paydown is wiped out by about $4k of value loss. Plan a longer hold.
- Genesee County population projected at -27% by 2050 — secular population decline; favor cash flow + early exit over multi-decade hold.
Negotiation context
- It's been on market 51 days — a 3% lower offer ($136k) is reasonable based on typical stale-listing flexibility.
- 11 sale attempts since 25y ago with the ask held roughly flat each time — persistent listings suggest the price (not the market) is what's stuck; bring a comps-based counter.
- Current owner paid $45k; list at $140k implies a 211% gain — meaningful room to come down on a strong offer.
Risks & watch-outs
- Watch-outs: built in 1955 — expect roof / HVAC / electrical / plumbing capex.
Questions for the listing agent
- It's been on market 51 days. Have you received any prior offers? Is the seller open to a 4% concession, seller financing, or rate buy-down credit?
- Built in 1955 — when were the roof, HVAC, electrical panel, plumbing, and water heater last replaced?
- Is there a deadline driving the sale (1031 exchange, divorce, estate, relocation)? That informs how much negotiation room exists.
- The area grade is low — what's the realistic commute time and amenity access for the typical tenant pool here? Any planned neighborhood developments (good or bad) we should know about?
- What's the average days-on-market for RENTAL listings here right now (not sales)? A rising rental-DOM trend means longer vacancies and softer asking-rent achievability than the comps imply.
- What's the recent tenant-quality profile in this submarket — average credit score on applications, eviction rate, late-payment / NSF rate, and stable-employment percentage? A property-management company in the area should have these aggregated.
- How much new for-sale + rental construction is in the pipeline within 1–3 miles? Heavy new supply typically softens prices + rents 12–24 months out; constrained supply supports both.
Investment metrics
- 1% rule
- 0.96% ✗
- Cap rate
- 6.40%
- Cash-on-cash
- 0.38%
- DSCR
- 1.02
- GRM
- 8.7
CMA / ARV
- ARV (on-the-fly)
- $75,168
- Comps found
- 12
Show comp detail 12 sales within ~0.75 mi
| Address | Dist | Beds/Ba | Sqft | Sold | Price | $/sf | Match |
|---|---|---|---|---|---|---|---|
| 3710 Branch Rd | 0.39mi | 4/1.5 | 1,298 (-7%) | 6mo | $40,500 | $31 | 59 |
| 2975 Henry St | 0.42mi | 4/1.5 | 1,225 (-12%) | 3mo | $50,000 | $41 | 52 |
| 3153 Thom St | 0.64mi | 3/1.0 (-1) | 1,378 (-1%) | 8mo | $80,000 | $58 | 49 |
| 3632 Western Rd | 0.60mi | 3/1.5 (-1) | 1,357 (-2%) | 12mo | $47,500 | $35 | 46 |
| 3301 S Kearsley Blvd | 0.68mi | 3/1.0 (-1) | 1,440 (+3%) | 7mo | $132,200 | $92 | 44 |
| 3088 Layman Dr | 0.73mi | 3/2.0 (-1) | 1,472 (+6%) | 5mo | $174,000 | $118 | 43 |
| 2822 Epsilon Trl | 0.61mi | 3/1.0 (-1) | 1,522 (+9%) | 0mo | $78,640 | $52 | 43 |
| 2910 Arizona Ave | 0.61mi | 3/1.0 (-1) | 1,450 (+4%) | 11mo | $73,000 | $50 | 42 |
| 4057 Welcome Dr | 0.64mi | 4/1.5 | 1,576 (+13%) | 8mo | $195,000 | $124 | 36 |
| 3307 S Kearsley Blvd | 0.68mi | 3/2.0 (-1) | 1,200 (-14%) | 4mo | $140,000 | $117 | 33 |
| 2801 Epsilon Trl | 0.67mi | 3/1.0 (-1) | 1,576 (+13%) | 6mo | $85,000 | $54 | 29 |
| 2818 Epsilon Trl | 0.62mi | 3/1.0 (-1) | 1,595 (+15%) | 9mo | $66,000 | $41 | 27 |
Match score weights: distance 35% · size 25% · config 20% · recency 20%. Top-matched comps best support the ARV.
Projected returns pro-forma
-3.0% appreciation · 3.0% rent growth · sell at horizon
- IRR
- -15.6%
- Equity multiple
- 0.44×
- Total profit
- $-21,814
- Equity at exit
- $20,860
- IRR
- -7.1%
- Equity multiple
- 0.55×
- Total profit
- $-17,694
- Equity at exit
- $12,096
Cash invested: $39,172 (down + closing). Projections, not guarantees.
Landlord ↔ Tenant lean methodology
- Overall (STATE)
- 62 Landlord-Friendly
- State Michigan
- 62 Landlord-Friendly · EVEN
- County
- — inherits STATE
- City
- — inherits STATE
ZIP-level market 48506
- Active inventory
- 204
- Price-to-rent
- 8.7×
Monthly cashflow live
- Estimated rent
- $1,345 medium interval (Pro) →
- Mortgage (P&I)
- −$734
- Tax from tax record
- −$258 /mo · $3,099/yr
- Insurance
- −$58
- HOA
- −$0
- Vacancy / Maint / Mgmt
- −$282
- Net cashflow
- $12
Break-even live
Sensitivity live
| Price | -10% $92 | -5% $52 | +0% $12 | +5% $-27 | +10% $-67 |
|---|---|---|---|---|---|
| Rent | -10% $-94 | -5% $-41 | +0% $12 | +5% $65 | +10% $119 |
| Rate | -1.0pp $83 | -0.5pp $48 | base $12 | +0.5pp $-24 | +1.0pp $-61 |
UW: 25.0% down · 7.5% · 30yr · 1.5% tax · 5.0% vac · 8.0% maint · 8.0% mgmt
Financing live
Cash to close
- Down payment
- $34,975
- Closing costs
- $4,197
- Reserves months
- —
- Total cash needed
- —
Loan-product check · same deal, 3 products live
Conventional
25% down · 7.5% · 30yr
- Down + closing
- —
- Monthly P&I
- —
- Monthly cashflow
- —
- DSCR
- —
- Eligible?
- —
Personal DTI + credit; lowest rate.
DSCR
20% down · 8.5% · 30yr
- Down + closing
- —
- Monthly P&I
- —
- Monthly cashflow
- —
- DSCR
- —
- Eligible?
- —
No personal income docs; deal must DSCR.
Hard money
10% down · 12.0% · 12mo
- Down + closing
- —
- Monthly P&I
- —
- Monthly cashflow
- —
- DSCR
- —
- Eligible?
- —
Short-term bridge; refi at stabilization.
Rent comps 1 comps
| Address | Beds | Baths | Sqft | Rent | $/sqft | DOM | Units | Dist |
|---|---|---|---|---|---|---|---|---|
| 2311 N Averill Ave Unit Main Flint, MI | 3.0 | 1.0 | 950 | $1,200 | $1.26 | 15d | 1 | 1.10mi |
Listing history 47 events
-
2026-06-21days on market $139,900 Active 51 DOM
-
2026-06-18days on market $139,900 Active 48 DOM
-
2026-06-17days on market $139,900 Active 47 DOM
-
2026-06-16days on market $139,900 Active 46 DOM
-
2026-06-15days on market $139,900 Active 45 DOM
-
2026-06-14days on market $139,900 Active 43 DOM
-
2026-06-13days on market $139,900 Active 42 DOM
-
2026-06-10days on market $139,900 Active 40 DOM
-
2026-06-09days on market $139,900 Active 39 DOM
-
2026-06-08days on market $139,900 Active 38 DOM
-
2026-06-07days on market $139,900 Active 37 DOM
-
2026-06-05days on market $139,900 Active 34 DOM
-
2026-06-02days on market $139,900 Active 32 DOM
-
2026-06-01days on market $139,900 Active 31 DOM
-
2026-05-31days on market $139,900 Active 30 DOM
-
2026-05-30days on market $139,900 Active 29 DOM
-
2026-05-01$139,900 Active
Show marketing remark (353 chars)
You do not want to miss out on this cash flowing duplex in Genesee Township and Kearsley School District! The 3 bedroom 2 bath unit is rented at $1,100/month. The 2 bedroom unit is rented for $700/month. It is completely updated! Separate meters for electric and gas. Separate room for laundry. Call today for more information and to schedule a showing!
-
2026-05-01$139,900 Active 353-char remark
Show marketing remark (353 chars)
You do not want to miss out on this cash flowing duplex in Genesee Township and Kearsley School District! The 3 bedroom 2 bath unit is rented at $1,100/month. The 2 bedroom unit is rented for $700/month. It is completely updated! Separate meters for electric and gas. Separate room for laundry. Call today for more information and to schedule a showing!
-
2026-01-02historical
-
2026-01-02historical
-
2025-09-28$139,900 Active
-
2025-09-27$139,900 Active
-
2023-06-12soldstatus $45,000 Sold
-
2023-06-12soldstatus $45,000 Closed
-
2023-06-01status Pending
-
2023-06-01status Pending
-
2023-05-31status Active
-
2023-05-31status Active
-
2023-05-23status Pending
-
2023-05-23status Pending
-
2023-05-21price $50,000
-
2023-05-21price $50,000
-
2023-05-05price $60,000
-
2023-05-05price $60,000
-
2023-05-02price $65,000
-
2023-05-01price $65,000
-
2023-04-19price $75,000
-
2023-04-18price $75,000
-
2023-04-06$80,000 Active
-
2023-04-06$80,000 Active
-
2014-04-24soldstatus $15,500
-
2014-04-07historical
-
2014-01-17$17,900
-
2014-01-16$17,900
-
2001-11-09soldstatus $60,000
-
2001-08-31historical
-
2001-05-14$75,000
ⓘ Source: listings_history table (triggers on properties + properties_extension) + one-shot
backfill from property_details.listing_events for pre-trigger history.
Tax reassessment forecast MI · Partial reset (capped growth)
- Current annual tax
- $3,099 · $258/mo
- Projected year-2 tax
- $3,099 · $258/mo
- Expected delta
- $0/yr ($0/mo · 0.0%)
ⓘ Screening estimate from a state-policy table — verify with the county assessor before closing.
Climate risk First Street
- Flood 1/10 Low FEMA zone X (unshaded) · 0% chance over 30 yrs
- Wildfire 1/10 Low
- Heat 2/10 Low 7 d/yr ≥96°F today · 15 d/yr by 30 yrs out
- Wind 2/10 Low
- Air quality 2/10 Low 1 unhealthy d/yr today · 2 by 30 yrs out
Nearby sold comps map
Loading sold comps map…
Walkable amenities ~0.75 mi
Loading nearby amenities…
Taxation est. · year 1
- Rental income
- $16,139
- − Mortgage interest
- −$7,837
- − Property taxes
- −$3,099
- − Insurance
- −$700
- − Repairs & maintenance
- −$1,291
- − Management
- −$1,291
- − Depreciation
- −$4,070
- Taxable loss
- −$2,148
- Est. tax savings @ 24.0%
- +$515
- After-tax cash flow
- $663/yr
For passive investors: Depreciation is non-cash, so a rental often shows a tax loss while cash-flowing — sheltering income. Rental losses are passive: they offset passive income freely, and up to $25,000/yr can offset ordinary (W-2) income if you actively participate and your MAGI is under $100k (phasing out to $0 by $150k); unused losses carry forward. On sale, claimed depreciation is recaptured at up to 25%, and gains may owe capital-gains tax (a 1031 exchange can defer both). Figures are a year-1 estimate at your 24.0% rate — not tax advice; consult a CPA.
Schools (NCES district)
- District
- Kearsley Community School District
- NCES district ID
- 2620070
- Math proficiency
- 24% ▼ -14.00%
- Reading proficiency
- 38% ▼ -8.00%
- Median HH income
- $50,066
- Composite
- 26.99/100
- National rank
- #7068
- State rank
- #343 of 540 in MI
Livability — Genesee
No livability data for this city. (Only ~50 U.S. cities are tracked.)
Census & demographics
- County
- Genesee County · 221,329 people
- Metro
- Flint, MI
- Population (ZIP)
- 24,712
- Household income
- $47,929
- Rent vs Own
- Severe rent burden
- 954.0
Population outlook (Genesee County) Hauer SSP2
- Today (2025)
- 381,312 people
- By 2030
- 362,731 · -4.9%
- By 2040
- 321,550 · -15.7%
- By 2050
- 279,212 · -26.8%
- By 2075
- 193,336 · -49.3%
- By 2100
- 128,118 · -66.4%
Race, ethnicity, and origin ACS 2023
- Neighborhood character
- Predominantly White (76%)
- Race & ethnicity
- White 76% Black 9% Hispanic / Latino 8% Two or more races 7%
- Hispanic origin (detail)
- Mexican 6%
- Common ancestry
- Lithuanian 6% Romanian 4% Slovak 3%
- Foreign-born
- 3% · Canada
- Languages at home
- 96% English-only · Spanish 3%
Political lean MEDSL · Genesee
- 2024 margin
- Toss-up / Even · D 51.4% · R 47.2% · Other 1.4%
- 2008→2024 swing
- -28.3pp toward R · 2008: 32.5pp · 2024: 4.2pp
- All cycles
- 2024: D+4.2 2020: D+9.3 2016: D+9.5 2012: D+28.2 2008: D+32.5
Not yet ingested
- Civics
- —
Market trends
- HPI YoY
- ▼ -173.31%
- Current HPI
- 90.0494
- Rent YoY
- —
- Metro
- Flint, MI
- State GDP YoY
- ▲ 1.37%
- F500 in state
- 28
Industry mix (Fortune 500 HQ in MI)
| Industry | F500 HQs | Revenue |
|---|---|---|
| Automotive Parts | 3 | $48B |
|
||
| Automotive | 2 | $372B |
|
||
| Chemicals | 1 | $45B |
|
||
| Automotive Retail | 1 | $29B |
|
||
| Healthcare / Medical Devices | 1 | $23B |
|
||
| Automotive Technology | 1 | $20B |
|
||
Price history
+86.5% since first listed31 events — show timeline
- 2026-05-01 Listed $139,900 MiRealSource-MiMLS
- 2026-05-01 Listed $139,900 REALCOMP
- 2026-01-02 Listing Removed — MiRealSource-MiMLS
- 2026-01-02 Listing Removed — REALCOMP
- 2025-09-28 Listed $139,900 REALCOMP
- 2025-09-27 Listed $139,900 MiRealSource-MiMLS
- 2023-06-12 Sold (MLS) $45,000 MiRealSource-MiMLS
- 2023-06-12 Sold (MLS) $45,000 REALCOMP
- 2023-06-01 Pending — MiRealSource-MiMLS
- 2023-06-01 Pending — REALCOMP
- 2023-05-31 Relisted — MiRealSource-MiMLS
- 2023-05-31 Relisted — REALCOMP
- 2023-05-23 Pending — REALCOMP
- 2023-05-23 Pending — MiRealSource-MiMLS
- 2023-05-21 Price Changed $50,000 MiRealSource-MiMLS
- 2023-05-21 Price Changed $50,000 REALCOMP
- 2023-05-05 Price Changed $60,000 MiRealSource-MiMLS
- 2023-05-05 Price Changed $60,000 REALCOMP
- 2023-05-02 Price Changed $65,000 MiRealSource-MiMLS
- 2023-05-01 Price Changed $65,000 REALCOMP
- 2023-04-19 Price Changed $75,000 MiRealSource-MiMLS
- 2023-04-18 Price Changed $75,000 REALCOMP
- 2023-04-06 Listed $80,000 MiRealSource-MiMLS
- 2023-04-06 Listed $80,000 REALCOMP
- 2014-04-24 Sold (MLS) $15,500 REALCOMP
- 2014-04-07 Listing Removed — MiRealSource-MiMLS
- 2014-01-17 Listed $17,900 MiRealSource-MiMLS
- 2014-01-16 Listed $17,900 REALCOMP
- 2001-11-09 Sold (Public Records) $60,000 Public Records
- 2001-08-31 Listing Removed — MiRealSource-MiMLS
- 2001-05-14 Listed $75,000 MiRealSource-MiMLS
Property tax history
+4.5%/yrLatest (2025): $3,099 · -0.9% YoY. Source: county tax records.
Cash-flow waterfall
monthlySold comps — $/sqft
last 12 mo · ≤1 miLoading sold comps…