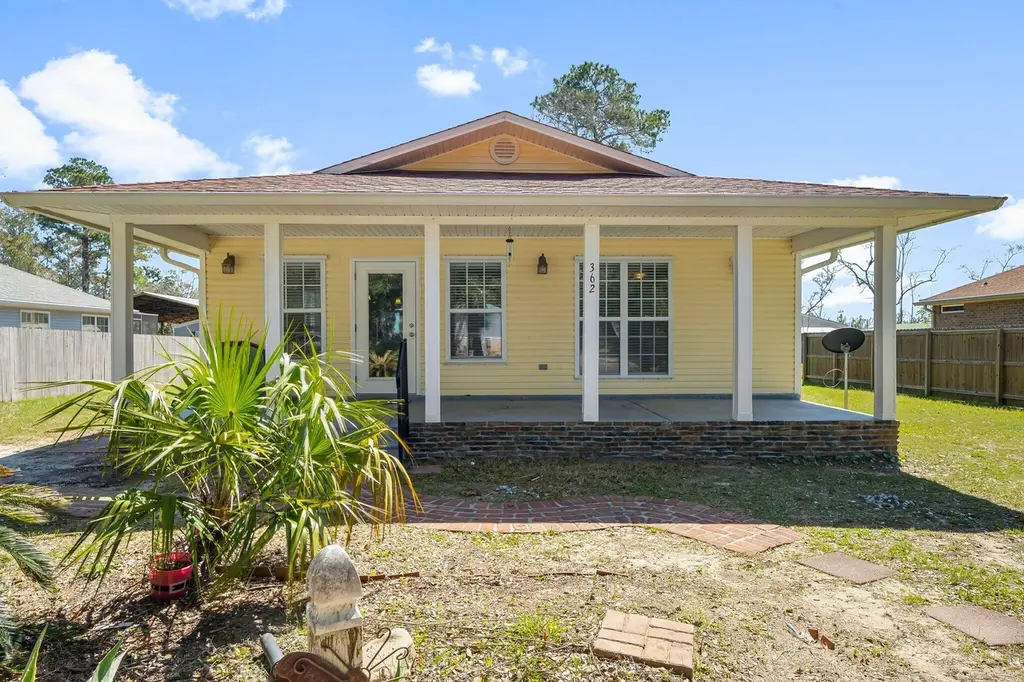
362 Palmetto Ave · Freeport, FL
Flood risk 3/10 · Minor
- FEMA flood zone
- X (unshaded)
- Chance of flooding over 30 yrs
- 0.12%
- Est. flood insurance / yr
- $507 – $1,088
Fire risk 3/10 · Minor
- Est. fire insurance / yr
- $947 – $1,759
Heat risk 10/10 · Severe
- Hot days now (above 105°F)
- 7 days/yr
- Hot days in 30 yrs
- 21 days/yr
Wind risk 9/10 · Severe
- Chance of severe wind over 30 yrs
- 99.0%
Air-quality risk 1/10 · Minimal
- Unhealthy air days now
- 0 days/yr
- Unhealthy air days in 30 yrs
- 0 days/yr
Risk factors via First Street. Map © Google.
Why this score? — see what drove the D- grade
The composite is a weighted blend of 9 inputs, each scored 0–100. Each bar is that input's sub-score; the figure is the points it added to the 100-point composite (weight × sub-score).
- Cash flow +13.6/30.0
- Schools +5.2/10.0
- DSCR +4.1/10.0
- ARV discount +3.6/15.0
- Livability +3.4/5.0
- Rent growth +2.9/5.0
- 1% rule +2.7/10.0
- Condition / age +2.5/5.0
- Appreciation +0.0/10.0
$300,000
🖨 Deal sheet (PDF) 📄 Offer letter ✓ Due diligence
Listing remarks
Seller offering $5,000 credit toward closing costs or rate buy down! No HOA in a convenient Freeport, Florida location south of Route 20 and just minutes from 30A. This 3-bedroom, 2-bath home offers 1,232 square feet of well-designed living space on a spacious 0.26-acre lot. Features include an open-concept living area with breakfast bar, split-bedroom floor plan, private en-suite primary bedroom, full laundry room, crown molding, and an enclosed back patio. Ideally located about 15 minutes from the beaches of 30A, 5 minutes to Grady Brown Park and the 331 bridge, and 1 mile to Black Creek Marina, with easy access to boating, shopping, dining, and everyday conveniences.
Key facts
- 0.25 acre lot
- 4 parking spots
- Built 2007
Property features AI
Finance
- HOA & community: Subdivision: MAGNOLIA BAYE
Exterior
- Parking: 4 driveway spaces
- Utilities: Electric service; Public water; Septic tank; Central electric heating control; Electric water heater
- Home design: Florida cottage style; 1 story; Built in 2007
- Construction: Vinyl siding; Composite shingle roof; Slab foundation
- Exterior features: Partially fenced lot; Yard building; Rain gutters; Porch; Dead-end street; Within 1/2 mile to water; Survey available; County road frontage (paved)
Interior
- Kitchen: Refrigerator
- Bedrooms: 3 bedrooms; Master bedroom is on the first floor; Master bedroom is carpeted; Master bedroom has a walk-in closet
- Flooring: Tile; Carpet
- Bathrooms: 2 full bathrooms
- Heating & cooling: Central heating; Central air; Ceiling fans
- Interior features: Breakfast bar; Crown molding; Split bedroom floor plan; Washer/dryer hookup; Unfurnished
- Laundry & utility: Washer/dryer hookup; Electric water heater
Neighborhood map
What this means for you Summary
Snapshot
- This is a 3-bed/2.0-bath single-family listed at $300k.
Deal economics
- At list price, monthly cash flow is $18 ($210/yr) — positive.
- The deal already cash-flows at list — no discount required.
- To meet the 1% rule (rent ≥ 1% of price), the offer needs to be $232k (22.5% below list).
- Recommended offer: $232k (22.5% below list) — sets the bar for 1% rule.
- Cap rate 6.4% vs local median 3.0% in Freeport — top-decile yield for the area; either an underpriced asset or a hidden risk that comps aren't pricing in. Stress-test before assuming the spread holds.
Location & tenants
- Location reads 68/100 on livability (#520 in FL) — a middle-class / working-renter tenant base. Strengths: crime A+, housing A+, employment B+; Watch: health & safety C-, amenities F, commute F.
- Walton (rural): math 62% / reading 61% proficiency, ranked #10 of 73 in FL (top 14%) — acceptable for families but not a draw, mixed tenant base, ~2y average lease.
- Zoned schools: Freeport Elementary School (math 50% / reading 57%, grade C, #949 of 2,144 statewide, top 45%, 1,123 students, 55% FRL); Emerald Coast Middle School (math 70% / reading 65%, grade A-, #77 of 571 statewide, top 14%, 868 students, 24% FRL); Freeport Senior High School (math 47% / reading 62%, grade C-, #138 of 667 statewide, top 21%, 557 students, 43% FRL).
- Market conditions: Rents rising (+1.4%/yr); 1020 active listings in the ZIP; 2 comparable units currently listed for rent nearby; solid renter incomes; 2,883 units permitted in Walton County in 2024 (1,322 in 5+ unit buildings).
- This rent runs 34% of the median local income ($83k/yr) — at the standard rent-burdened threshold; future hikes will face affordability resistance.
Forward outlook
- Local home prices are declining (-3.0%/yr); year-one equity from $2k of loan paydown is wiped out by about $9k of value loss. Plan a longer hold.
- Walton County population projected at +46% by 2050 — long-run rental-demand tailwind backs the buy-and-hold thesis.
Negotiation context
- It's been on market 51 days — a 3% lower offer ($291k) is reasonable based on typical stale-listing flexibility.
- 10 sale attempts since 13y ago with the ask held roughly flat each time — persistent listings suggest the price (not the market) is what's stuck; bring a comps-based counter.
Risks & watch-outs
- Climate carrying-cost: severe wind risk, 99% chance of damaging wind over 30y; extreme-heat days projected 7→21/yr by 2055 (HVAC capex compounding) — expect insurance premiums to compound above CPI over the hold.
Questions for the listing agent
- It's been on market 51 days. Have you received any prior offers? Is the seller open to a 23% concession, seller financing, or rate buy-down credit?
- Is there a deadline driving the sale (1031 exchange, divorce, estate, relocation)? That informs how much negotiation room exists.
- The area grade is low — what's the realistic commute time and amenity access for the typical tenant pool here? Any planned neighborhood developments (good or bad) we should know about?
- What's the average days-on-market for RENTAL listings here right now (not sales)? A rising rental-DOM trend means longer vacancies and softer asking-rent achievability than the comps imply.
- What's the recent tenant-quality profile in this submarket — average credit score on applications, eviction rate, late-payment / NSF rate, and stable-employment percentage? A property-management company in the area should have these aggregated.
- How much new for-sale + rental construction is in the pipeline within 1–3 miles? Heavy new supply typically softens prices + rents 12–24 months out; constrained supply supports both.
Investment metrics
- 1% rule
- 0.77% ✗
- Cap rate
- 6.36%
- Cash-on-cash
- 0.25%
- DSCR
- 1.01
- GRM
- 10.8
CMA / ARV
- ARV (on-the-fly)
- $275,968
- Comps found
- 4
Show comp detail 4 sales within ~0.75 mi
| Address | Dist | Beds/Ba | Sqft | Sold | Price | $/sf | Match |
|---|---|---|---|---|---|---|---|
| 392 Palmetto Ave | 0.04mi | 3/2.0 | 1,232 (0%) | 16mo | $316,000 | $256 | 85 |
| 165 Palmetto Ave | 0.16mi | 3/2.0 | 1,296 (+5%) | 4mo | $290,000 | $224 | 81 |
| 75 Palmetto Ave | 0.19mi | 3/2.0 | 1,316 (+7%) | 4mo | $255,000 | $194 | 77 |
| 356 Stillwater Rd | 0.19mi | 3/3.0 | 1,372 (+11%) | 14mo | $267,000 | $195 | 57 |
Match score weights: distance 35% · size 25% · config 20% · recency 20%. Top-matched comps best support the ARV.
Projected returns pro-forma
-3.0% appreciation · 1.4% rent growth · sell at horizon
- IRR
- -17.5%
- Equity multiple
- 0.39×
- Total profit
- $-51,301
- Equity at exit
- $44,731
- IRR
- -12.6%
- Equity multiple
- 0.31×
- Total profit
- $-58,360
- Equity at exit
- $25,939
Cash invested: $84,000 (down + closing). Projections, not guarantees.
Landlord ↔ Tenant lean methodology
- Overall (STATE)
- 87 Strongly Landlord-Friendly
- State Florida
- 87 Strongly Landlord-Friendly · R+3
- County
- — inherits STATE
- City
- — inherits STATE
ZIP-level market 32439
- Home prices YoY
- -4.2%
- Rents YoY
- 1.4%
- Active inventory
- 1020
- Price-to-rent
- 10.8×
Monthly cashflow live
- Estimated rent
- $2,324 medium interval (Pro) →
- Mortgage (P&I)
- −$1,573
- Tax from tax record
- −$120 /mo · $1,439/yr
- Insurance
- −$125
- HOA
- −$0
- Vacancy / Maint / Mgmt
- −$488
- Net cashflow
- $18
Break-even live
Sensitivity live
| Price | -10% $187 | -5% $102 | +0% $18 | +5% $-67 | +10% $-152 |
|---|---|---|---|---|---|
| Rent | -10% $-166 | -5% $-74 | +0% $18 | +5% $109 | +10% $201 |
| Rate | -1.0pp $169 | -0.5pp $94 | base $18 | +0.5pp $-60 | +1.0pp $-139 |
UW: 25.0% down · 7.5% · 30yr · 1.5% tax · 5.0% vac · 8.0% maint · 8.0% mgmt
Financing live
Cash to close
- Down payment
- $75,000
- Closing costs
- $9,000
- Reserves months
- —
- Total cash needed
- —
Loan-product check · same deal, 3 products live
Conventional
25% down · 7.5% · 30yr
- Down + closing
- —
- Monthly P&I
- —
- Monthly cashflow
- —
- DSCR
- —
- Eligible?
- —
Personal DTI + credit; lowest rate.
DSCR
20% down · 8.5% · 30yr
- Down + closing
- —
- Monthly P&I
- —
- Monthly cashflow
- —
- DSCR
- —
- Eligible?
- —
No personal income docs; deal must DSCR.
Hard money
10% down · 12.0% · 12mo
- Down + closing
- —
- Monthly P&I
- —
- Monthly cashflow
- —
- DSCR
- —
- Eligible?
- —
Short-term bridge; refi at stabilization.
Rent comps 2 comps
| Address | Beds | Baths | Sqft | Rent | $/sqft | DOM | Units | Dist |
|---|---|---|---|---|---|---|---|---|
| 48 Formby St Freeport, FL | 3.0 | 2.0 | 924 | $1,850 | $2.00 | 23d | 1 | 0.49mi |
| 1952 County Highway 3280 Unit 3280 Freeport, FL | 3.0 | 2.0 | 1269 | $1,900 | $1.50 | 23d | 1 | 1.04mi |
Listing history 41 events
-
2026-06-21days on market $300,000 Active 51 DOM
-
2026-06-18days on market $300,000 Active 48 DOM
-
2026-06-17days on market $300,000 Active 47 DOM
-
2026-06-16days on market $300,000 Active 46 DOM
-
2026-06-15days on market $300,000 Active 45 DOM
-
2026-06-14days on market $300,000 Active 43 DOM
-
2026-06-13days on market $300,000 Active 42 DOM
-
2026-06-10days on market $300,000 Active 40 DOM
-
2026-06-09days on market $300,000 Active 39 DOM
-
2026-06-08days on market $300,000 Active 38 DOM
-
2026-06-07days on market $300,000 Active 37 DOM
-
2026-06-05remarks 678-char remark
-
2026-06-05pricedays on market $300,000 Active 34 DOM
-
2026-06-03days on market $299,000 Active 33 DOM
-
2026-06-03days on market $299,000 Active 32 DOM
-
2026-06-01days on market $299,000 Active 31 DOM
-
2026-05-31days on market $299,000 Active 30 DOM
-
2026-05-30days on market $299,000 Active 29 DOM
-
2026-05-01$299,000 Active
-
2025-05-09price $309,000
-
2025-03-28$310,000 Active
-
2024-03-09price $315,000
-
2024-02-13price $325,000
-
2023-11-29$335,000 Active
-
2023-10-11price $295,000
-
2023-09-03$375,000 Active
-
2022-06-03soldstatus $265,000
-
2022-06-02soldstatus $265,000 Sold
-
2022-06-02soldstatus $265,000 Sold
-
2022-05-28historical
-
2022-05-28$265,000
-
2021-12-14historical
-
2016-04-01historical
-
2016-02-12$150,000
-
2016-02-12$150,000
-
2014-04-07historical
-
2013-12-18$125,000
-
2013-12-18$125,000
-
2013-12-18$125,000
-
2004-12-07soldstatus $20,000
-
2001-09-12soldstatus $9,500
ⓘ Source: listings_history table (triggers on properties + properties_extension) + one-shot
backfill from property_details.listing_events for pre-trigger history.
Tax reassessment forecast FL · Resets to sale price
- Current annual tax
- $1,439 · $120/mo
- Projected year-2 tax
- $2,490 · $208/mo
- Expected delta
- +$1,051/yr (+$88/mo · 73.1%)
ⓘ Screening estimate from a state-policy table — verify with the county assessor before closing.
Climate risk First Street
- Flood 3/10 Moderate FEMA zone X (unshaded) · 12% chance over 30 yrs
- Wildfire 3/10 Moderate
- Heat 10/10 Extreme 7 d/yr ≥105°F today · 21 d/yr by 30 yrs out
- Wind 9/10 Extreme 99% chance of damaging wind over 30 yrs
- Air quality 1/10 Low 0 unhealthy d/yr today · 0 by 30 yrs out
Nearby sold comps map
Loading sold comps map…
Walkable amenities ~0.75 mi
Loading nearby amenities…
Taxation est. · year 1
- Rental income
- $27,883
- − Mortgage interest
- −$16,805
- − Property taxes
- −$1,439
- − Insurance
- −$1,500
- − Repairs & maintenance
- −$2,231
- − Management
- −$2,231
- − Depreciation
- −$8,727
- Taxable loss
- −$5,049
- Est. tax savings @ 24.0%
- +$1,212
- After-tax cash flow
- $1,422/yr
For passive investors: Depreciation is non-cash, so a rental often shows a tax loss while cash-flowing — sheltering income. Rental losses are passive: they offset passive income freely, and up to $25,000/yr can offset ordinary (W-2) income if you actively participate and your MAGI is under $100k (phasing out to $0 by $150k); unused losses carry forward. On sale, claimed depreciation is recaptured at up to 25%, and gains may owe capital-gains tax (a 1031 exchange can defer both). Figures are a year-1 estimate at your 24.0% rate — not tax advice; consult a CPA.
Schools (NCES district)
- District
- Walton
- NCES district ID
- 1201980
- Math proficiency
- 62% ▼ -4.00%
- Reading proficiency
- 61% ▼ -2.00%
- Median HH income
- $46,794
- Composite
- 52.03/100
- National rank
- #1634
- State rank
- #10 of 73 in FL
Livability — Freeport
- Score
- 68/100
- State rank
- #520
- US rank
- #9579
Category grades
Schools grade is shown separately in the Schools card above.
Census & demographics
- County
- Walton County · 70,839 people
- City population
- 15,328
- Metro
- Crestview-Fort Walton Beach-Destin, FL
- Population (ZIP)
- 15,328
- Household income
- $83,227
- Rent vs Own
- Severe rent burden
- 172.0
Population outlook (Walton County) Hauer SSP2
- Today (2025)
- 80,014 people
- By 2030
- 88,120 · +10.1%
- By 2040
- 103,537 · +29.4%
- By 2050
- 117,034 · +46.3%
- By 2075
- 143,901 · +79.8%
- By 2100
- 155,138 · +93.9%
Race, ethnicity, and origin ACS 2023
- Neighborhood character
- Predominantly White (76%)
- Race & ethnicity
- White 76% Hispanic / Latino 16% Two or more races 8% Native American 5% Black 1%
- Hispanic origin (detail)
- Mexican 8% Puerto Rican 2% Cuban 1%
- Common ancestry
- Slovak 3% Italian 3% Serbian 2%
- Foreign-born
- 8% · Canada, Jamaica
- Languages at home
- 86% English-only · Spanish 13% Other Indo-European 1%
Political lean MEDSL · Walton
- 2024 margin
- Solid R (+57.8) · D 20.7% · R 78.6%
- 2008→2024 swing
- -12.0pp toward R · 2008: -45.8pp · 2024: -57.8pp
- All cycles
- 2024: R+57.8 2020: R+51.7 2016: R+56.1 2012: R+52.0 2008: R+45.8
Not yet ingested
- Civics
- —
Market trends
- HPI YoY
- ▼ -15.18%
- Current HPI
- 350.4692
- Rent YoY
- ▲ 1.40%
- Metro
- Crestview-Fort Walton Beach-Destin, FL
- State GDP YoY
- ▲ 3.28%
- F500 in state
- 36
Industry mix (Fortune 500 HQ in FL)
| Industry | F500 HQs | Revenue |
|---|---|---|
| Industrial Technology | 2 | $29B |
|
||
| Insurance | 2 | $17B |
|
||
| Retail | 1 | $60B |
|
||
| Technology Distribution | 1 | $58B |
|
||
| Homebuilding | 1 | $35B |
|
||
| Technology Manufacturing | 1 | $35B |
|
||
Price history
+3047.4% since first listed23 events — show timeline
- 2026-05-01 Listed $299,000 ECAR
- 2025-05-09 Price Changed $309,000 ECAR
- 2025-03-28 Listed $310,000 ECAR
- 2024-03-09 Price Changed $315,000 ECAR
- 2024-02-13 Price Changed $325,000 ECAR
- 2023-11-29 Listed $335,000 ECAR
- 2023-10-11 Price Changed $295,000 ECAR
- 2023-09-03 Listed $375,000 ECAR
- 2022-06-03 Sold (Public Records) $265,000 Public Records
- 2022-06-02 Sold (MLS) $265,000 NAMLS
- 2022-06-02 Sold (MLS) $265,000 ECAR
- 2022-05-28 Listed $265,000 NAMLS
- 2022-05-28 Listing Removed — NAMLS
- 2021-12-14 Listing Removed — CPARMLS
- 2016-04-01 Listing Removed — NAMLS
- 2016-02-12 Listed $150,000 ECAR
- 2016-02-12 Listed $150,000 NAMLS
- 2014-04-07 Listing Removed — NAMLS
- 2013-12-18 Listed $125,000 NAMLS
- 2013-12-18 Listed $125,000 ECAR
- 2013-12-18 Listed $125,000 CPARMLS
- 2004-12-07 Sold (Public Records) $20,000 Public Records
- 2001-09-12 Sold (Public Records) $9,500 Public Records
Property tax history
+9.6%/yrLatest (2025): $1,439 · -2.1% YoY. Source: county tax records.
Cash-flow waterfall
monthlySold comps — $/sqft
last 12 mo · ≤1 miLoading sold comps…