 🏗️ New Construction
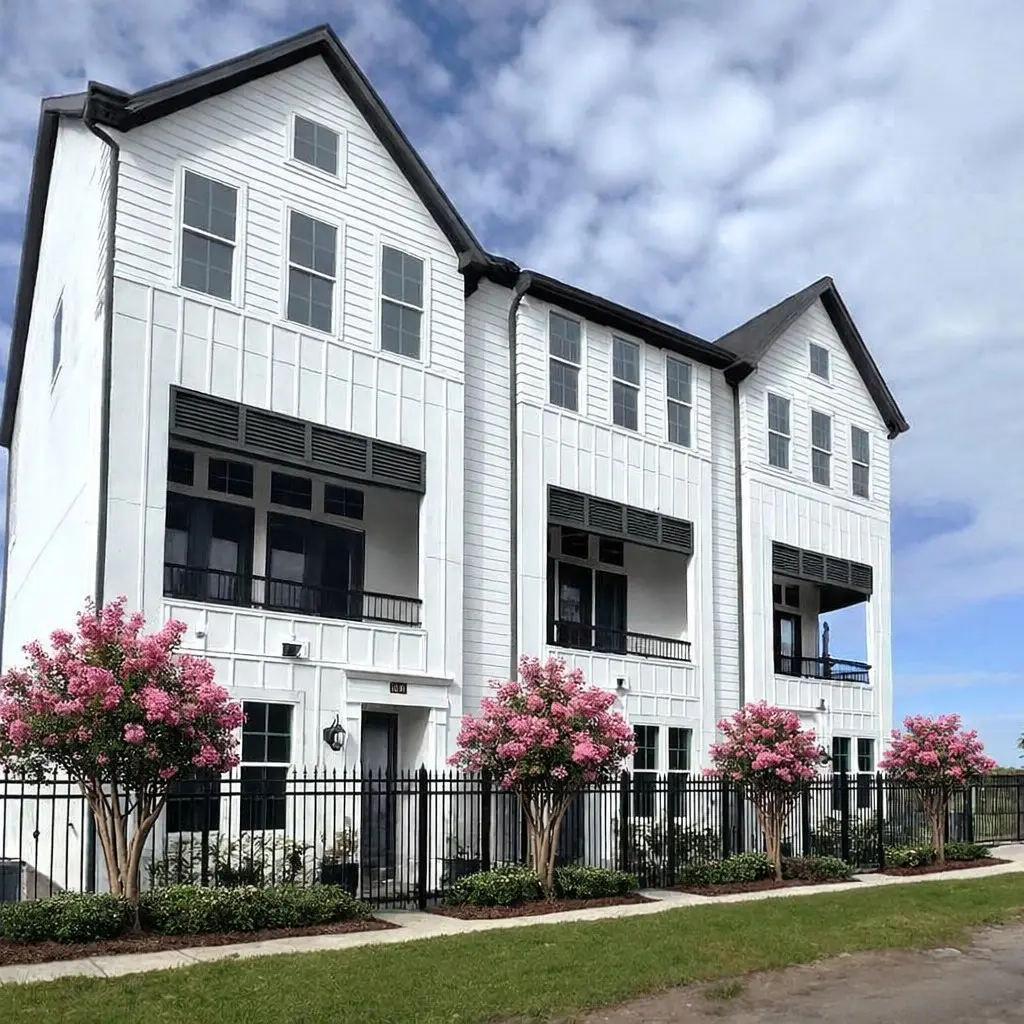
2745 Providence St · Houston, TX
Flood risk 1/10 · Minimal
- FEMA flood zone
- X (unshaded)
- Chance of flooding over 30 yrs
- 0.0%
- Est. flood insurance / yr
- $507 – $1,088
Fire risk 1/10 · Minimal
- Est. fire insurance / yr
- $1,222 – $2,270
Heat risk 9/10 · Severe
- Hot days now (above 109°F)
- 7 days/yr
- Hot days in 30 yrs
- 24 days/yr
Wind risk 9/10 · Severe
- Chance of severe wind over 30 yrs
- 99.0%
Air-quality risk 3/10 · Minor
- Unhealthy air days now
- 2 days/yr
- Unhealthy air days in 30 yrs
- 3 days/yr
Risk factors via First Street. Map © Google.
Why this score? — see what drove the D grade
The composite is a weighted blend of 9 inputs, each scored 0–100. Each bar is that input's sub-score; the figure is the points it added to the 100-point composite (weight × sub-score).
- Appreciation +10.0/10.0
- ARV discount +7.5/15.0
- Cash flow +7.3/30.0
- Condition / age +4.8/5.0
- Livability +3.7/5.0
- Rent growth +3.6/5.0
- Schools +2.7/10.0
- 1% rule +1.4/10.0
- DSCR +1.4/10.0
$389,900
🖨 Deal sheet (PDF) 📄 Offer letter ✓ Due diligence
Listing remarks
Beautiful three bedroom, three and a half bath, three story townhome in a brand new gated community of twenty-nine homes near Downtown Houston and the exciting new East River development. A mix of modern luxury and traditional elegance. This spacious home features an open-concept living area with soaring 12-foot ceilings, wood floors, and abundant natural light pouring through the balcony doors. The gourmet kitchen includes quartz countertops, stainless steel Bosch appliances, and a large island perfect for entertaining. Wood floors throughout! Each bedroom has its own ensuite bath, with the primary suite offering a walk-in closet and spa-like bathroom. An ideal location with quick access
Key facts
- Gated community
- Quartz countertops
- Gourmet kitchen
Tags
Property features AI
Finance
- Other: Pet restrictions
- HOA & community: HOA managed by Vision Communities Management II; Community is gated; HOA provides trash service; Annual association fee; Association fee includes common areas, water, sewer and trash
Exterior
- Parking: Attached 2-car garage; Electric gate; Garage door opener
- Security: Security gate; Prewired; Owned security system
- Utilities: Public water; Public sewer
- Home design: Residential property; East-facing; 3 stories; Under construction (new construction)
- Construction: Cement siding; Composition roof; Slab foundation; Built in 2026; Built by InTownHomes
- Exterior features: Balcony; Fence; Sprinkler/irrigation; Concrete road surface
Interior
- Kitchen: Dishwasher; Gas cooktop; Electric oven; Microwave; Garbage disposal; Kitchen island; Pantry / walk-in pantry; Pots & pan drawers; Self-closing cabinets and drawers
- Bedrooms: 3 bedrooms (possible)
- Flooring: Engineered hardwood; Tile
- Bathrooms: 3 full bathrooms; 1 half bathroom
- Heating & cooling: Heat pump with zoned heating; Central electric air conditioning with zoned cooling
- Interior features: Balcony; Crown molding; Double vanity in bathroom; High ceilings; Kitchen island; Primary bedroom with bath; Pots & pan drawers; Pantry and walk-in pantry; Self-closing cabinet doors and drawers; Tub/shower; Prewired for sound; Low emissivity windows
- Laundry & utility: Laundry in utility room; Washer and dryer included; Electric and gas dryer hookups; Tankless water heater
Neighborhood map
What this means for you Summary
Snapshot
- This is a 3-bed/3.5-bath townhouse listed at $390k. Condition is rated excellent.
Deal economics
- At list price, monthly cash flow is $-542 ($-7k/yr) — negative.
- To cash-flow at today's rent, offer at most $307k (21.2% below list).
- To meet the 1% rule (rent ≥ 1% of price), the offer needs to be $256k (34.3% below list).
- Recommended offer: $256k (34.3% below list) — sets the bar for 1% rule.
- Cap rate 4.7% vs local median 3.2% in Houston — top-decile yield for the area; either an underpriced asset or a hidden risk that comps aren't pricing in. Stress-test before assuming the spread holds.
Location & tenants
- Location reads 74/100 on livability (#184 in TX, #4,771 nationally) — a middle-class / working-renter tenant base. Strengths: amenities A+, cost of living A+, housing A+; Watch: crime F.
- Houston ISD (urban): math 27% / reading 35% proficiency, ranked #593 of 826 in TX (top 72%) — families likely to look elsewhere, expect single-tenant / working-renter base with shorter leases; 71% free/reduced lunch — lower-income household profile, screen leases tightly.
- Zoned schools: Sherman El (math 22% / reading 22%, grade F, #3,333 of 4,322 statewide, top 80%, 528 students, 99% FRL); Fleming Middle (math 10% / reading 15%, grade F, #1,616 of 1,662 statewide, top 97%, 384 students, 97% FRL); Northside H S (math 15% / reading 26%, grade F, #1,389 of 1,632 statewide, top 86%, 1,168 students, 94% FRL) — zoned schools average 97% FRL vs 71% district-wide (26 pts higher); higher-poverty schools than district average — tighter screening recommended.
- Zoned-school proficiency averages 18% at this address vs 31% district-wide (-13 pts) — the specific schools serving this property underperform the Houston ISD average; the district grade overstates school quality for this exact location.
- Market conditions: Rents rising fast (+4.3%/yr); 339 active listings in the ZIP; 40 comparable units currently listed for rent nearby; rentals leasing fast (median 13d on market — plan ~1-2 weeks tenant-placement turnaround); 29,883 units permitted in Harris County in 2024 (8,621 in 5+ unit buildings).
- At $2,562/mo this rent would consume 61% of the median local household income ($50k/yr) (locally 969% of renters already pay >50% of income on rent) — very limited rent-growth headroom before tenants either downsize or default.
Forward outlook
- In year one you build about $43k of equity ($3k loan paydown + $40k appreciation (10.0% local appreciation)).
- Harris County population projected at +47% by 2050 — long-run rental-demand tailwind backs the buy-and-hold thesis.
- By year 2, paydown + projected appreciation supports a ~$69k cash-out refi (75% LTV) — recoverable capital for the next deal without selling this one.
Negotiation context
- Only 10 days on market — expect competitive offers; lowballing is unlikely to land.
- 17 sale attempts with the ask held roughly flat each time — persistent listings suggest the price (not the market) is what's stuck; bring a comps-based counter.
Risks & watch-outs
- Climate carrying-cost: severe wind risk, 99% chance of damaging wind over 30y; extreme-heat days projected 7→24/yr by 2055 (HVAC capex compounding) — expect insurance premiums to compound above CPI over the hold.
Questions for the listing agent
- What do current leases actually rent for vs. the listed asking? Can we see a recent rent roll and the last 12 months of T-12 income?
- What does the HOA fee cover, when was the last increase, and are there any pending special assessments or reserve-fund shortfalls?
- Is there a deadline driving the sale (1031 exchange, divorce, estate, relocation)? That informs how much negotiation room exists.
- Schools are D-rated, which usually means shorter tenancies and higher turnover. Who's the typical renter profile here, and what's been the actual vacancy rate?
- Crime grade is F in this area — have there been break-ins, vandalism, or insurance claims at this property in the last 3 years? What carrier currently insures it and at what premium?
- The area grade is low — what's the realistic commute time and amenity access for the typical tenant pool here? Any planned neighborhood developments (good or bad) we should know about?
- What's the average days-on-market for RENTAL listings here right now (not sales)? A rising rental-DOM trend means longer vacancies and softer asking-rent achievability than the comps imply.
- What's the recent tenant-quality profile in this submarket — average credit score on applications, eviction rate, late-payment / NSF rate, and stable-employment percentage? A property-management company in the area should have these aggregated.
- How much new for-sale + rental construction is in the pipeline within 1–3 miles? Heavy new supply typically softens prices + rents 12–24 months out; constrained supply supports both.
Investment metrics
- 1% rule
- 0.64% ✗
- Cap rate
- 4.68%
- Cash-on-cash
- -5.76%
- DSCR
- 0.74
- GRM
- 13.1
CMA / ARV
- ARV (median comp)
- $403,005
- List price
- $389,900
- Delta
- -3.25%
- Verdict
- FAIR
- Comps
- 20 within 1.0 mi
Show comp detail 8 sales within ~0.75 mi
| Address | Dist | Beds/Ba | Sqft | Sold | Price | $/sf | Match |
|---|---|---|---|---|---|---|---|
| 437 Meadow St | 0.35mi | 2/2.0 (-1) | 1,835 (+4%) | 4mo | $299,900 | $163 | 62 |
| 3116 Baer St | 0.34mi | 3/3.5 | 1,792 (+2%) | 24mo | $395,000 | $220 | 62 |
| 2905 Baer St #3 | 0.23mi | 3/2.5 | 2,020 (+15%) | 9mo | $325,000 | $161 | 54 |
| 9430 Mills ST | 0.68mi | 3/3.0 | 1,728 (-2%) | 16mo | $350,000 | $203 | 49 |
| 349 Sydnor St | 0.42mi | 2/2.0 (-1) | 2,020 (+15%) | 2mo | $309,900 | $153 | 44 |
| 328 Eado Park Cir | 0.40mi | 3/3.5 | 1,984 (+12%) | 22mo | $415,988 | $210 | 42 |
| 2819 Clinton Dr | 0.42mi | 3/2.0 | 1,589 (-10%) | 23mo | $325,000 | $205 | 39 |
| 311 Sydnor St #311 | 0.43mi | 2/2.0 (-1) | 1,956 (+11%) | 18mo | $355,000 | $181 | 35 |
Match score weights: distance 35% · size 25% · config 20% · recency 20%. Top-matched comps best support the ARV.
Projected returns pro-forma
10.0% appreciation · 4.27% rent growth · sell at horizon
- IRR
- 20.5%
- Equity multiple
- 2.67×
- Total profit
- $188,194
- Equity at exit
- $363,059
- IRR
- 18.9%
- Equity multiple
- 6.21×
- Total profit
- $588,237
- Equity at exit
- $782,950
Cash invested: $112,841 (down + closing). Projections, not guarantees.
Landlord ↔ Tenant lean methodology
- Overall (STATE)
- 87 Strongly Landlord-Friendly
- State Texas
- 87 Strongly Landlord-Friendly · R+5
- County
- — inherits STATE
- City
- — inherits STATE
ZIP-level market 77020
- Home prices YoY
- 29.1%
- Rents YoY
- 4.3%
- Active inventory
- 339
- Price-to-rent
- 12.7×
Monthly cashflow live
- Estimated rent
- $2,562 high interval (Pro) →
- Mortgage (P&I)
- −$2,113
- Tax from tax record
- −$77 /mo · $922/yr
- Insurance
- −$168
- HOA
- −$208
- Vacancy / Maint / Mgmt
- −$538
- Net cashflow
- $-542
Break-even live
Sensitivity live
| Price | -10% $-314 | -5% $-428 | +0% $-542 | +5% $-656 | +10% $-770 |
|---|---|---|---|---|---|
| Rent | -10% $-744 | -5% $-643 | +0% $-542 | +5% $-441 | +10% $-339 |
| Rate | -1.0pp $-339 | -0.5pp $-439 | base $-542 | +0.5pp $-646 | +1.0pp $-753 |
UW: 25.0% down · 7.5% · 30yr · 1.5% tax · 5.0% vac · 8.0% maint · 8.0% mgmt
Financing live
Cash to close
- Down payment
- $100,751
- Closing costs
- $12,090
- Reserves months
- —
- Total cash needed
- —
Loan-product check · same deal, 3 products live
Conventional
25% down · 7.5% · 30yr
- Down + closing
- —
- Monthly P&I
- —
- Monthly cashflow
- —
- DSCR
- —
- Eligible?
- —
Personal DTI + credit; lowest rate.
DSCR
20% down · 8.5% · 30yr
- Down + closing
- —
- Monthly P&I
- —
- Monthly cashflow
- —
- DSCR
- —
- Eligible?
- —
No personal income docs; deal must DSCR.
Hard money
10% down · 12.0% · 12mo
- Down + closing
- —
- Monthly P&I
- —
- Monthly cashflow
- —
- DSCR
- —
- Eligible?
- —
Short-term bridge; refi at stabilization.
Rent comps 40 comps
| Address | Beds | Baths | Sqft | Rent | $/sqft | DOM | Units | Dist |
|---|---|---|---|---|---|---|---|---|
| 2905 Baer St Unit 1047953P Houston, TX | 3.0 | 2.5 | 1991 | $2,922 | $1.47 | 0d | 1 | 0.22mi |
| 1303 Bayou St Unit C Houston, TX | 3.0 | 3.0 | 1869 | $3,200 | $1.71 | 45d | 1 | 0.27mi |
| 1307 Bayou St Unit B Houston, TX | 3.0 | 3.0 | 1814 | $2,400 | $1.32 | 9d | 1 | 0.27mi |
| 611 Sydnor St Houston, TX | 3.0 | 4.0 | 2157 | $2,400 | $1.11 | 45d | 1 | 0.31mi |
| 3300 Lyons Ave Unit 304 Houston, TX | 4.0 | 2.0 | 1393 | $1,460 | $1.05 | 45d | 1 | 0.43mi |
| 3410 Baer St Houston, TX | 3.0 | 4.0 | 2040 | $3,500 | $1.72 | 45d | 1 | 0.47mi |
| 1513 Cage St Houston, TX | 3.0 | 2.0 | 1467 | $1,550 | $1.06 | 45d | 1 | 0.48mi |
| 3419 Gillespie St Houston, TX | 3.0 | 3.5 | 2168 | $2,300 | $1.06 | 45d | 1 | 0.49mi |
| 308 Grove St Houston, TX | 3.0 | 3.0 | 1701 | $2,350 | $1.38 | 9d | 1 | 0.50mi |
| 91 Jensen Dr Houston, TX | 3.0 | 1.0–2.5 | 970 | $3,420 | $3.52 | 0d | 67 | 0.57mi |
| 4109 Hare St Unit A Houston, TX | 4.0 | 2.5 | 1913 | $6,950 | $3.63 | 45d | 1 | 0.74mi |
| 4109 Hare St Unit 1019559P Houston, TX | 4.0 | 2.5 | 1905 | $6,852 | $3.60 | 9d | 1 | 0.74mi |
| 1250 Leona St Houston, TX | 2.0 | 1.0–2.0 | 885 | $1,990 | $2.25 | 0d | 15 | 0.75mi |
| 2115 Runnels St Unit 3187 Houston, TX | 3.0 | 2.0 | 1839 | $3,005 | $1.63 | 0d | 1 | 0.76mi |
| 2115 Runnels St Unit 3174 Houston, TX | 3.0 | 2.0 | 1839 | $3,056 | $1.66 | 14d | 1 | 0.76mi |
| 2115 Runnels St Unit 3174 Houston, TX | 3.0 | 2.0 | 1839 | $3,056 | $1.66 | 0d | 1 | 0.76mi |
| 2115 Runnels St Unit 2148 Houston, TX | 3.0 | 2.0 | 1839 | $3,045 | $1.66 | 13d | 1 | 0.76mi |
| 800 Middle St Houston, TX | 1.0–4.0 | 1.0–2.0 | 1003 | $1,593 | $1.59 | 7d | 1 | 0.78mi |
| 2315 Navigation Blvd Houston, TX | 1.0–2.0 | 1.0–2.5 | 943 | $3,500 | $3.71 | 0d | 62 | 0.86mi |
| 2404 Navigation Blvd Unit 2187 Houston, TX | 2.0 | 2.0 | 1309 | $2,321 | $1.77 | 0d | 1 | 0.92mi |
| 2404 Navigation Blvd Unit 422 Houston, TX | 2.0 | 2.0 | 1309 | $2,296 | $1.75 | 9d | 1 | 0.92mi |
| 2404 Navigation Blvd Unit 2441 Houston, TX | 2.0 | 2.0 | 1309 | $2,280 | $1.74 | 0d | 1 | 0.92mi |
| 2404 Navigation Blvd Unit 424 Houston, TX | 2.0 | 2.0 | 1309 | $2,296 | $1.75 | 7d | 1 | 0.92mi |
| 4300 Lyons Ave Unit 304 Houston, TX | 4.0 | 2.0 | 1393 | $1,460 | $1.05 | 45d | 1 | 0.97mi |
| 15 N Chenevert St Houston, TX | 2.0 | 1.0–2.0 | 1351 | $4,000 | $2.96 | 0d | 16 | 0.97mi |
| 2414 East Dr Unit Canal St unit Houston, TX | 3.0 | 3.5 | 2063 | $2,950 | $1.43 | 9d | 1 | 0.98mi |
| 1222 Upton St Houston, TX | 3.0 | 4.0 | 2055 | $2,600 | $1.27 | 45d | 1 | 1.03mi |
| 6 N Main St Houston, TX | 2.0 | 2.0 | 1248 | $2,453 | $1.97 | 45d | 1 | 1.07mi |
| 6 N Main St Houston, TX | 2.0 | 2.0 | 1248 | $2,453 | $1.97 | 22d | 1 | 1.07mi |
| 1625 N Main St Houston, TX | 3.0 | 1.0–3.0 | 994 | $2,354 | $2.37 | 0d | 41 | 1.15mi |
| 915 Franklin St Unit 312202 Houston, TX | 2.0 | 2.0 | 1398 | $1,987 | $1.42 | 45d | 1 | 1.21mi |
| 915 Franklin St Unit ID51118 Houston, TX | 2.0 | 2.0 | 1342 | $2,000 | $1.49 | 45d | 1 | 1.21mi |
| 201 Main St Unit 12258 Houston, TX | 2.0 | 2.0 | 1308 | $2,250 | $1.72 | 45d | 1 | 1.25mi |
| 4706 Hershe St Houston, TX | 3.0 | 2.5 | 2283 | $3,300 | $1.45 | 45d | 1 | 1.25mi |
| 500 Crawford St Houston, TX | 1.0–2.0 | 1.0–2.0 | 1039 | $2,315 | $2.23 | 45d | 32 | 1.28mi |
| 4712 Rawley St Unit a Houston, TX | 3.0 | 2.0 | 1501 | $2,070 | $1.38 | 22d | 1 | 1.31mi |
| 4712 Rawley St Unit B Houston, TX | 3.0 | 2.5 | 1501 | $2,045 | $1.36 | 22d | 1 | 1.31mi |
| 1475 Texas Ave Unit 2187 Houston, TX | 2.0 | 2.0 | 1233 | $2,865 | $2.32 | 0d | 1 | 1.33mi |
| 1475 Texas Ave Unit 2162 Houston, TX | 2.0 | 2.0 | 1233 | $2,840 | $2.30 | 7d | 1 | 1.33mi |
| 1475 Texas Ave Unit 422 Houston, TX | 2.0 | 2.0 | 1233 | $2,840 | $2.30 | 9d | 1 | 1.33mi |
HOA detail
- Monthly dues
- $208 · $2,496/yr
- Likely covers
- security
Listing history 45 events
-
2026-06-21days on market $389,900 Active 10 DOM
-
2026-06-18days on market $389,900 Active 7 DOM
-
2026-06-17days on market $389,900 Active 6 DOM
-
2026-06-16days on market $389,900 Active 5 DOM
-
2026-06-15days on market $389,900 Active 4 DOM
-
2026-06-13days on market $389,900 Active 2 DOM
-
2026-06-09days on market $389,900 Active 13 DOM
-
2026-06-08days on market $389,900 Active 12 DOM
-
2026-06-07days on market $389,900 Active 11 DOM
-
2026-06-04days on market $389,900 Active 8 DOM
-
2026-06-03days on market $389,900 Active 7 DOM
-
2026-06-02days on market $389,900 Active 6 DOM
-
2026-06-01days on market $389,900 Active 5 DOM
-
2026-05-31days on market $389,900 Active 4 DOM
-
2026-05-06$389,900 Active 935-char remark
-
2026-05-05historical
-
2026-04-25price $389,900
-
2026-04-15$399,900 Active
-
2026-04-14historical
-
2026-03-25$399,900 Active
-
2026-03-24historical
-
2026-03-04$399,900 Active
-
2026-03-03historical
-
2026-02-11$409,900 Active
-
2026-02-10historical
-
2026-01-14$409,900 Active
-
2026-01-13historical
-
2025-12-18$409,900 Active
-
2025-12-16historical
-
2025-11-28price $409,900
-
2025-11-27$399,900 Active
-
2025-11-25historical
-
2025-11-06$409,900 Active
-
2025-11-05historical
-
2025-10-29$409,900 Active
-
2025-10-22historical
-
2025-10-02$409,900 Active
-
2025-10-01historical
-
2025-09-18$399,900 Active
-
2025-09-16historical
-
2025-08-28$399,900 Active
-
2025-08-19historical
-
2025-07-21$399,900 Active
-
2025-06-24historical
-
2025-05-31$399,900 Active
ⓘ Source: listings_history table (triggers on properties + properties_extension) + one-shot
backfill from property_details.listing_events for pre-trigger history.
Tax reassessment forecast TX · Resets to sale price
- Current annual tax
- $922 · $77/mo
- Projected year-2 tax
- $7,135 · $595/mo
- Expected delta
- +$6,213/yr (+$518/mo · 673.6%)
ⓘ Screening estimate from a state-policy table — verify with the county assessor before closing.
Climate risk First Street
- Flood 1/10 Low FEMA zone X (unshaded) · 0% chance over 30 yrs
- Wildfire 1/10 Low
- Heat 9/10 Extreme 7 d/yr ≥109°F today · 24 d/yr by 30 yrs out
- Wind 9/10 Extreme 99% chance of damaging wind over 30 yrs
- Air quality 3/10 Moderate 2 unhealthy d/yr today · 3 by 30 yrs out
Nearby sold comps map
Loading sold comps map…
Walkable amenities ~0.75 mi
Loading nearby amenities…
Taxation est. · year 1
- Rental income
- $30,749
- − Mortgage interest
- −$22,575
- − Property taxes
- −$922
- − Insurance
- −$2,015
- − Repairs & maintenance
- −$2,460
- − Management
- −$2,460
- − HOA
- −$2,496
- − Depreciation
- −$11,724
- Taxable loss
- −$13,903
- Est. tax savings @ 24.0%
- +$3,337
- After-tax cash flow
- $-3,166/yr
For passive investors: Depreciation is non-cash, so a rental often shows a tax loss while cash-flowing — sheltering income. Rental losses are passive: they offset passive income freely, and up to $25,000/yr can offset ordinary (W-2) income if you actively participate and your MAGI is under $100k (phasing out to $0 by $150k); unused losses carry forward. On sale, claimed depreciation is recaptured at up to 25%, and gains may owe capital-gains tax (a 1031 exchange can defer both). Figures are a year-1 estimate at your 24.0% rate — not tax advice; consult a CPA.
Condition & rehab AI · 13 photos
This three-story townhome in a new gated community near Downtown Houston is in excellent condition with no visible repairs needed. It offers modern amenities and a prime location, making it an ideal investment.
Value-add opportunities
- Both Painting the exterior — Enhances curb appeal and value
- Both Landscaping improvements — Enhances curb appeal and value
- Both Add a smart home system — Improves convenience and adds value
Renovation cost estimate screening
Value-add ROI direction
- Both Painting the exterior — Enhances curb appeal and value ↑
- Both Landscaping improvements — Enhances curb appeal and value ↑
- Both Add a smart home system — Improves convenience and adds value ↑
ⓘ Cost ranges are severity-bucket heuristics (US national rule-of-thumb). Get contractor quotes + a written scope before underwriting a rehab budget.
Schools (NCES district)
- District
- Houston ISD
- NCES district ID
- 4823640
- Math proficiency
- 27% ▼ -18.00%
- Reading proficiency
- 35% ▼ -6.00%
- Median HH income
- $46,054
- Composite
- 26.63/100
- National rank
- #7173
- State rank
- #593 of 826 in TX
Livability — Houston
- Score
- 74/100
- State rank
- #184
- US rank
- #4771
Category grades
Schools grade is shown separately in the Schools card above.
Census & demographics
- Census place
- Houston, TX
- County
- Harris County · 4,702,590 people
- City population
- 3,226,434
- Metro
- Houston-The Woodlands-Sugar Land, TX
- Population (ZIP)
- 23,686
- Household income
- $50,119
- Rent vs Own
- Severe rent burden
- 969.0
Population outlook (Harris County) Hauer SSP2
- Today (2025)
- 5,571,493 people
- By 2030
- 6,089,821 · +9.3%
- By 2040
- 7,142,806 · +28.2%
- By 2050
- 8,185,864 · +46.9%
- By 2075
- 10,574,329 · +89.8%
- By 2100
- 12,109,958 · +117.4%
Race, ethnicity, and origin ACS 2023
- Neighborhood character
- Predominantly Hispanic (69%)
- Race & ethnicity
- Hispanic / Latino 69% Black 24% Two or more races 22% White 5% Asian 1%
- Hispanic origin (detail)
- Mexican 60%
- Common ancestry
- Swiss 1%
- Foreign-born
- 23% · Canada
- Languages at home
- 39% English-only · Spanish 59% Other Indo-European 1%
Political lean MEDSL · Harris
- 2024 margin
- Lean D (+5.5) · D 52.0% · R 46.4% · Other 1.6%
- 2008→2024 swing
- +3.9pp toward D · 2008: 1.6pp · 2024: 5.5pp
- All cycles
- 2024: D+5.5 2020: D+13.3 2016: D+12.4 2012: D+0.1 2008: D+1.6
Not yet ingested
- Civics
- —
Market trends
- HPI YoY
- ▲ 55.64%
- Current HPI
- 246.5578
- Rent YoY
- ▲ 4.27%
- Metro
- Houston-The Woodlands-Sugar Land, TX
- State GDP YoY
- ▲ 3.95%
- F500 in state
- 110
Industry mix (Fortune 500 HQ in TX)
| Industry | F500 HQs | Revenue |
|---|---|---|
| Energy | 16 | $1,198B |
|
||
| Technology | 5 | $198B |
|
||
| Engineering / Construction | 4 | $72B |
|
||
| Energy Services | 3 | $60B |
|
||
| Utilities | 3 | $41B |
|
||
| Healthcare | 2 | $330B |
|
||
Price history
-2.5% since first listed35 events — show timeline
- 2026-06-11 Listed $389,900 HARMLS
- 2026-06-10 Listing Removed — HARMLS
- 2026-05-27 Listed $389,900 HARMLS
- 2026-05-26 Listing Removed — HARMLS
- 2026-05-06 Listed $389,900 HARMLS
- 2026-05-05 Listing Removed — HARMLS
- 2026-04-25 Price Changed $389,900 HARMLS
- 2026-04-15 Listed $399,900 HARMLS
- 2026-04-14 Listing Removed — HARMLS
- 2026-03-25 Listed $399,900 HARMLS
- 2026-03-24 Listing Removed — HARMLS
- 2026-03-04 Listed $399,900 HARMLS
- 2026-03-03 Listing Removed — HARMLS
- 2026-02-11 Listed $409,900 HARMLS
- 2026-02-10 Listing Removed — HARMLS
- 2026-01-14 Listed $409,900 HARMLS
- 2026-01-13 Listing Removed — HARMLS
- 2025-12-18 Listed $409,900 HARMLS
- 2025-12-16 Listing Removed — HARMLS
- 2025-11-28 Price Changed $409,900 HARMLS
- 2025-11-27 Listed $399,900 HARMLS
- 2025-11-25 Listing Removed — HARMLS
- 2025-11-06 Listed $409,900 HARMLS
- 2025-11-05 Listing Removed — HARMLS
- 2025-10-29 Listed $409,900 HARMLS
- 2025-10-22 Listing Removed — HARMLS
- 2025-10-02 Listed $409,900 HARMLS
- 2025-10-01 Listing Removed — HARMLS
- 2025-09-18 Listed $399,900 HARMLS
- 2025-09-16 Listing Removed — HARMLS
- 2025-08-28 Listed $399,900 HARMLS
- 2025-08-19 Listing Removed — HARMLS
- 2025-07-21 Listed $399,900 HARMLS
- 2025-06-24 Listing Removed — HARMLS
- 2025-05-31 Listed $399,900 HARMLS
Property tax history
+9.9%/yrLatest (2025): $922 · +39.5% YoY. Source: county tax records.
Cash-flow waterfall
monthlySold comps — $/sqft
last 12 mo · ≤1 miLoading sold comps…