 🏗️ New Construction
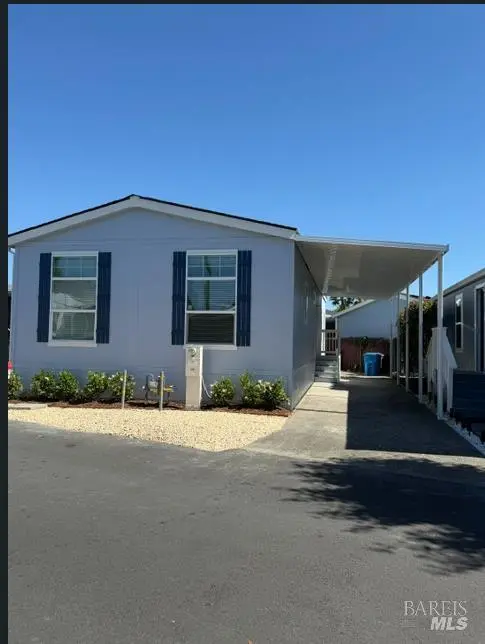
246 Apple Ln · Santa Rosa, CA
Flood risk 1/10 · Minimal
- FEMA flood zone
- X (unshaded)
- Chance of flooding over 30 yrs
- 0.0%
- Est. flood insurance / yr
- $507 – $1,088
Fire risk 6/10 · Moderate
- Est. fire insurance / yr
- $659 – $1,223
Heat risk 4/10 · Minor
- Hot days now (above 92°F)
- 7 days/yr
- Hot days in 30 yrs
- 16 days/yr
Wind risk 1/10 · Minimal
- Chance of severe wind over 30 yrs
- —
Air-quality risk 8/10 · Major
- Unhealthy air days now
- 15 days/yr
- Unhealthy air days in 30 yrs
- 17 days/yr
Risk factors via First Street. Map © Google.
Why this score? — see what drove the B grade
The composite is a weighted blend of 9 inputs, each scored 0–100. Each bar is that input's sub-score; the figure is the points it added to the 100-point composite (weight × sub-score).
- Cash flow +30.0/30.0
- 1% rule +10.0/10.0
- DSCR +10.0/10.0
- ARV discount +7.5/15.0
- Condition / age +4.0/5.0
- Livability +3.8/5.0
- Schools +3.7/10.0
- Rent growth +3.2/5.0
- Appreciation +0.0/10.0
$199,995
🖨 Deal sheet 📄 Offer letter ✓ Due diligence
Listing remarks
Brand new home in a preferred all age-family community. This home features 3 bedrooms and 2 full baths. Tastefully upgraded with 9' ceilings, granite counters, wood cabinets, stainless steel appliances and finishing touches. Your chance to own a brand-new home awaits.
Key facts
- 2 parking spots
- Built 2026
- Listed 71 days
Property features AI
Finance
- Other: Located in Mountain View Mobile Estates park
- Financial info: Land lease amount $1,895
- HOA & community: No association; Not a senior community
Exterior
- Parking: Covered parking; 2 parking spaces; Guest parking available
- Security: Carbon monoxide detector; Smoke detector
- Utilities: Gas plumbed; Public sewer
- Home design: Manufactured in-park; Double-wide; New construction
- Construction: Redman Homes make; Champion Home Builders manufacturer; Wood skirt
- Exterior features: Composition roof
Interior
- Kitchen: Island; Stone counters; Dishwasher; Disposal; Free-standing gas range; Hood over range; Microwave
- Bedrooms: 3 bedrooms
- Flooring: Carpet; Laminate
- Bathrooms: 2 full bathrooms; Shower stall(s); Tub with shower over
- Heating & cooling: Central heating; Ceiling fans
- Interior features: Island kitchen with stone countertops; Dishwasher; Disposal; Free-standing gas range; Hood over range; Microwave; Gas water heater; Carbon monoxide detector; Smoke detector
- Laundry & utility: Washer/dryer hookups only
Neighborhood map
What this means for you Summary
Snapshot
- This is a 3-bed/2.0-bath manufactured listed at $200k. Condition is rated good.
Deal economics
- At list price, monthly cash flow is $983 ($12k/yr) — positive.
- The deal already cash-flows at list — no discount required.
- Meets the 1% rule at list price ($3k rent vs $200k).
- Recommended offer: $188k (6.0% below list) — sets the bar for market timing.
- Cap rate 12.7% vs local median 2.5% in Santa Rosa — top-decile yield for the area; either an underpriced asset or a hidden risk that comps aren't pricing in. Stress-test before assuming the spread holds.
Location & tenants
- Location reads 75/100 on livability (#112 in CA, #3,940 nationally) — a middle-class / working-renter tenant base. Strengths: amenities A+, commute A+, employment A+; Watch: schools C-, cost of living F.
- Santa Rosa High (urban): math 31% / reading 47% proficiency, ranked #703 of 1,400 in CA (top 50%) — families likely to look elsewhere, expect single-tenant / working-renter base with shorter leases.
- Market conditions: Rents rising (+2.9%/yr); 120 active listings in the ZIP; 16 comparable units currently listed for rent nearby; rentals leasing fast (median 14d on market — plan ~1-2 weeks tenant-placement turnaround); solid renter incomes; 1,039 units permitted in Sonoma County in 2024 (185 in 5+ unit buildings).
- This rent runs 41% of the median local income ($83k/yr) — at the standard rent-burdened threshold; future hikes will face affordability resistance.
Forward outlook
- Local home prices are declining (-3.0%/yr); year-one equity from $1k of loan paydown is wiped out by about $6k of value loss. Plan a longer hold.
- Sonoma County population projected at +8% by 2050 — modest demand growth; plan on rents tracking national, not racing it.
- At projected returns (-3.0% appreciation + 2.9% rent growth), your $52k cash investment doubles in ~6 years — after that, you're playing with house money.
Negotiation context
- It's been on market 71 days — a 6% lower offer ($188k) is reasonable based on typical stale-listing flexibility.
Risks & watch-outs
- Climate carrying-cost: major wildfire risk — expect insurance premiums to compound above CPI over the hold.
Questions for the listing agent
- It's been on market 71 days. Have you received any prior offers? Is the seller open to a 6% concession, seller financing, or rate buy-down credit?
- Why hasn't it sold? Are there any deal-killer items the seller is aware of (foundation, flood, title, zoning, code violations)?
- Is there a deadline driving the sale (1031 exchange, divorce, estate, relocation)? That informs how much negotiation room exists.
- What's the average days-on-market for RENTAL listings here right now (not sales)? A rising rental-DOM trend means longer vacancies and softer asking-rent achievability than the comps imply.
- What's the recent tenant-quality profile in this submarket — average credit score on applications, eviction rate, late-payment / NSF rate, and stable-employment percentage? A property-management company in the area should have these aggregated.
- How much new for-sale + rental construction is in the pipeline within 1–3 miles? Heavy new supply typically softens prices + rents 12–24 months out; constrained supply supports both.
Investment metrics
- 1% rule
- 1.55% ✓
- Cap rate
- 12.68%
- Cash-on-cash
- 22.80%
- DSCR
- 2.01
- GRM
- 5.4
CMA / ARV
- ARV (on-the-fly)
- $184,828
- Comps found
- 12
Show comp detail 12 sales within ~0.75 mi
| Address | Dist | Beds/Ba | Sqft | Sold | Price | $/sf | Match |
|---|---|---|---|---|---|---|---|
| 205 Pear Ln | 0.04mi | 3/2.0 | 1,104 (-2%) | 8mo | $160,000 | $145 | 88 |
| 305 Aileen Ave | 0.08mi | 2/2.0 (-1) | 1,100 (-2%) | 0mo | $105,000 | $95 | 87 |
| 196 Pear Ln | 0.06mi | 3/2.0 | 1,106 (-2%) | 14mo | $165,000 | $149 | 83 |
| 220 Ricardo Ave | 0.17mi | 2/2.0 (-1) | 1,100 (-2%) | 1mo | $179,000 | $163 | 82 |
| 275 Ricardo Ave | 0.13mi | 2/2.0 (-1) | 1,248 (+11%) | 9mo | $190,000 | $152 | 64 |
| 102 Apple Ln | 0.16mi | 3/2.0 | 1,216 (+8%) | 19mo | $127,000 | $104 | 63 |
| 116 Coachman Ln #27 | 0.56mi | 3/2.0 | 1,050 (-7%) | 11mo | $237,950 | $227 | 53 |
| 2313 Calico Ln #67 | 0.56mi | 2/2.0 (-1) | 1,080 (-4%) | 16mo | $187,000 | $173 | 49 |
| 38 Wayside Dr | 0.57mi | 2/2.0 (-1) | 1,040 (-8%) | 9mo | $205,000 | $197 | 48 |
| 3050 El Toro Way | 0.28mi | 2/2.0 (-1) | 1,000 (-11%) | 18mo | $188,500 | $189 | 48 |
| 144 El Crystal Dr | 0.73mi | 3/2.0 | 1,056 (-6%) | 15mo | $259,000 | $245 | 43 |
| 146 N Star Dr | 0.67mi | 3/2.0 | 960 (-15%) | 11mo | $157,000 | $164 | 35 |
Match score weights: distance 35% · size 25% · config 20% · recency 20%. Top-matched comps best support the ARV.
Projected returns pro-forma
-3.0% appreciation · 2.93% rent growth · sell at horizon
- IRR
- 15.6%
- Equity multiple
- 1.63×
- Total profit
- $32,511
- Equity at exit
- $27,558
- IRR
- 24.2%
- Equity multiple
- 3.09×
- Total profit
- $108,292
- Equity at exit
- $15,981
Cash invested: $51,752 (down + closing). Projections, not guarantees.
Landlord ↔ Tenant lean methodology
- Overall (STATE)
- 18 Strongly Tenant-Friendly
- State California
- 18 Strongly Tenant-Friendly · D+13
- County
- — inherits STATE
- City
- — inherits STATE
ZIP-level market 95407
- Rents YoY
- 2.9%
- Active inventory
- 120
- Price-to-rent
- 5.8×
Monthly cashflow live
- Estimated rent
- $2,861 high interval (Pro) →
- Mortgage (P&I)
- −$969
- Tax est. 1.5%
- −$231 /mo · $2,772/yr
- Insurance
- −$77
- HOA
- −$0
- Vacancy / Maint / Mgmt
- −$601
- Net cashflow
- $983
Break-even live
UW: 25.0% down · 7.5% · 30yr · 1.5% tax · 5.0% vac · 8.0% maint · 8.0% mgmt
Financing live
Cash to close
- Down payment
- $46,207
- Closing costs
- $5,545
- Reserves months
- —
- Total cash needed
- —
Loan-product check · same deal, 3 products live
Conventional
25% down · 7.5% · 30yr
- Down + closing
- —
- Monthly P&I
- —
- Monthly cashflow
- —
- DSCR
- —
- Eligible?
- —
Personal DTI + credit; lowest rate.
DSCR
20% down · 8.5% · 30yr
- Down + closing
- —
- Monthly P&I
- —
- Monthly cashflow
- —
- DSCR
- —
- Eligible?
- —
No personal income docs; deal must DSCR.
Hard money
10% down · 12.0% · 12mo
- Down + closing
- —
- Monthly P&I
- —
- Monthly cashflow
- —
- DSCR
- —
- Eligible?
- —
Short-term bridge; refi at stabilization.
Rent comps 16 comps
| Address | Beds | Baths | Sqft | Rent | $/sqft | DOM | Units | Dist |
|---|---|---|---|---|---|---|---|---|
| 240 Burt St Santa Rosa, CA | 1.0–2.0 | 1.0–2.0 | 742 | $2,563 | $3.45 | 13d | 10 | 0.14mi |
| 524 Court St Santa Rosa, CA | 2.0 | 2.5 | 1171 | $2,750 | $2.35 | 13d | 1 | 0.17mi |
| 2327 Summercreek Dr Santa Rosa, CA | 1.0–2.0 | 1.0–2.0 | 1083 | $2,920 | $2.69 | 13d | 6 | 0.23mi |
| 325 Yolanda Ave Santa Rosa, CA | 1.0–3.0 | 1.0–2.0 | 1144 | $3,526 | $3.08 | 13d | 15 | 0.41mi |
| 1018 Bellevue Ave Santa Rosa, CA | 1.0–4.0 | 1.0–2.0 | 1010 | $2,145 | $2.12 | 13d | 1 | 0.46mi |
| 1020 Kawana Springs Rd Santa Rosa, CA | 1.0–3.0 | 1.0–2.0 | 890 | $3,549 | $3.99 | 13d | 27 | 0.65mi |
| 2146 Bedford St Unit 2130-101 Santa Rosa, CA | 2.0 | 2.0 | 920 | $2,450 | $2.66 | 13d | 1 | 0.67mi |
| 2585 Kenton Ct Unit B Santa Rosa, CA | 2.0 | 1.0 | 789 | $2,150 | $2.72 | 13d | 1 | 0.71mi |
| 2111 Kawana Springs Rd Santa Rosa, CA | 1.0–3.0 | 1.0–2.0 | 936 | $3,465 | $3.70 | 13d | 8 | 0.74mi |
| 2350 Corby Ave Santa Rosa, CA | 2.0 | 1.0 | 903 | $2,185 | $2.42 | 13d | 1 | 0.75mi |
| 2150 Onyx Way Santa Rosa, CA | 3.0 | 2.5 | 1240 | $3,000 | $2.42 | 21d | 1 | 0.83mi |
| 147 Colgan Ave Santa Rosa, CA | 1.0–2.0 | 1.0 | 623 | $1,941 | $3.12 | 13d | 3 | 0.99mi |
| 1501 Patty Pl Unit 3075 Santa Rosa, CA | 3.0 | 2.0 | 1047 | $2,850 | $2.72 | 13d | 1 | 1.12mi |
| 1501 Patty Pl Unit 1555 Santa Rosa, CA | 2.0 | 2.0 | 747 | $1,995 | $2.67 | 13d | 1 | 1.12mi |
| 1501 Patty Pl Unit 1591 Santa Rosa, CA | 2.0 | 2.0 | 747 | $2,500 | $3.35 | 13d | 1 | 1.12mi |
| 517 Debbie Dr Santa Rosa, CA | 3.0 | 2.0 | 1205 | $3,000 | $2.49 | 21d | 1 | 1.17mi |
Listing history 18 events
-
2026-06-18days on market $199,995 Active 71 DOM
-
2026-06-17days on market $199,995 Active 70 DOM
-
2026-06-16days on market $199,995 Active 69 DOM
-
2026-06-15days on market $199,995 Active 68 DOM
-
2026-06-14days on market $199,995 Active 66 DOM
-
2026-06-13days on market $199,995 Active 65 DOM
-
2026-06-10days on market $199,995 Active 63 DOM
-
2026-06-09days on market $199,995 Active 62 DOM
-
2026-06-08days on market $199,995 Active 61 DOM
-
2026-06-07days on market $199,995 Active 60 DOM
-
2026-06-05days on market $199,995 Active 57 DOM
-
2026-06-03days on market $199,995 Active 56 DOM
-
2026-06-03price $199,995 Active 55 DOM
-
2026-06-02days on market $219,500 Active 55 DOM
-
2026-06-01days on market $219,500 Active 54 DOM
-
2026-05-31days on market $219,500 Active 53 DOM
-
2026-05-30days on market $219,500 Active 52 DOM
-
2026-04-08$219,500 Active
ⓘ Source: listings_history table (triggers on properties + properties_extension) + one-shot
backfill from property_details.listing_events for pre-trigger history.
Climate risk First Street
- Flood 1/10 Low FEMA zone X (unshaded) · 0% chance over 30 yrs
- Wildfire 6/10 Major
- Heat 4/10 Moderate 7 d/yr ≥92°F today · 16 d/yr by 30 yrs out
- Wind 1/10 Low
- Air quality 8/10 Severe 15 unhealthy d/yr today · 17 by 30 yrs out
Nearby sold comps map
Loading sold comps map…
Walkable amenities ~0.75 mi
Loading nearby amenities…
Taxation est. · year 1
- Rental income
- $34,336
- − Mortgage interest
- −$10,353
- − Property taxes
- −$2,772
- − Insurance
- −$924
- − Repairs & maintenance
- −$2,747
- − Management
- −$2,747
- − Depreciation
- −$5,377
- Taxable income
- $9,416
- Est. tax owed @ 24.0%
- −$2,260
- After-tax cash flow
- $9,538/yr
For passive investors: Depreciation is non-cash, so a rental often shows a tax loss while cash-flowing — sheltering income. Rental losses are passive: they offset passive income freely, and up to $25,000/yr can offset ordinary (W-2) income if you actively participate and your MAGI is under $100k (phasing out to $0 by $150k); unused losses carry forward. On sale, claimed depreciation is recaptured at up to 25%, and gains may owe capital-gains tax (a 1031 exchange can defer both). Figures are a year-1 estimate at your 24.0% rate — not tax advice; consult a CPA.
Condition & rehab AI · 12 photos
This brand-new manufactured home in a preferred all-age family community is in excellent condition with upgrades throughout. It offers a good investment opportunity with potential for further value enhancement through minor updates.
Value-add opportunities
- Both Painting exterior siding — Enhances curb appeal and value.
- Both Landscaping improvements — Enhances curb appeal and value.
- Both Upgrading flooring to hardwood — Improves aesthetics and value.
- Both Upgrading kitchen appliances — Enhances functionality and value.
- Both Upgrading bathroom fixtures — Enhances functionality and value.
Renovation cost estimate screening
Value-add ROI direction
- Both Painting exterior siding — Enhances curb appeal and value. ↑
- Both Landscaping improvements — Enhances curb appeal and value. ↑
- Both Upgrading flooring to hardwood — Improves aesthetics and value. ↑
- Both Upgrading kitchen appliances — Enhances functionality and value. ↑
- Both Upgrading bathroom fixtures — Enhances functionality and value. ↑
ⓘ Cost ranges are severity-bucket heuristics (US national rule-of-thumb). Get contractor quotes + a written scope before underwriting a rehab budget.
Schools (NCES district)
- District
- Santa Rosa High
- NCES district ID
- 0635830
- Math proficiency
- 31% —
- Reading proficiency
- 47% —
- Median HH income
- $62,000
- Composite
- 37.25/100
- National rank
- #8972
- State rank
- #703 of 1400 in CA
Livability — Santa Rosa
- Score
- 75/100
- State rank
- #112
- US rank
- #3940
Category grades
Schools grade is shown separately in the Schools card above.
Census & demographics
- County
- Sonoma County · 449,805 people
- City population
- 210,074
- Metro
- Santa Rosa-Petaluma, CA
- Population (ZIP)
- 42,036
- Household income
- $82,863
- Rent vs Own
- Severe rent burden
- 1943.0
Population outlook (Sonoma County) Hauer SSP2
- Today (2025)
- 539,935 people
- By 2030
- 554,870 · +2.8%
- By 2040
- 573,262 · +6.2%
- By 2050
- 580,715 · +7.6%
- By 2075
- 579,229 · +7.3%
- By 2100
- 547,835 · +1.5%
Race, ethnicity, and origin ACS 2023
- Neighborhood character
- Diverse neighborhood (Simpson 0.56)
- Race & ethnicity
- Hispanic / Latino 59% White 29% Two or more races 13% Asian 7% Black 2% Native American 1%
- Hispanic origin (detail)
- Mexican 50% Puerto Rican 1%
- Common ancestry
- Lithuanian 1% Romanian 1% Italian 1%
- Foreign-born
- 32% · Canada, Vietnam, China
- Languages at home
- 42% English-only · Spanish 50% Other Indo-European 2% Other Asian/Pacific 1%
Political lean MEDSL · Sonoma
- 2024 margin
- Solid D (+46.2) · D 71.4% · R 25.2% · Other 3.3%
- 2008→2024 swing
- -3.4pp toward R · 2008: 49.6pp · 2024: 46.2pp
- All cycles
- 2024: D+46.2 2020: D+51.5 2016: D+47.9 2012: D+44.9 2008: D+49.6
Not yet ingested
- Civics
- —
Market trends
- HPI YoY
- ▼ -852.74%
- Current HPI
- 256.4307
- Rent YoY
- ▲ 2.93%
- Metro
- Santa Rosa-Petaluma, CA
- State GDP YoY
- ▲ 3.21%
- F500 in state
- 116
Industry mix (Fortune 500 HQ in CA)
| Industry | F500 HQs | Revenue |
|---|---|---|
| Technology | 27 | $1,492B |
|
||
| Financial Services | 3 | $174B |
|
||
| Retail | 3 | $44B |
|
||
| Insurance | 3 | $26B |
|
||
| Media / Entertainment | 2 | $115B |
|
||
| Pharmaceuticals / Biotech | 2 | $62B |
|
||
Price history
1 event — show timeline
- 2026-04-08 Listed $219,500 BAREIS
Cash-flow waterfall
monthlySold comps — $/sqft
last 12 mo · ≤1 miLoading sold comps…