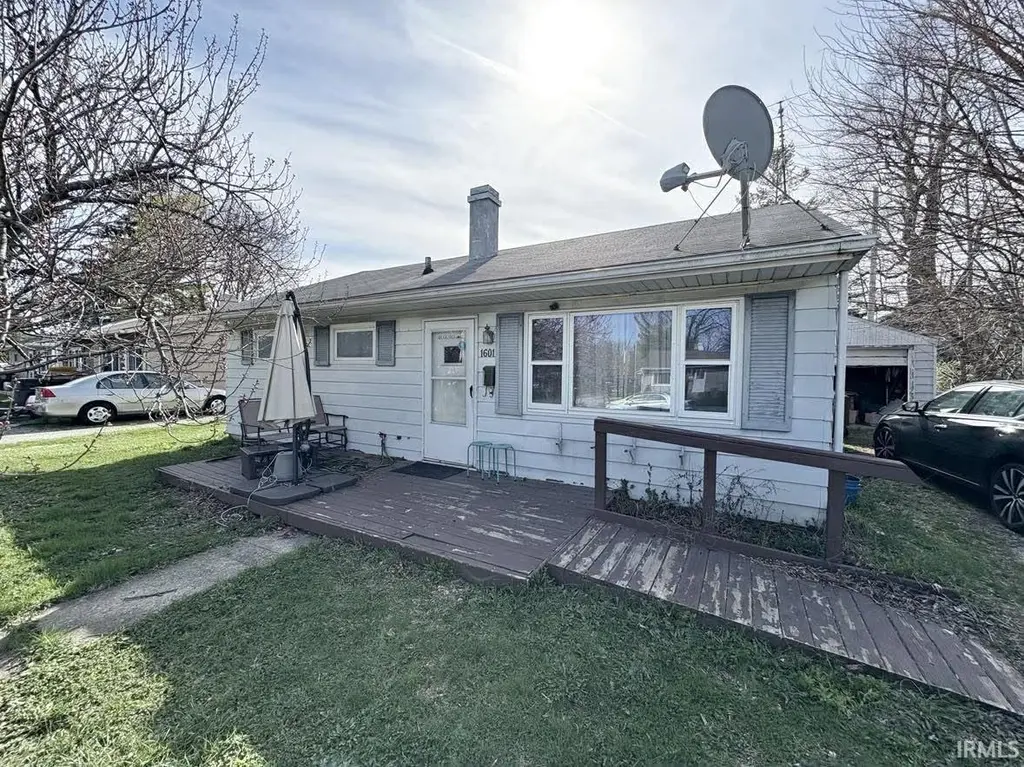
1601 Hillside Ave · Fort Wayne, IN
Flood risk 3/10 · Minor
- FEMA flood zone
- X
- Chance of flooding over 30 yrs
- 0.1%
- Est. flood insurance / yr
- $507 – $1,088
Fire risk 1/10 · Minimal
- Est. fire insurance / yr
- $717 – $1,331
Heat risk 3/10 · Minor
- Hot days now (above 100°F)
- 7 days/yr
- Hot days in 30 yrs
- 17 days/yr
Wind risk 2/10 · Minimal
- Chance of severe wind over 30 yrs
- —
Air-quality risk 3/10 · Minor
- Unhealthy air days now
- 2 days/yr
- Unhealthy air days in 30 yrs
- 3 days/yr
Risk factors via First Street. Map © Google.
Why this score? — see what drove the C+ grade
The composite is a weighted blend of 9 inputs, each scored 0–100. Each bar is that input's sub-score; the figure is the points it added to the 100-point composite (weight × sub-score).
- Cash flow +23.9/30.0
- ARV discount +15.0/15.0
- DSCR +7.7/10.0
- 1% rule +5.1/10.0
- Livability +4.2/5.0
- Rent growth +2.7/5.0
- Condition / age +2.5/5.0
- Schools +2.2/10.0
- Appreciation +0.0/10.0
$115,000
🖨 Deal sheet (PDF) 📄 Offer letter ✓ Due diligence
Listing remarks
Value Opportunity in the '05! 3 Bed, 1 Bath, 875 Sq Ft Home in Central Location just north of Downtown Fort Wayne. Mechanical systems in good working condition. 22x16 Detached Garage. Fenced Backyard. All Appliances Remain. Interior Needs Updated. Sold As-Is. Contingent on Seller's Finding Suitable Housing. Affordable Home or Investment Property to Add to Your Portfolio - Cash or Conventional Offers Only. Schedule Your Showing Today!
Key facts
- 5,924 sq ft lot
- Garage
- Built 1954
Property features AI
Exterior
- Parking: Detached off-street garage (1 car)
- Utilities: Public water; Public sewer; Electric service
- Home design: Single-family residence (site-built); One-story
- Construction: Aluminum siding; Slab foundation; Built as site-built home
- Exterior features: Chain-link fencing; Level lot; Lot dimensions approximately 54 x 112 x 53 x 111
Interior
- Kitchen: Refrigerator; Electric range
- Bedrooms: Total rooms: 5
- Bathrooms: 1 full bathroom (main level)
- Heating & cooling: Electric forced-air heating; Central air; Ceiling fan(s) for cooling
- Interior features: Ceiling fans; Window treatments
- Laundry & utility: Washer; Dryer; Main-level laundry; Electric water heater
Neighborhood map
What this means for you Summary
Snapshot
- This is a 3-bed/1.0-bath single-family listed at $115k.
Deal economics
- At list price, monthly cash flow is $223 ($3k/yr) — positive.
- The deal already cash-flows at list — no discount required.
- Meets the 1% rule at list price ($1k rent vs $115k).
- Recommended offer: $112k (3.0% below list) — sets the bar for market timing.
- Cap rate 8.6% vs local median 4.8% in Fort Wayne — top-decile yield for the area; either an underpriced asset or a hidden risk that comps aren't pricing in. Stress-test before assuming the spread holds.
Location & tenants
- Location reads 84/100 on livability (#6 in IN, #676 nationally) — a professional / high-income tenant draw. Strengths: amenities A+, commute A+, cost of living A+; Watch: crime C-, employment D+.
- Fort Wayne Community Schools (urban): math 22% / reading 29% proficiency, ranked #263 of 301 in IN (top 87%) — low school quality limits family demand, transient renter base, plan for 1-2y turnover; 60% free/reduced lunch — lower-income household profile, screen leases tightly.
- Zoned schools: Forest Park Elementary School (math 21% / reading 22%, grade F, #803 of 994 statewide, top 81%, 601 students, 75% FRL); Lakeside Middle School (math 8% / reading 17%, grade F, #310 of 330 statewide, top 94%, 502 students, 78% FRL); North Side High School (math 19% / reading 51%, grade F, #266 of 369 statewide, top 73%, 1,474 students, 66% FRL).
- Market conditions: Rents flat; 108 active listings in the ZIP; 17 comparable units currently listed for rent nearby; rentals at typical pace (median 22d on market — plan ~3-4 weeks tenant-placement turnaround); 1,861 units permitted in Allen County in 2024 (576 in 5+ unit buildings).
Forward outlook
- Local home prices are declining (-3.0%/yr); year-one equity from $795 of loan paydown is wiped out by about $3k of value loss. Plan a longer hold.
- Allen County population projected at +10% by 2050 — modest demand growth; plan on rents tracking national, not racing it.
Negotiation context
- It's been on market 48 days — a 3% lower offer ($112k) is reasonable based on typical stale-listing flexibility.
Risks & watch-outs
- Watch-outs: built in 1954 — expect roof / HVAC / electrical / plumbing capex.
Questions for the listing agent
- It's been on market 48 days. Have you received any prior offers? Is the seller open to a 3% concession, seller financing, or rate buy-down credit?
- Built in 1954 — when were the roof, HVAC, electrical panel, plumbing, and water heater last replaced?
- Is there a deadline driving the sale (1031 exchange, divorce, estate, relocation)? That informs how much negotiation room exists.
- Schools are D-rated, which usually means shorter tenancies and higher turnover. Who's the typical renter profile here, and what's been the actual vacancy rate?
- What's the average days-on-market for RENTAL listings here right now (not sales)? A rising rental-DOM trend means longer vacancies and softer asking-rent achievability than the comps imply.
- What's the recent tenant-quality profile in this submarket — average credit score on applications, eviction rate, late-payment / NSF rate, and stable-employment percentage? A property-management company in the area should have these aggregated.
- How much new for-sale + rental construction is in the pipeline within 1–3 miles? Heavy new supply typically softens prices + rents 12–24 months out; constrained supply supports both.
Investment metrics
- 1% rule
- 1.01% ✓
- Cap rate
- 8.62%
- Cash-on-cash
- 8.32%
- DSCR
- 1.37
- GRM
- 8.2
CMA / ARV
- ARV (on-the-fly)
- $144,375
- Comps found
- 12
Show comp detail 12 sales within ~0.75 mi
| Address | Dist | Beds/Ba | Sqft | Sold | Price | $/sf | Match |
|---|---|---|---|---|---|---|---|
| 705 Anderson Ave | 0.21mi | 2/1.0 (-1) | 888 (+2%) | 0mo | $170,000 | $191 | 82 |
| 1615 Hillside Ave | 0.02mi | 3/1.0 | 1,000 (+14%) | 7mo | $136,500 | $137 | 69 |
| 1049 Shore Dr | 0.28mi | 2/1.0 (-1) | 984 (+12%) | 4mo | $110,000 | $112 | 58 |
| 914 Forest Ave | 0.28mi | 2/1.0 (-1) | 970 (+11%) | 9mo | $130,000 | $134 | 56 |
| 1035 Shore Dr | 0.27mi | 2/1.0 (-1) | 797 (-9%) | 14mo | $152,000 | $191 | 56 |
| 1119 Lynn Ave | 0.56mi | 2/1.0 (-1) | 800 (-9%) | 1mo | $171,000 | $214 | 54 |
| 1209 Dodge Ave | 0.63mi | 2/1.0 (-1) | 864 (-1%) | 12mo | $175,000 | $203 | 54 |
| 2201 Parnell Ave | 0.41mi | 2/1.0 (-1) | 800 (-9%) | 10mo | $150,000 | $188 | 53 |
| 613 Stadium Dr | 0.69mi | 2/1.0 (-1) | 932 (+6%) | 8mo | $150,000 | $161 | 46 |
| 521 Stadium Dr | 0.72mi | 2/1.0 (-1) | 937 (+7%) | 6mo | $149,900 | $160 | 45 |
| 717 Charlotte Ave | 0.71mi | 2/1.0 (-1) | 904 (+3%) | 19mo | $103,000 | $114 | 40 |
| 553 Charlotte Ave | 0.74mi | 2/1.0 (-1) | 960 (+10%) | 11mo | $158,000 | $165 | 35 |
Match score weights: distance 35% · size 25% · config 20% · recency 20%. Top-matched comps best support the ARV.
Projected returns pro-forma
-3.0% appreciation · 0.75% rent growth · sell at horizon
- IRR
- -6.0%
- Equity multiple
- 0.78×
- Total profit
- $-7,030
- Equity at exit
- $17,147
- IRR
- 0.9%
- Equity multiple
- 1.06×
- Total profit
- $1,909
- Equity at exit
- $9,943
Cash invested: $32,200 (down + closing). Projections, not guarantees.
Landlord ↔ Tenant lean methodology
- Overall (STATE)
- 90 Strongly Landlord-Friendly
- State Indiana
- 90 Strongly Landlord-Friendly · R+11
- County
- — inherits STATE
- City
- — inherits STATE
ZIP-level market 46805
- Rents YoY
- 0.8%
- Active inventory
- 108
- Price-to-rent
- 8.2×
Monthly cashflow live
- Estimated rent
- $1,165 high interval (Pro) →
- Mortgage (P&I)
- −$603
- Tax from tax record
- −$46 /mo · $550/yr
- Insurance
- −$48
- HOA
- −$0
- Vacancy / Maint / Mgmt
- −$245
- Net cashflow
- $223
Break-even live
Sensitivity live
| Price | -10% $288 | -5% $256 | +0% $223 | +5% $191 | +10% $158 |
|---|---|---|---|---|---|
| Rent | -10% $131 | -5% $177 | +0% $223 | +5% $269 | +10% $315 |
| Rate | -1.0pp $281 | -0.5pp $253 | base $223 | +0.5pp $194 | +1.0pp $163 |
UW: 25.0% down · 7.5% · 30yr · 1.5% tax · 5.0% vac · 8.0% maint · 8.0% mgmt
Financing live
Cash to close
- Down payment
- $28,750
- Closing costs
- $3,450
- Reserves months
- —
- Total cash needed
- —
Loan-product check · same deal, 3 products live
Conventional
25% down · 7.5% · 30yr
- Down + closing
- —
- Monthly P&I
- —
- Monthly cashflow
- —
- DSCR
- —
- Eligible?
- —
Personal DTI + credit; lowest rate.
DSCR
20% down · 8.5% · 30yr
- Down + closing
- —
- Monthly P&I
- —
- Monthly cashflow
- —
- DSCR
- —
- Eligible?
- —
No personal income docs; deal must DSCR.
Hard money
10% down · 12.0% · 12mo
- Down + closing
- —
- Monthly P&I
- —
- Monthly cashflow
- —
- DSCR
- —
- Eligible?
- —
Short-term bridge; refi at stabilization.
Rent comps 17 comps
| Address | Beds | Baths | Sqft | Rent | $/sqft | DOM | Units | Dist |
|---|---|---|---|---|---|---|---|---|
| 2005 Bayer Ave Fort Wayne, IN | 2.0 | 1.0 | 840 | $895 | $1.07 | 44d | 1 | 0.27mi |
| 1838 Kentucky Ave Fort Wayne, IN | 2.0 | 1.0 | 884 | $975 | $1.10 | 44d | 1 | 0.28mi |
| 608 Anderson Ave Unit 1 Fort Wayne, IN | 2.0 | 1.0 | 804 | $875 | $1.09 | 21d | 1 | 0.30mi |
| 1005 Columbia Ave Unit 1005-1 Fort Wayne, IN | 2.0 | 1.0 | 680 | $950 | $1.40 | 14d | 1 | 0.37mi |
| 1206 Columbia Ave Unit 2 Fort Wayne, IN | 2.0 | 2.0 | 1118 | $995 | $0.89 | 44d | 1 | 0.38mi |
| 424 Nussbaum Ave Fort Wayne, IN | 2.0 | 1.0 | 650 | $1,200 | $1.85 | 21d | 1 | 0.45mi |
| 807 Edgewater Ave Fort Wayne, IN | 3.0 | 1.0 | 1075 | $1,450 | $1.35 | 21d | 1 | 0.54mi |
| 805 Edgewater Ave Fort Wayne, IN | 3.0 | 1.0 | 1075 | $1,550 | $1.44 | 14d | 1 | 0.55mi |
| 101 Three Rivers N Fort Wayne, IN | 2.0 | 1.0 | 760 | $2,102 | $2.76 | 21d | 11 | 0.60mi |
| 607 Curdes Ave Fort Wayne, IN | 3.0 | 1.5 | 1072 | $1,450 | $1.35 | 21d | 1 | 0.82mi |
| 344 Dunnwood Dr Unit 1 Fort Wayne, IN | 2.0 | 1.0 | 800 | $695 | $0.87 | 44d | 1 | 0.99mi |
| 112 W Washington Blvd Fort Wayne, IN | 1.0–2.0 | 1.0–2.0 | 768 | $1,500 | $1.95 | 21d | 2 | 1.04mi |
| 706 3rd St Unit 1 Fort Wayne, IN | 2.0 | 1.0 | 930 | $995 | $1.07 | 44d | 1 | 1.22mi |
| 1911 Hazelwood Ave Fort Wayne, IN | 1.0–3.0 | 1.0–2.5 | 910 | $1,375 | $1.51 | 21d | 3 | 1.31mi |
| 1250 Ewing St Fort Wayne, IN | 2.0 | 1.0–2.0 | 980 | $2,081 | $2.12 | 21d | 24 | 1.39mi |
| 1437 Oakland St Fort Wayne, IN | 3.0 | 1.0 | 1000 | $1,250 | $1.25 | 44d | 1 | 1.41mi |
| 835 Van Buren St Fort Wayne, IN | 2.0 | 1.0–2.0 | 750 | $1,995 | $2.66 | 14d | 29 | 1.43mi |
Listing history 2 events
-
2026-04-10historical Active Under Contract
-
2026-04-09$115,000 Active
ⓘ Source: listings_history table (triggers on properties + properties_extension) + one-shot
backfill from property_details.listing_events for pre-trigger history.
Tax reassessment forecast IN · Partial reset (capped growth)
- Current annual tax
- $550 · $46/mo
- Projected year-2 tax
- $764 · $64/mo
- Expected delta
- +$214/yr (+$18/mo · 38.9%)
ⓘ Screening estimate from a state-policy table — verify with the county assessor before closing.
Climate risk First Street
- Flood 3/10 Moderate FEMA zone X · 10% chance over 30 yrs
- Wildfire 1/10 Low
- Heat 3/10 Moderate 7 d/yr ≥100°F today · 17 d/yr by 30 yrs out
- Wind 2/10 Low
- Air quality 3/10 Moderate 2 unhealthy d/yr today · 3 by 30 yrs out
Nearby sold comps map
Loading sold comps map…
Walkable amenities ~0.75 mi
Loading nearby amenities…
Taxation est. · year 1
- Rental income
- $13,977
- − Mortgage interest
- −$6,442
- − Property taxes
- −$550
- − Insurance
- −$575
- − Repairs & maintenance
- −$1,118
- − Management
- −$1,118
- − Depreciation
- −$3,345
- Taxable income
- $829
- Est. tax owed @ 24.0%
- −$199
- After-tax cash flow
- $2,482/yr
For passive investors: Depreciation is non-cash, so a rental often shows a tax loss while cash-flowing — sheltering income. Rental losses are passive: they offset passive income freely, and up to $25,000/yr can offset ordinary (W-2) income if you actively participate and your MAGI is under $100k (phasing out to $0 by $150k); unused losses carry forward. On sale, claimed depreciation is recaptured at up to 25%, and gains may owe capital-gains tax (a 1031 exchange can defer both). Figures are a year-1 estimate at your 24.0% rate — not tax advice; consult a CPA.
Schools (NCES district)
- District
- Fort Wayne Community Schools
- NCES district ID
- 1803630
- Math proficiency
- 22% ▼ -11.00%
- Reading proficiency
- 29% ▼ -7.00%
- Median HH income
- $41,951
- Composite
- 21.68/100
- National rank
- #8275
- State rank
- #263 of 301 in IN
Livability — Fort Wayne
- Score
- 84/100
- State rank
- #6
- US rank
- #676
Category grades
Schools grade is shown separately in the Schools card above.
Census & demographics
- Census place
- Fort Wayne, IN
- County
- Allen County · 326,813 people
- City population
- 326,813
- Metro
- Fort Wayne, IN
- Population (ZIP)
- 21,437
- Household income
- $52,154
- Rent vs Own
- Severe rent burden
- 904.0
Population outlook (Allen County) Hauer SSP2
- Today (2025)
- 394,020 people
- By 2030
- 405,128 · +2.8%
- By 2040
- 423,476 · +7.5%
- By 2050
- 435,137 · +10.4%
- By 2075
- 450,293 · +14.3%
- By 2100
- 424,101 · +7.6%
Race, ethnicity, and origin ACS 2023
- Neighborhood character
- Predominantly White (72%)
- Race & ethnicity
- White 72% Black 9% Two or more races 8% Hispanic / Latino 7% Asian 5%
- Hispanic origin (detail)
- Mexican 4%
- Common ancestry
- Lithuanian 3% Slovak 3% Italian 2%
- Foreign-born
- 6% · Philippines, Canada
- Languages at home
- 91% English-only · Other Asian/Pacific 3% Spanish 3%
Political lean MEDSL · Allen
- 2024 margin
- R (+12.5) · D 42.9% · R 55.4% · Other 1.7%
- 2008→2024 swing
- -8.1pp toward R · 2008: -4.3pp · 2024: -12.5pp
- All cycles
- 2024: R+12.5 2020: R+11.2 2016: R+19.6 2012: R+16.8 2008: R+4.3
Not yet ingested
- Civics
- —
Market trends
- HPI YoY
- ▼ -356.64%
- Current HPI
- 286.2643
- Rent YoY
- ▲ 0.75%
- Metro
- Fort Wayne, IN
- State GDP YoY
- ▲ 2.90%
- F500 in state
- 18
Industry mix (Fortune 500 HQ in IN)
| Industry | F500 HQs | Revenue |
|---|---|---|
| Industrial Machinery | 2 | $37B |
|
||
| Healthcare | 1 | $177B |
|
||
| Pharmaceuticals | 1 | $45B |
|
||
| Metals / Steel | 1 | $18B |
|
||
| Agriculture | 1 | $17B |
|
||
| Packaging | 1 | $12B |
|
||
Price history
2 events — show timeline
- 2026-04-10 Contingent — IRMLS
- 2026-04-09 Listed $115,000 IRMLS
Property tax history
+4.7%/yrLatest (2024): $550 · +27.7% YoY. Source: county tax records.
Cash-flow waterfall
monthlySold comps — $/sqft
last 12 mo · ≤1 miLoading sold comps…