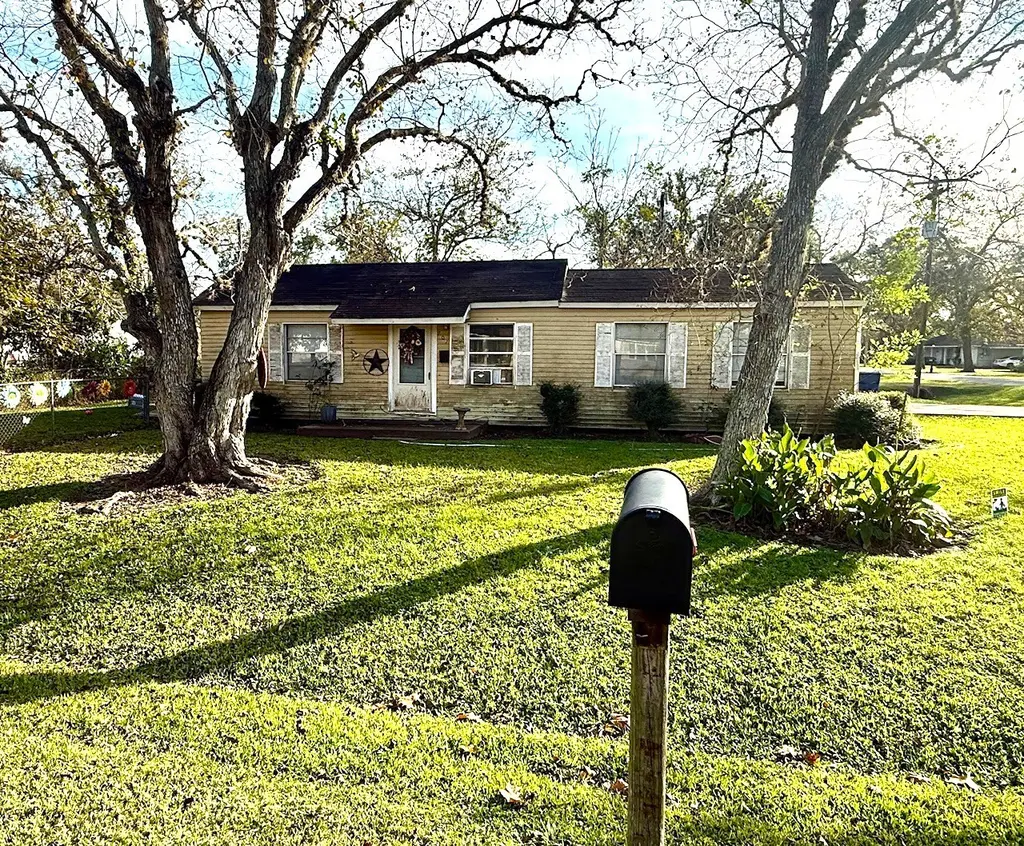
701 E Bernard St · West Columbia, TX
Flood risk 4/10 · Minor
- FEMA flood zone
- X (unshaded)
- Chance of flooding over 30 yrs
- 0.23%
- Est. flood insurance / yr
- $507 – $1,088
Fire risk 4/10 · Minor
- Est. fire insurance / yr
- $1,222 – $2,270
Heat risk 9/10 · Severe
- Hot days now (above 109°F)
- 7 days/yr
- Hot days in 30 yrs
- 24 days/yr
Wind risk 9/10 · Severe
- Chance of severe wind over 30 yrs
- 99.0%
Air-quality risk 2/10 · Minimal
- Unhealthy air days now
- 2 days/yr
- Unhealthy air days in 30 yrs
- 2 days/yr
Risk factors via First Street. Map © Google.
Why this score? — see what drove the D grade
The composite is a weighted blend of 9 inputs, each scored 0–100. Each bar is that input's sub-score; the figure is the points it added to the 100-point composite (weight × sub-score).
- ARV discount +10.7/15.0
- Appreciation +8.8/10.0
- Cash flow +7.4/30.0
- Livability +3.5/5.0
- Schools +3.0/10.0
- Rent growth +2.5/5.0
- Condition / age +2.5/5.0
- 1% rule +2.3/10.0
- DSCR +1.6/10.0
$136,900
🖨 Deal sheet 📄 Offer letter ✓ Due diligence
Listing remarks MLS
Charming 2-bedroom, 1-bath bungalow in the heart of West Columbia. Built in 1945, this home offers classic character and a great opportunity for a remodel or investment project. The interior features an inviting layout with original details and plenty of natural light. Situated on a 10,000 sq ft lot, the property provides room for outdoor enjoyment without excessive upkeep. Conveniently located near local schools, shops, and dining. Home has not been recently updated and is being sold as-is. Perfect for buyers looking to add personal touches or investors seeking a value-add property.
Key facts
- Natural light
- Original details
- Outdoor enjoyment
Tags
Neighborhood map
What this means for you Summary
Snapshot
- This is a 2-bed/1.0-bath single-family listed at $137k.
Deal economics
- At list price, monthly cash flow is $-176 ($-2k/yr) — negative.
- To cash-flow at today's rent, offer at most $106k (22.7% below list).
- To meet the 1% rule (rent ≥ 1% of price), the offer needs to be $100k (26.7% below list).
- Recommended offer: $100k (26.7% below list) — sets the bar for 1% rule.
Location & tenants
- Location reads 70/100 on livability (#375 in TX) — a middle-class / working-renter tenant base. Strengths: cost of living A+, housing A+, health & safety B+; Watch: schools D, amenities F, commute F.
- Columbia-Brazoria ISD (town): math 35% / reading 33% proficiency, ranked #513 of 826 in TX (top 62%) — families likely to look elsewhere, expect single-tenant / working-renter base with shorter leases.
- Market conditions: 145 active listings in the ZIP; 6 comparable units currently listed for rent nearby; rentals lingering (median 44d on market — plan ~5-8 weeks vacancy on turnover, expect pricing pressure); 67% of comp listings sitting > 30 days — soft ceiling on asking rent; 3,960 units permitted in Brazoria County in 2024 (593 in 5+ unit buildings).
Forward outlook
- In year one you build about $11k of equity ($946 loan paydown + $10k appreciation (7.6% local appreciation)).
- Brazoria County population projected at +44% by 2050 — long-run rental-demand tailwind backs the buy-and-hold thesis.
- By year 4, paydown + projected appreciation supports a ~$39k cash-out refi (75% LTV) — recoverable capital for the next deal without selling this one.
Negotiation context
- It's been on market 178 days — a 12% lower offer ($120k) is reasonable based on typical stale-listing flexibility.
- 2 sale attempts; this cycle's ask has dropped $18k (12%) from the opening price — seller is motivated, your offer sets the floor, not the list.
Risks & watch-outs
- Watch-outs: built in 1945 — expect roof / HVAC / electrical / plumbing capex.
- Climate carrying-cost: severe wind risk, 99% chance of damaging wind over 30y; extreme-heat days projected 7→24/yr by 2055 (HVAC capex compounding) — expect insurance premiums to compound above CPI over the hold.
Questions for the listing agent
- What do current leases actually rent for vs. the listed asking? Can we see a recent rent roll and the last 12 months of T-12 income?
- It's been on market 178 days. Have you received any prior offers? Is the seller open to a 27% concession, seller financing, or rate buy-down credit?
- Built in 1945 — when were the roof, HVAC, electrical panel, plumbing, and water heater last replaced?
- Why hasn't it sold? Are there any deal-killer items the seller is aware of (foundation, flood, title, zoning, code violations)?
- Is there a deadline driving the sale (1031 exchange, divorce, estate, relocation)? That informs how much negotiation room exists.
- Schools are D-rated, which usually means shorter tenancies and higher turnover. Who's the typical renter profile here, and what's been the actual vacancy rate?
- The area grade is low — what's the realistic commute time and amenity access for the typical tenant pool here? Any planned neighborhood developments (good or bad) we should know about?
- What's the average days-on-market for RENTAL listings here right now (not sales)? A rising rental-DOM trend means longer vacancies and softer asking-rent achievability than the comps imply.
- What's the recent tenant-quality profile in this submarket — average credit score on applications, eviction rate, late-payment / NSF rate, and stable-employment percentage? A property-management company in the area should have these aggregated.
- How much new for-sale + rental construction is in the pipeline within 1–3 miles? Heavy new supply typically softens prices + rents 12–24 months out; constrained supply supports both.
Investment metrics
- 1% rule
- 0.73% ✗
- Cap rate
- 4.75%
- Cash-on-cash
- -5.50%
- DSCR
- 0.76
- GRM
- 11.4
CMA / ARV
- ARV (median comp)
- $147,378
- List price
- $136,900
- Delta
- -7.11%
- Verdict
- FAIR
- Comps
- 20 within 1.0 mi
Show comp detail 3 sales within ~0.75 mi
| Address | Dist | Beds/Ba | Sqft | Sold | Price | $/sf | Match |
|---|---|---|---|---|---|---|---|
| 626 S Gray Ave | 0.52mi | 2/1.0 | 884 (-4%) | 6mo | $156,000 | $176 | 65 |
| 606 S Gray Ave | 0.50mi | 3/1.0 (+1) | 921 (+0%) | 12mo | $169,000 | $183 | 61 |
| 109 S Ringgold St | 0.18mi | 3/2.0 (+1) | 1,043 (+14%) | 16mo | $229,000 | $220 | 46 |
Match score weights: distance 35% · size 25% · config 20% · recency 20%. Top-matched comps best support the ARV.
Projected returns pro-forma
7.63% appreciation · 3.0% rent growth · sell at horizon
- IRR
- 15.0%
- Equity multiple
- 2.10×
- Total profit
- $42,003
- Equity at exit
- $100,570
- IRR
- 14.8%
- Equity multiple
- 4.40×
- Total profit
- $130,198
- Equity at exit
- $196,440
Cash invested: $38,332 (down + closing). Projections, not guarantees.
Landlord ↔ Tenant lean methodology
- Overall (STATE)
- 87 Strongly Landlord-Friendly
- State Texas
- 87 Strongly Landlord-Friendly · R+5
- County
- — inherits STATE
- City
- — inherits STATE
ZIP-level market 77486
- Home prices YoY
- 2.4%
- Active inventory
- 145
- Price-to-rent
- 11.4×
Monthly cashflow live
- Estimated rent
- $1,004 high interval (Pro) →
- Mortgage (P&I)
- −$718
- Tax from tax record
- −$194 /mo · $2,327/yr
- Insurance
- −$57
- HOA
- −$0
- Vacancy / Maint / Mgmt
- −$211
- Net cashflow
- $-176
Break-even live
UW: 25.0% down · 7.5% · 30yr · 1.5% tax · 5.0% vac · 8.0% maint · 8.0% mgmt
Financing live
Cash to close
- Down payment
- $34,225
- Closing costs
- $4,107
- Reserves months
- —
- Total cash needed
- —
Loan-product check · same deal, 3 products live
Conventional
25% down · 7.5% · 30yr
- Down + closing
- —
- Monthly P&I
- —
- Monthly cashflow
- —
- DSCR
- —
- Eligible?
- —
Personal DTI + credit; lowest rate.
DSCR
20% down · 8.5% · 30yr
- Down + closing
- —
- Monthly P&I
- —
- Monthly cashflow
- —
- DSCR
- —
- Eligible?
- —
No personal income docs; deal must DSCR.
Hard money
10% down · 12.0% · 12mo
- Down + closing
- —
- Monthly P&I
- —
- Monthly cashflow
- —
- DSCR
- —
- Eligible?
- —
Short-term bridge; refi at stabilization.
Rent comps 6 comps
| Address | Beds | Baths | Sqft | Rent | $/sqft | DOM | Units | Dist |
|---|---|---|---|---|---|---|---|---|
| 225 S 13th St West Columbia, TX | 1.0 | 1.0 | 700 | $765 | $1.09 | 43d | 1 | 0.11mi |
| 136 Ellis Ln Unit C West Columbia, TX | 2.0 | 2.0 | 900 | $1,350 | $1.50 | 11d | 1 | 0.78mi |
| 136 Ellis Ln Unit C West Columbia, TX | 2.0 | 2.0 | 900 | $1,350 | $1.50 | 7d | 1 | 0.78mi |
| 1106 S Columbia Dr Apt B West Columbia, TX | 2.0 | 2.0 | 1000 | $1,350 | $1.35 | 43d | 1 | 0.94mi |
| 1106 S Columbia Dr West Columbia, TX | 2.0 | 2.0 | 1000 | $1,250 | $1.25 | 43d | 1 | 0.94mi |
| 1224 County Road 449 West Columbia, TX | 2.0 | 1.0 | 850 | $1,250 | $1.47 | 43d | 1 | 1.41mi |
Listing history 11 events
-
2026-06-01days on market $136,900 Active 178 DOM
-
2026-05-31days on market $136,900 Active 177 DOM
-
2026-04-27price $136,900 590-char remark
Show marketing remark (590 chars)
Charming 2-bedroom, 1-bath bungalow in the heart of West Columbia. Built in 1945, this home offers classic character and a great opportunity for a remodel or investment project. The interior features an inviting layout with original details and plenty of natural light. Situated on a 10,000 sq ft lot, the property provides room for outdoor enjoyment without excessive upkeep. Conveniently located near local schools, shops, and dining. Home has not been recently updated and is being sold as-is. Perfect for buyers looking to add personal touches or investors seeking a value-add property.
-
2025-12-05$154,900 Active 590-char remark
Show marketing remark (590 chars)
Charming 2-bedroom, 1-bath bungalow in the heart of West Columbia. Built in 1945, this home offers classic character and a great opportunity for a remodel or investment project. The interior features an inviting layout with original details and plenty of natural light. Situated on a 10,000 sq ft lot, the property provides room for outdoor enjoyment without excessive upkeep. Conveniently located near local schools, shops, and dining. Home has not been recently updated and is being sold as-is. Perfect for buyers looking to add personal touches or investors seeking a value-add property.
-
2025-12-05$154,900
Show marketing remark (590 chars)
Charming 2-bedroom, 1-bath bungalow in the heart of West Columbia. Built in 1945, this home offers classic character and a great opportunity for a remodel or investment project. The interior features an inviting layout with original details and plenty of natural light. Situated on a 10,000 sq ft lot, the property provides room for outdoor enjoyment without excessive upkeep. Conveniently located near local schools, shops, and dining. Home has not been recently updated and is being sold as-is. Perfect for buyers looking to add personal touches or investors seeking a value-add property.
-
2025-12-05historical
Show marketing remark (590 chars)
Charming 2-bedroom, 1-bath bungalow in the heart of West Columbia. Built in 1945, this home offers classic character and a great opportunity for a remodel or investment project. The interior features an inviting layout with original details and plenty of natural light. Situated on a 10,000 sq ft lot, the property provides room for outdoor enjoyment without excessive upkeep. Conveniently located near local schools, shops, and dining. Home has not been recently updated and is being sold as-is. Perfect for buyers looking to add personal touches or investors seeking a value-add property.
-
2022-08-30soldstatus
-
2020-01-28soldstatus
-
2005-05-20soldstatus
-
2004-09-22soldstatus
-
2003-12-18soldstatus
ⓘ Source: listings_history table (triggers on properties + properties_extension) + one-shot
backfill from property_details.listing_events for pre-trigger history.
Tax reassessment forecast TX · Resets to sale price
- Current annual tax
- $2,327 · $194/mo
- Projected year-2 tax
- $2,505 · $209/mo
- Expected delta
- +$178/yr (+$15/mo · 7.7%)
ⓘ Screening estimate from a state-policy table — verify with the county assessor before closing.
Climate risk First Street
- Flood 4/10 Moderate FEMA zone X (unshaded) · 23% chance over 30 yrs
- Wildfire 4/10 Moderate
- Heat 9/10 Extreme 7 d/yr ≥109°F today · 24 d/yr by 30 yrs out
- Wind 9/10 Extreme 99% chance of damaging wind over 30 yrs
- Air quality 2/10 Low 2 unhealthy d/yr today · 2 by 30 yrs out
Nearby sold comps map
Loading sold comps map…
Walkable amenities ~0.75 mi
Loading nearby amenities…
Taxation est. · year 1
- Rental income
- $12,048
- − Mortgage interest
- −$7,669
- − Property taxes
- −$2,327
- − Insurance
- −$684
- − Repairs & maintenance
- −$964
- − Management
- −$964
- − Depreciation
- −$3,983
- Taxable loss
- −$4,542
- Est. tax savings @ 24.0%
- +$1,090
- After-tax cash flow
- $-1,018/yr
For passive investors: Depreciation is non-cash, so a rental often shows a tax loss while cash-flowing — sheltering income. Rental losses are passive: they offset passive income freely, and up to $25,000/yr can offset ordinary (W-2) income if you actively participate and your MAGI is under $100k (phasing out to $0 by $150k); unused losses carry forward. On sale, claimed depreciation is recaptured at up to 25%, and gains may owe capital-gains tax (a 1031 exchange can defer both). Figures are a year-1 estimate at your 24.0% rate — not tax advice; consult a CPA.
Schools (NCES district)
- District
- Columbia-Brazoria ISD
- NCES district ID
- 4814670
- Math proficiency
- 35% ▼ -4.00%
- Reading proficiency
- 33% ▼ -1.00%
- Median HH income
- $57,256
- Composite
- 30.23/100
- National rank
- #6297
- State rank
- #513 of 826 in TX
Livability — West Columbia
- Score
- 70/100
- State rank
- #375
- US rank
- #7954
Category grades
Schools grade is shown separately in the Schools card above.
Census & demographics
- Census place
- West Columbia, TX
- Population (ZIP)
- 7,330
Population outlook (Brazoria County) Hauer SSP2
- Today (2025)
- 420,414 people
- By 2030
- 457,585 · +8.8%
- By 2040
- 532,232 · +26.6%
- By 2050
- 605,399 · +44.0%
- By 2075
- 779,358 · +85.4%
- By 2100
- 883,759 · +110.2%
Race, ethnicity, and origin ACS 2023
- Neighborhood character
- Majority White (61%)
- Race & ethnicity
- White 61% Hispanic / Latino 27% Two or more races 13% Black 10% Native American 1%
- Hispanic origin (detail)
- Mexican 23%
- Common ancestry
- Italian 5% Slovak 3% Lithuanian 2%
- Foreign-born
- 5% · Canada
- Languages at home
- 86% English-only · Spanish 12% German/W. Germanic 1%
Political lean MEDSL · Brazoria
- 2024 margin
- R (+19.7) · D 39.5% · R 59.2% · Other 1.3%
- 2008→2024 swing
- +9.9pp toward D · 2008: -29.6pp · 2024: -19.7pp
- All cycles
- 2024: R+19.7 2020: R+18.2 2016: R+24.6 2012: R+34.2 2008: R+29.6
Not yet ingested
- Civics
- —
Market trends
- HPI YoY
- ▲ 7.63%
- Current HPI
- 320.7967
- Rent YoY
- —
- Metro
- —
- State GDP YoY
- ▲ 3.95%
- F500 in state
- 110
Industry mix (Fortune 500 HQ in TX)
| Industry | F500 HQs | Revenue |
|---|---|---|
| Energy | 16 | $1,198B |
|
||
| Technology | 5 | $198B |
|
||
| Engineering / Construction | 4 | $72B |
|
||
| Energy Services | 3 | $60B |
|
||
| Utilities | 3 | $41B |
|
||
| Healthcare | 2 | $330B |
|
||
Price history
-11.6% since first listed9 events — show timeline
- 2026-04-27 Price Changed $136,900 HARMLS
- 2025-12-05 Listing Removed — HARMLS
- 2025-12-05 Listed $154,900 HARMLS
- 2025-12-05 Listed $154,900 HARMLS
- 2022-08-30 Sold (Public Records) — Public Records
- 2020-01-28 Sold (Public Records) — Public Records
- 2005-05-20 Sold (Public Records) — Public Records
- 2004-09-22 Sold (Public Records) — Public Records
- 2003-12-18 Sold (Public Records) — Public Records
Property tax history
+2.8%/yrLatest (2025): $2,327 · -9.3% YoY. Source: county tax records.
Cash-flow waterfall
monthlySold comps — $/sqft
last 12 mo · ≤1 miLoading sold comps…