 🏗️ New Construction
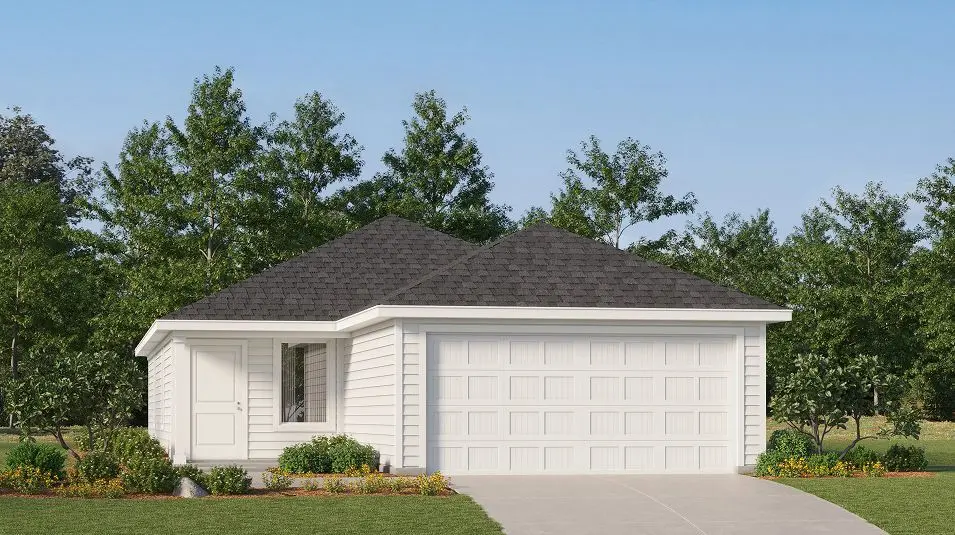
Oakridge Plan · San Antonio, TX
Flood risk 1/10 · Minimal
- FEMA flood zone
- X (unshaded)
- Chance of flooding over 30 yrs
- 0.0%
- Est. flood insurance / yr
- $507 – $1,088
Fire risk 3/10 · Minor
- Est. fire insurance / yr
- $1,222 – $2,270
Heat risk 8/10 · Major
- Hot days now (above 108°F)
- 7 days/yr
- Hot days in 30 yrs
- 22 days/yr
Wind risk 8/10 · Major
- Chance of severe wind over 30 yrs
- 80.0%
Air-quality risk 2/10 · Minimal
- Unhealthy air days now
- 0 days/yr
- Unhealthy air days in 30 yrs
- 2 days/yr
Risk factors via First Street. Map © Google.
Why this score? — see what drove the D- grade
The composite is a weighted blend of 9 inputs, each scored 0–100. Each bar is that input's sub-score; the figure is the points it added to the 100-point composite (weight × sub-score).
- ARV discount +7.5/15.0
- Appreciation +6.4/10.0
- Cash flow +6.0/30.0
- Rent growth +4.4/5.0
- Livability +4.0/5.0
- Condition / age +4.0/5.0
- Schools +1.4/10.0
- 1% rule +1.3/10.0
- DSCR +0.3/10.0
$202,499
🖨 Deal sheet (PDF) 📄 Offer letter ✓ Due diligence
Listing remarks MLS
This single-level home showcases a spacious open floorplan shared between the kitchen, dining area and family room for easy entertaining during gatherings. An owner's suite enjoys a private location in a rear corner of the home, complemented by an en-suite bathroom and walk-in closet. There are two secondary bedrooms along the side of the home, which are ideal for household members and hosting overnight guests.
Key facts
- Walk-in closet
- Open floorplan
- Secondary bedrooms
Tags
Neighborhood map
What this means for you Summary
Snapshot
- This is a 3-bed/2.0-bath single-family listed at $202k. Condition is rated good.
Deal economics
- At list price, monthly cash flow is $-514 ($-6k/yr) — negative.
- To cash-flow at today's rent, offer at most $193k (4.5% below list).
- To meet the 1% rule (rent ≥ 1% of price), the offer needs to be $169k (16.5% below list).
- Recommended offer: $169k (16.5% below list) — sets the bar for 1% rule.
Location & tenants
- Location reads 80/100 on livability (#31 in TX, #1,616 nationally) — a professional / high-income tenant draw. Strengths: amenities A+, commute A+, cost of living A+; Watch: crime F.
- San Antonio ISD (urban): math 12% / reading 22% proficiency, ranked #805 of 826 in TX (top 98%) — low school quality limits family demand, transient renter base, plan for 1-2y turnover; 80% free/reduced lunch — lower-income household profile, screen leases tightly.
- Zoned schools: Hirsch El (math 10% / reading 16%, grade F, #4,152 of 4,322 statewide, top 96%, 533 students, 95% FRL); Davis Middle (math 5% / reading 15%, grade F, #1,641 of 1,662 statewide, top 99%, 545 students, 96% FRL, charter); Houston H S (math 12% / reading 18%, grade F, #1,507 of 1,632 statewide, top 93%, 856 students, 95% FRL) — zoned schools average 95% FRL vs 80% district-wide (16 pts higher); higher-poverty schools than district average — tighter screening recommended.
- Market conditions: Rents rising fast (+7.7%/yr); 70 active listings in the ZIP; 33 comparable units currently listed for rent nearby; rentals at typical pace (median 24d on market — plan ~3-4 weeks tenant-placement turnaround); 8,308 units permitted in Bexar County in 2024 (2,506 in 5+ unit buildings).
- This rent runs 39% of the median local income ($52k/yr) — at the standard rent-burdened threshold; future hikes will face affordability resistance.
Forward outlook
- In year one you build about $9k of equity ($2k loan paydown + $7k appreciation (2.7% local appreciation)).
- Bexar County population projected at +50% by 2050 — long-run rental-demand tailwind backs the buy-and-hold thesis.
- By year 4, paydown + projected appreciation supports a ~$31k cash-out refi (75% LTV) — recoverable capital for the next deal without selling this one.
Negotiation context
- It's been on market 415 days — a 12% lower offer ($178k) is reasonable based on typical stale-listing flexibility.
Risks & watch-outs
- Climate carrying-cost: severe wind risk, 80% chance of damaging wind over 30y; extreme-heat days projected 7→22/yr by 2055 (HVAC capex compounding) — expect insurance premiums to compound above CPI over the hold.
Questions for the listing agent
- What do current leases actually rent for vs. the listed asking? Can we see a recent rent roll and the last 12 months of T-12 income?
- It's been on market 415 days. Have you received any prior offers? Is the seller open to a 17% concession, seller financing, or rate buy-down credit?
- Why hasn't it sold? Are there any deal-killer items the seller is aware of (foundation, flood, title, zoning, code violations)?
- Is there a deadline driving the sale (1031 exchange, divorce, estate, relocation)? That informs how much negotiation room exists.
- Crime grade is F in this area — have there been break-ins, vandalism, or insurance claims at this property in the last 3 years? What carrier currently insures it and at what premium?
- The area grade is low — what's the realistic commute time and amenity access for the typical tenant pool here? Any planned neighborhood developments (good or bad) we should know about?
- What's the average days-on-market for RENTAL listings here right now (not sales)? A rising rental-DOM trend means longer vacancies and softer asking-rent achievability than the comps imply.
- What's the recent tenant-quality profile in this submarket — average credit score on applications, eviction rate, late-payment / NSF rate, and stable-employment percentage? A property-management company in the area should have these aggregated.
- How much new for-sale + rental construction is in the pipeline within 1–3 miles? Heavy new supply typically softens prices + rents 12–24 months out; constrained supply supports both.
Investment metrics
- 1% rule
- 0.63% ✗
- Cap rate
- 3.99%
- Cash-on-cash
- -8.23%
- DSCR
- 0.63
- GRM
- 13.2
CMA / ARV
- ARV (median comp)
- $267,683
- List price
- $202,499
- Delta
- -24.35%
- Verdict
- UNDERPRICED
- Comps
- 20 within 1.0 mi
Show comp detail 12 sales within ~0.75 mi
| Address | Dist | Beds/Ba | Sqft | Sold | Price | $/sf | Match |
|---|---|---|---|---|---|---|---|
| 414 River Run Way | 0.42mi | 3/2.0 | 1,266 (0%) | 1mo | $194,999 | $154 | 80 |
| 526 Ambush Rdg | 0.38mi | 3/2.0 | 1,276 (+1%) | 2mo | $209,000 | $164 | 79 |
| 523 River Run Way | 0.29mi | 3/2.0 | 1,402 (+11%) | 4mo | $211,999 | $151 | 65 |
| 458 River Run Way | 0.37mi | 3/2.0 | 1,402 (+11%) | 2mo | $200,999 | $143 | 63 |
| 442 River Run Way | 0.40mi | 3/2.0 | 1,402 (+11%) | 2mo | $209,999 | $150 | 62 |
| 443 River Run Way | 0.42mi | 3/2.0 | 1,402 (+11%) | 1mo | $211,999 | $151 | 62 |
| 410 River Run Way | 0.42mi | 3/2.0 | 1,402 (+11%) | 1mo | $209,999 | $150 | 62 |
| 430 River Run Way | 0.41mi | 3/2.0 | 1,128 (-11%) | 1mo | $230,999 | $205 | 62 |
| 503 River Run Way | 0.39mi | 3/2.0 | 1,402 (+11%) | 4mo | $198,999 | $142 | 61 |
| 402 River Run Way | 0.43mi | 3/2.0 | 1,411 (+12%) | 1mo | $214,999 | $152 | 60 |
| 427 Filibusters Trl | 0.37mi | 2/2.0 (-1) | 1,450 (+14%) | 5mo | $189,900 | $131 | 49 |
| 202 Reuben Kemper | 0.64mi | 3/2.0 | 1,450 (+14%) | 2mo | $200,000 | $138 | 45 |
Match score weights: distance 35% · size 25% · config 20% · recency 20%. Top-matched comps best support the ARV.
Projected returns pro-forma
2.73% appreciation · 7.72% rent growth · sell at horizon
- IRR
- 1.0%
- Equity multiple
- 1.05×
- Total profit
- $4,122
- Equity at exit
- $116,301
- IRR
- 6.8%
- Equity multiple
- 2.08×
- Total profit
- $80,877
- Equity at exit
- $176,138
Cash invested: $74,951 (down + closing). Projections, not guarantees.
Landlord ↔ Tenant lean methodology
- Overall (STATE)
- 87 Strongly Landlord-Friendly
- State Texas
- 87 Strongly Landlord-Friendly · R+5
- County
- — inherits STATE
- City
- — inherits STATE
ZIP-level market 78219
- Home prices YoY
- 0.8%
- Rents YoY
- 7.7%
- Active inventory
- 70
- Price-to-rent
- 10.0×
Monthly cashflow live
- Estimated rent
- $1,691 high interval (Pro) →
- Mortgage (P&I)
- −$1,404
- Tax est. 1.5%
- −$335 /mo · $4,015/yr
- Insurance
- −$112
- HOA
- −$0
- Vacancy / Maint / Mgmt
- −$355
- Net cashflow
- $-514
Break-even live
Sensitivity live
| Price | -10% $-329 | -5% $-422 | +0% $-514 | +5% $-607 | +10% $-699 |
|---|---|---|---|---|---|
| Rent | -10% $-648 | -5% $-581 | +0% $-514 | +5% $-447 | +10% $-381 |
| Rate | -1.0pp $-379 | -0.5pp $-446 | base $-514 | +0.5pp $-583 | +1.0pp $-654 |
UW: 25.0% down · 7.5% · 30yr · 1.5% tax · 5.0% vac · 8.0% maint · 8.0% mgmt
Financing live
Cash to close
- Down payment
- $66,921
- Closing costs
- $8,030
- Reserves months
- —
- Total cash needed
- —
Loan-product check · same deal, 3 products live
Conventional
25% down · 7.5% · 30yr
- Down + closing
- —
- Monthly P&I
- —
- Monthly cashflow
- —
- DSCR
- —
- Eligible?
- —
Personal DTI + credit; lowest rate.
DSCR
20% down · 8.5% · 30yr
- Down + closing
- —
- Monthly P&I
- —
- Monthly cashflow
- —
- DSCR
- —
- Eligible?
- —
No personal income docs; deal must DSCR.
Hard money
10% down · 12.0% · 12mo
- Down + closing
- —
- Monthly P&I
- —
- Monthly cashflow
- —
- DSCR
- —
- Eligible?
- —
Short-term bridge; refi at stabilization.
Rent comps 33 comps
| Address | Beds | Baths | Sqft | Rent | $/sqft | DOM | Units | Dist |
|---|---|---|---|---|---|---|---|---|
| 6334 Willow Point Blvd San Antonio, TX | 3.0 | 2.0 | 1497 | $1,797 | $1.20 | 26d | 1 | 0.02mi |
| 627 Retama Pass San Antonio, TX | 4.0 | 2.5 | 1776 | $1,900 | $1.07 | 26d | 1 | 0.10mi |
| 6110 Willow Point Blvd San Antonio, TX | 3.0 | 2.5 | 1833 | $1,795 | $0.98 | 22d | 1 | 0.15mi |
| 6110 Willow Point Blvd San Antonio, TX | 3.0 | 2.5 | 1833 | $1,795 | $0.98 | 13d | 1 | 0.15mi |
| 6110 Willow Point Blvd Unit NA San Antonio, TX | 3.0 | 2.5 | 1850 | $1,750 | $0.95 | 26d | 1 | 0.15mi |
| 603 Wild Olive Way San Antonio, TX | 3.0 | 2.0 | 1207 | $1,600 | $1.33 | 26d | 1 | 0.17mi |
| 550 Retama Pass San Antonio, TX | 3.0 | 2.0 | 1207 | $1,750 | $1.45 | 6d | 1 | 0.19mi |
| 535 Wild Olive Way San Antonio, TX | 3.0 | 2.0 | 1570 | $1,550 | $0.99 | 6d | 1 | 0.20mi |
| 6102 Walnut Way San Antonio, TX | 4.0 | 2.5 | 1611 | $1,750 | $1.09 | 46d | 1 | 0.20mi |
| 518 Wild Olive Way San Antonio, TX | 2.0 | 2.0 | 1472 | $1,550 | $1.05 | 24d | 1 | 0.22mi |
| 414 Retama Pass San Antonio, TX | 3.0 | 2.5 | 1836 | $1,800 | $0.98 | 26d | 1 | 0.28mi |
| 6427 Kemper Pl San Antonio, TX | 3.0 | 2.0 | 1266 | $1,700 | $1.34 | 20d | 1 | 0.32mi |
| 6406 Kemper Pl San Antonio, TX | 3.0 | 2.0 | 1450 | $1,499 | $1.03 | 17d | 1 | 0.33mi |
| 462 River Run Way San Antonio, TX | 3.0 | 2.0 | 1411 | $1,555 | $1.10 | 26d | 1 | 0.36mi |
| 463 River Run Way San Antonio, TX | 4.0 | 2.0 | 1600 | $1,545 | $0.97 | 24d | 1 | 0.39mi |
| 422 De Herrera San Antonio, TX | 3.0 | 2.0 | 1450 | $1,625 | $1.12 | 46d | 1 | 0.40mi |
| 422 De Herrera San Antonio, TX | 3.0 | 2.0 | 1450 | $1,595 | $1.10 | 26d | 1 | 0.41mi |
| 6422 Magee Run San Antonio, TX | 3.0 | 2.0 | 1450 | $1,550 | $1.07 | 4d | 1 | 0.43mi |
| 6422 Magee Run San Antonio, TX | 3.0 | 2.0 | 1450 | $1,690 | $1.17 | 26d | 1 | 0.43mi |
| 6422 Magee Run San Antonio, TX | 3.0 | 2.0 | 1450 | $1,690 | $1.17 | 20d | 1 | 0.43mi |
| 6410 Magee Run San Antonio, TX | 3.0 | 2.0 | 1450 | $1,715 | $1.18 | 13d | 1 | 0.43mi |
| 242 Ambush Rdg San Antonio, TX | 3.0 | 2.0 | 1276 | $1,495 | $1.17 | 26d | 1 | 0.49mi |
| 134 Samuel Kemper San Antonio, TX | 3.0 | 2.0 | 1450 | $1,550 | $1.07 | 14d | 1 | 0.64mi |
| 127 Expedition Way San Antonio, TX | 2.0 | 1.0 | 950 | $1,400 | $1.47 | 26d | 1 | 0.65mi |
| 115 Katy Post San Antonio, TX | 4.0 | 2.5 | 1725 | $1,995 | $1.16 | 26d | 1 | 0.68mi |
| 5847 Tree View St San Antonio, TX | 3.0 | 2.0 | 1362 | $1,900 | $1.40 | 20d | 1 | 1.12mi |
| 6510 Poseidon Way Converse, TX | 3.0 | 2.0 | 1408 | $1,539 | $1.09 | 5d | 1 | 1.25mi |
| 2414 Indian Frst San Antonio, TX | 3.0 | 2.0 | 1604 | $1,495 | $0.93 | 22d | 1 | 1.33mi |
| 2414 Indian Frst San Antonio, TX | 3.0 | 2.0 | 1604 | $1,495 | $0.93 | 26d | 1 | 1.33mi |
| 2631 Sunset Bnd San Antonio, TX | 3.0 | 2.0 | 1355 | $1,650 | $1.22 | 26d | 1 | 1.35mi |
| 6503 Davenport Bay Converse, TX | 3.0 | 2.0 | 1494 | $1,786 | $1.20 | 0d | 1 | 1.37mi |
| 2409 Key Hole Vw Converse, TX | 3.0 | 2.0 | 1602 | $1,600 | $1.00 | 14d | 1 | 1.42mi |
| 6615 Port Elizabeth Converse, TX | 3.0 | 2.0 | 1596 | $1,489 | $0.93 | 6d | 1 | 1.45mi |
Listing history 21 events
-
2026-06-21days on market $202,499 Active 415 DOM
-
2026-06-18days on market $202,499 Active 412 DOM
-
2026-06-18price $202,499 Active 411 DOM
-
2026-06-17days on market $201,999 Active 411 DOM
-
2026-06-16pricedays on market $201,999 Active 410 DOM
-
2026-06-15days on market $201,499 Active 409 DOM
-
2026-06-13days on market $201,499 Active 407 DOM
-
2026-06-10price $201,499 Active 403 DOM
-
2026-06-09days on market $200,999 Active 403 DOM
-
2026-06-08days on market $200,999 Active 402 DOM
-
2026-06-07days on market $200,999 Active 401 DOM
-
2026-06-04days on market $200,999 Active 398 DOM
-
2026-06-03days on market $200,999 Active 397 DOM
-
2026-06-02days on market $200,999 Active 396 DOM
-
2026-06-01days on market $200,999 Active 395 DOM
-
2026-05-31days on market $200,999 Active 394 DOM
-
2026-05-10price $200,499 414-char remark
Show marketing remark (414 chars)
This single-level home showcases a spacious open floorplan shared between the kitchen, dining area and family room for easy entertaining during gatherings. An owner's suite enjoys a private location in a rear corner of the home, complemented by an en-suite bathroom and walk-in closet. There are two secondary bedrooms along the side of the home, which are ideal for household members and hosting overnight guests.
-
2025-09-01price $199,999 414-char remark
Show marketing remark (414 chars)
This single-level home showcases a spacious open floorplan shared between the kitchen, dining area and family room for easy entertaining during gatherings. An owner's suite enjoys a private location in a rear corner of the home, complemented by an en-suite bathroom and walk-in closet. There are two secondary bedrooms along the side of the home, which are ideal for household members and hosting overnight guests.
-
2025-07-17price $209,999 414-char remark
Show marketing remark (414 chars)
This single-level home showcases a spacious open floorplan shared between the kitchen, dining area and family room for easy entertaining during gatherings. An owner's suite enjoys a private location in a rear corner of the home, complemented by an en-suite bathroom and walk-in closet. There are two secondary bedrooms along the side of the home, which are ideal for household members and hosting overnight guests.
-
2025-05-06price $229,999 414-char remark
Show marketing remark (414 chars)
This single-level home showcases a spacious open floorplan shared between the kitchen, dining area and family room for easy entertaining during gatherings. An owner's suite enjoys a private location in a rear corner of the home, complemented by an en-suite bathroom and walk-in closet. There are two secondary bedrooms along the side of the home, which are ideal for household members and hosting overnight guests.
-
2025-05-03$249,999 Active 414-char remark
Show marketing remark (414 chars)
This single-level home showcases a spacious open floorplan shared between the kitchen, dining area and family room for easy entertaining during gatherings. An owner's suite enjoys a private location in a rear corner of the home, complemented by an en-suite bathroom and walk-in closet. There are two secondary bedrooms along the side of the home, which are ideal for household members and hosting overnight guests.
ⓘ Source: listings_history table (triggers on properties + properties_extension) + one-shot
backfill from property_details.listing_events for pre-trigger history.
Climate risk First Street
- Flood 1/10 Low FEMA zone X (unshaded) · 0% chance over 30 yrs
- Wildfire 3/10 Moderate
- Heat 8/10 Severe 7 d/yr ≥108°F today · 22 d/yr by 30 yrs out
- Wind 8/10 Severe 80% chance of damaging wind over 30 yrs
- Air quality 2/10 Low 0 unhealthy d/yr today · 2 by 30 yrs out
Nearby sold comps map
Loading sold comps map…
Walkable amenities ~0.75 mi
Loading nearby amenities…
Taxation est. · year 1
- Rental income
- $20,290
- − Mortgage interest
- −$14,994
- − Property taxes
- −$4,015
- − Insurance
- −$1,338
- − Repairs & maintenance
- −$1,623
- − Management
- −$1,623
- − Depreciation
- −$7,787
- Taxable loss
- −$11,091
- Est. tax savings @ 24.0%
- +$2,662
- After-tax cash flow
- $-3,508/yr
For passive investors: Depreciation is non-cash, so a rental often shows a tax loss while cash-flowing — sheltering income. Rental losses are passive: they offset passive income freely, and up to $25,000/yr can offset ordinary (W-2) income if you actively participate and your MAGI is under $100k (phasing out to $0 by $150k); unused losses carry forward. On sale, claimed depreciation is recaptured at up to 25%, and gains may owe capital-gains tax (a 1031 exchange can defer both). Figures are a year-1 estimate at your 24.0% rate — not tax advice; consult a CPA.
Condition & rehab AI · 1 photo
This single-family home is in good condition with a good exterior and interior. It has a good potential for value increase with some cosmetic updates.
Value-add opportunities
- Both Painting the exterior — Fresh paint can enhance curb appeal and value
- Both Landscaping the front yard — Well-maintained landscaping can improve curb appeal and attract potential buyers
Renovation cost estimate screening
Value-add ROI direction
- Both Painting the exterior — Fresh paint can enhance curb appeal and value ↑
- Both Landscaping the front yard — Well-maintained landscaping can improve curb appeal and attract potential buyers ↑
ⓘ Cost ranges are severity-bucket heuristics (US national rule-of-thumb). Get contractor quotes + a written scope before underwriting a rehab budget.
Schools (NCES district)
- District
- San Antonio ISD
- NCES district ID
- 4838730
- Math proficiency
- 12% ▼ -21.00%
- Reading proficiency
- 22% ▼ -7.00%
- Median HH income
- $30,952
- Composite
- 13.57/100
- National rank
- #9512
- State rank
- #805 of 826 in TX
Livability — San Antonio
- Score
- 80/100
- State rank
- #31
- US rank
- #1616
Category grades
Schools grade is shown separately in the Schools card above.
Census & demographics
- Census place
- San Antonio, TX
- County
- Bexar County · 1,990,555 people
- City population
- 1,806,925
- Metro
- San Antonio-New Braunfels, TX
- Population (ZIP)
- 17,924
- Household income
- $52,094
- Rent vs Own
- Severe rent burden
- 852.0
Population outlook (Bexar County) Hauer SSP2
- Today (2025)
- 2,336,851 people
- By 2030
- 2,560,728 · +9.6%
- By 2040
- 3,020,569 · +29.3%
- By 2050
- 3,493,522 · +49.5%
- By 2075
- 4,668,459 · +99.8%
- By 2100
- 5,533,242 · +136.8%
Race, ethnicity, and origin ACS 2023
- Neighborhood character
- Diverse neighborhood (Simpson 0.63)
- Race & ethnicity
- Hispanic / Latino 53% Two or more races 27% Black 26% White 16% Asian 1%
- Hispanic origin (detail)
- Mexican 45%
- Common ancestry
- Lithuanian 1% Romanian 1% Slovak 1%
- Foreign-born
- 13% · Canada
- Languages at home
- 67% English-only · Spanish 31% Vietnamese 1%
Political lean MEDSL · Bexar
- 2024 margin
- Lean D (+9.8) · D 54.3% · R 44.6% · Other 1.1%
- 2008→2024 swing
- +4.2pp toward D · 2008: 5.6pp · 2024: 9.8pp
- All cycles
- 2024: D+9.8 2020: D+18.2 2016: D+13.5 2012: D+4.6 2008: D+5.6
Not yet ingested
- Civics
- —
Market trends
- HPI YoY
- ▲ 2.73%
- Current HPI
- 328.5107
- Rent YoY
- ▲ 7.72%
- Metro
- San Antonio-New Braunfels, TX
- State GDP YoY
- ▲ 3.95%
- F500 in state
- 110
Industry mix (Fortune 500 HQ in TX)
| Industry | F500 HQs | Revenue |
|---|---|---|
| Energy | 16 | $1,198B |
|
||
| Technology | 5 | $198B |
|
||
| Engineering / Construction | 4 | $72B |
|
||
| Energy Services | 3 | $60B |
|
||
| Utilities | 3 | $41B |
|
||
| Healthcare | 2 | $330B |
|
||
Price history
-19.8% since first listed5 events — show timeline
- 2026-05-10 Price Changed $200,499 Zillow
- 2025-09-01 Price Changed $199,999 Zillow
- 2025-07-17 Price Changed $209,999 Zillow
- 2025-05-06 Price Changed $229,999 Zillow
- 2025-05-03 Listed $249,999 Zillow
Cash-flow waterfall
monthlySold comps — $/sqft
last 12 mo · ≤1 miLoading sold comps…