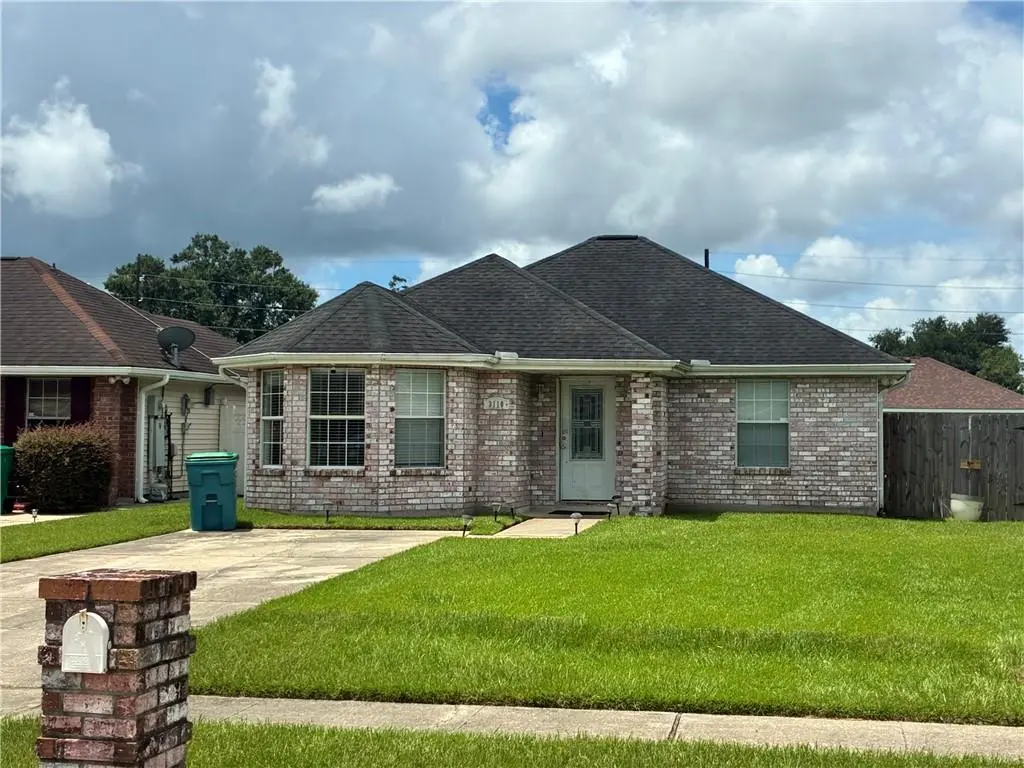
3110 Tyla Ct · Woodmere, LA
Flood risk No data
- FEMA flood zone
- —
- Chance of flooding over 30 yrs
- —
- Est. flood insurance / yr
- —
Fire risk No data
- Est. fire insurance / yr
- —
Heat risk No data
- Hot days now (above threshold)
- —
- Hot days in 30 yrs
- —
Wind risk No data
- Chance of severe wind over 30 yrs
- —
Air-quality risk No data
- Unhealthy air days now
- —
- Unhealthy air days in 30 yrs
- —
Risk factors via First Street. Map © Google.
Why this score? — see what drove the C+ grade
The composite is a weighted blend of 9 inputs, each scored 0–100. Each bar is that input's sub-score; the figure is the points it added to the 100-point composite (weight × sub-score).
- Cash flow +24.3/30.0
- ARV discount +15.0/15.0
- DSCR +7.8/10.0
- 1% rule +5.6/10.0
- Livability +3.1/5.0
- Schools +2.5/10.0
- Condition / age +2.5/5.0
- Rent growth +1.5/5.0
- Appreciation +0.0/10.0
$173,000
🖨 Deal sheet (PDF) 📄 Offer letter ✓ Due diligence
Listing remarks MLS
Ready to Sell. Open floor plan with a large kitchen open to the living room. Master bedroom is 18 x 14. House sit in a cul de sac with a deep lot of 150 ft.
Key facts
- Open floor plan
- Deep lot
- Cul de sac
Tags
Neighborhood map
What this means for you Summary
Snapshot
- This is a 3-bed/2.0-bath single-family listed at $173k.
Deal economics
- At list price, monthly cash flow is $348 ($4k/yr) — positive.
- The deal already cash-flows at list — no discount required.
- Meets the 1% rule at list price ($2k rent vs $173k).
- Recommended offer: $152k (12.0% below list) — sets the bar for market timing.
- Cap rate 8.7% vs local median 6.4% in Woodmere — top-decile yield for the area; either an underpriced asset or a hidden risk that comps aren't pricing in. Stress-test before assuming the spread holds.
Location & tenants
- Location reads 62/100 on livability (#216 in LA) — a middle-class / working-renter tenant base. Strengths: cost of living A+, housing A+; Watch: crime F, amenities F, commute F.
- Jefferson Parish (suburban): math 24% / reading 34% proficiency, ranked #44 of 98 in LA (top 45%) — low school quality limits family demand, transient renter base, plan for 1-2y turnover; 70% free/reduced lunch — lower-income household profile, screen leases tightly.
- Zoned schools: Woodmere School (math 8% / reading 13%, grade F, #594 of 646 statewide, top 92%, 385 students, 76% FRL); Harry S Truman School (math 7% / reading 18%, grade F, #546 of 646 statewide, top 85%, 541 students, 78% FRL); John Ehret High School (math 19% / reading 27%, grade F, #169 of 265 statewide, top 64%, 1,579 students, 66% FRL) — zoned schools at 73% FRL track the district average.
- Zoned-school proficiency averages 15% at this address vs 29% district-wide (-14 pts) — the specific schools serving this property underperform the Jefferson Parish average; the district grade overstates school quality for this exact location.
- Market conditions: Rents falling (-3.9%/yr); 189 active listings in the ZIP; 8 comparable units currently listed for rent nearby; rentals at typical pace (median 25d on market — plan ~3-4 weeks tenant-placement turnaround); 518 units permitted in Jefferson Parish in 2024 (43 in 5+ unit buildings).
- This rent runs 35% of the median local income ($62k/yr) — at the standard rent-burdened threshold; future hikes will face affordability resistance.
Forward outlook
- Local home prices are declining (-3.0%/yr); year-one equity from $1k of loan paydown is wiped out by about $5k of value loss. Plan a longer hold.
Negotiation context
- It's been on market 208 days — a 12% lower offer ($152k) is reasonable based on typical stale-listing flexibility.
- 9 sale attempts since 13y ago; this cycle's ask has dropped $24k (12%) from the opening price — seller is motivated, your offer sets the floor, not the list.
- Current owner paid $85k; list at $173k implies a 104% gain — meaningful room to come down on a strong offer.
Questions for the listing agent
- It's been on market 208 days. Have you received any prior offers? Is the seller open to a 12% concession, seller financing, or rate buy-down credit?
- Why hasn't it sold? Are there any deal-killer items the seller is aware of (foundation, flood, title, zoning, code violations)?
- Is there a deadline driving the sale (1031 exchange, divorce, estate, relocation)? That informs how much negotiation room exists.
- Schools are F-rated, which usually means shorter tenancies and higher turnover. Who's the typical renter profile here, and what's been the actual vacancy rate?
- Crime grade is F in this area — have there been break-ins, vandalism, or insurance claims at this property in the last 3 years? What carrier currently insures it and at what premium?
- What's the average days-on-market for RENTAL listings here right now (not sales)? A rising rental-DOM trend means longer vacancies and softer asking-rent achievability than the comps imply.
- What's the recent tenant-quality profile in this submarket — average credit score on applications, eviction rate, late-payment / NSF rate, and stable-employment percentage? A property-management company in the area should have these aggregated.
- How much new for-sale + rental construction is in the pipeline within 1–3 miles? Heavy new supply typically softens prices + rents 12–24 months out; constrained supply supports both.
Investment metrics
- 1% rule
- 1.06% ✓
- Cap rate
- 8.70%
- Cash-on-cash
- 8.61%
- DSCR
- 1.38
- GRM
- 7.8
CMA / ARV
- ARV (median comp)
- $230,723
- List price
- $173,000
- Delta
- -25.02%
- Verdict
- UNDERPRICED
- Comps
- 20 within 1.0 mi
Show comp detail 12 sales within ~0.75 mi
| Address | Dist | Beds/Ba | Sqft | Sold | Price | $/sf | Match |
|---|---|---|---|---|---|---|---|
| 3837 Eastview Dr | 0.16mi | 3/2.0 | 1,500 (+0%) | 5mo | $227,500 | $152 | 88 |
| 3729 Eastview Dr | 0.02mi | 3/2.0 | 1,450 (-3%) | 10mo | $225,500 | $156 | 85 |
| 3820 Greenbriar Ln | 0.14mi | 3/2.0 | 1,610 (+8%) | 14mo | $230,000 | $143 | 69 |
| 3861 Nathan Kornman Dr | 0.38mi | 3/2.0 | 1,633 (+9%) | 1mo | $219,900 | $135 | 66 |
| 2445 Tattersall Dr | 0.60mi | 3/2.0 | 1,500 (+0%) | 10mo | $220,000 | $147 | 63 |
| 3837 Redbud Ln | 0.20mi | 3/2.0 | 1,658 (+11%) | 12mo | $247,000 | $149 | 63 |
| 4045 N Indigo Dr | 0.69mi | 3/2.0 | 1,501 (+0%) | 11mo | $242,000 | $161 | 58 |
| 2433 Lynnbrook Dr | 0.58mi | 4/2.0 (+1) | 1,437 (-4%) | 5mo | $189,000 | $132 | 57 |
| 3712 Melissa Dr | 0.38mi | 3/2.0 | 1,721 (+15%) | 2mo | $237,000 | $138 | 55 |
| 3749 Glenoak Dr | 0.53mi | 3/2.0 | 1,432 (-4%) | 17mo | $193,000 | $135 | 54 |
| 2405 Tattersall Dr | 0.67mi | 3/2.0 | 1,365 (-9%) | 8mo | $228,250 | $167 | 47 |
| 4009 Deerglen Dr | 0.57mi | 3/2.0 | 1,665 (+11%) | 14mo | $210,000 | $126 | 43 |
Match score weights: distance 35% · size 25% · config 20% · recency 20%. Top-matched comps best support the ARV.
Projected returns pro-forma
-3.0% appreciation · 0.0% rent growth · sell at horizon
- IRR
- -6.5%
- Equity multiple
- 0.77×
- Total profit
- $-11,313
- Equity at exit
- $25,795
- IRR
- -0.8%
- Equity multiple
- 0.95×
- Total profit
- $-2,304
- Equity at exit
- $14,958
Cash invested: $48,440 (down + closing). Projections, not guarantees.
Landlord ↔ Tenant lean methodology
- Overall (STATE)
- 90 Strongly Landlord-Friendly
- State Louisiana
- 90 Strongly Landlord-Friendly · R+12
- County
- — inherits STATE
- City
- — inherits STATE
ZIP-level market 70058
- Rents YoY
- -3.9%
- Active inventory
- 189
- Price-to-rent
- 7.8×
Monthly cashflow live
- Estimated rent
- $1,842 high interval (Pro) →
- Mortgage (P&I)
- −$907
- Tax from tax record
- −$128 /mo · $1,536/yr
- Insurance
- −$72
- HOA
- −$0
- Vacancy / Maint / Mgmt
- −$387
- Net cashflow
- $348
Break-even live
Sensitivity live
| Price | -10% $446 | -5% $397 | +0% $348 | +5% $299 | +10% $250 |
|---|---|---|---|---|---|
| Rent | -10% $202 | -5% $275 | +0% $348 | +5% $420 | +10% $493 |
| Rate | -1.0pp $435 | -0.5pp $392 | base $348 | +0.5pp $303 | +1.0pp $257 |
UW: 25.0% down · 7.5% · 30yr · 1.5% tax · 5.0% vac · 8.0% maint · 8.0% mgmt
Financing live
Cash to close
- Down payment
- $43,250
- Closing costs
- $5,190
- Reserves months
- —
- Total cash needed
- —
Loan-product check · same deal, 3 products live
Conventional
25% down · 7.5% · 30yr
- Down + closing
- —
- Monthly P&I
- —
- Monthly cashflow
- —
- DSCR
- —
- Eligible?
- —
Personal DTI + credit; lowest rate.
DSCR
20% down · 8.5% · 30yr
- Down + closing
- —
- Monthly P&I
- —
- Monthly cashflow
- —
- DSCR
- —
- Eligible?
- —
No personal income docs; deal must DSCR.
Hard money
10% down · 12.0% · 12mo
- Down + closing
- —
- Monthly P&I
- —
- Monthly cashflow
- —
- DSCR
- —
- Eligible?
- —
Short-term bridge; refi at stabilization.
Rent comps 8 comps
| Address | Beds | Baths | Sqft | Rent | $/sqft | DOM | Units | Dist |
|---|---|---|---|---|---|---|---|---|
| 3019 Aspin Dr Harvey, LA | 3.0 | 1.0 | 900 | $1,600 | $1.78 | 25d | 1 | 0.22mi |
| 3014 Destrehan Ave Harvey, LA | 2.0 | 2.0 | 1150 | $1,600 | $1.39 | 45d | 1 | 0.23mi |
| 2236 Litchwood Ln Harvey, LA | 4.0 | 2.0 | 1800 | $2,200 | $1.22 | 3d | 1 | 0.73mi |
| 2236 Litchwood Ln Harvey, LA | 4.0 | 2.0 | 1800 | $2,200 | $1.22 | 5d | 1 | 0.73mi |
| 4016 S Dells St Harvey, LA | 4.0 | 2.0 | 1750 | $2,000 | $1.14 | 45d | 1 | 0.73mi |
| 2713 W Friendship Dr Harvey, LA | 3.0 | 2.0 | 1750 | $1,850 | $1.06 | 25d | 1 | 0.87mi |
| 2323 N Harper Dr Harvey, LA | 3.0 | 2.0 | 1678 | $3,000 | $1.79 | 45d | 1 | 0.94mi |
| 2612 Susie Ct Marrero, LA | 3.0 | 2.0 | 1852 | $2,200 | $1.19 | 21d | 1 | 1.31mi |
Listing history 33 events
-
2026-06-21days on market $173,000 Active 208 DOM
-
2026-06-18days on market $173,000 Active 205 DOM
-
2026-06-17days on market $173,000 Active 204 DOM
-
2026-06-16days on market $173,000 Active 203 DOM
-
2026-06-15days on market $173,000 Active 202 DOM
-
2026-06-13days on market $173,000 Active 200 DOM
-
2026-06-10days on market $173,000 Active 197 DOM
-
2026-06-09days on market $173,000 Active 196 DOM
-
2026-06-08days on market $173,000 Active 195 DOM
-
2026-06-07days on market $173,000 Active 194 DOM
-
2026-06-03days on market $173,000 Active 190 DOM
-
2026-06-02days on market $173,000 Active 189 DOM
-
2026-06-01days on market $173,000 Active 188 DOM
-
2026-05-31days on market $173,000 Active 187 DOM
-
2026-04-30status Active 156-char remark
Show marketing remark (156 chars)
Ready to Sell. Open floor plan with a large kitchen open to the living room. Master bedroom is 18 x 14. House sit in a cul de sac with a deep lot of 150 ft.
-
2026-04-30status Active 156-char remark
Show marketing remark (156 chars)
Ready to Sell. Open floor plan with a large kitchen open to the living room. Master bedroom is 18 x 14. House sit in a cul de sac with a deep lot of 150 ft.
-
2026-04-29historical Active Under Contract 156-char remark
Show marketing remark (156 chars)
Ready to Sell. Open floor plan with a large kitchen open to the living room. Master bedroom is 18 x 14. House sit in a cul de sac with a deep lot of 150 ft.
-
2026-03-24status Pending 156-char remark
Show marketing remark (156 chars)
Ready to Sell. Open floor plan with a large kitchen open to the living room. Master bedroom is 18 x 14. House sit in a cul de sac with a deep lot of 150 ft.
-
2026-03-24status Pending 156-char remark
Show marketing remark (156 chars)
Ready to Sell. Open floor plan with a large kitchen open to the living room. Master bedroom is 18 x 14. House sit in a cul de sac with a deep lot of 150 ft.
-
2026-01-02price $173,000 156-char remark
Show marketing remark (156 chars)
Ready to Sell. Open floor plan with a large kitchen open to the living room. Master bedroom is 18 x 14. House sit in a cul de sac with a deep lot of 150 ft.
-
2026-01-02price $173,000 156-char remark
Show marketing remark (156 chars)
Ready to Sell. Open floor plan with a large kitchen open to the living room. Master bedroom is 18 x 14. House sit in a cul de sac with a deep lot of 150 ft.
-
2026-01-01price $145,000 156-char remark
Show marketing remark (156 chars)
Ready to Sell. Open floor plan with a large kitchen open to the living room. Master bedroom is 18 x 14. House sit in a cul de sac with a deep lot of 150 ft.
-
2026-01-01status Active 156-char remark
Show marketing remark (156 chars)
Ready to Sell. Open floor plan with a large kitchen open to the living room. Master bedroom is 18 x 14. House sit in a cul de sac with a deep lot of 150 ft.
-
2026-01-01price $145,000 156-char remark
Show marketing remark (156 chars)
Ready to Sell. Open floor plan with a large kitchen open to the living room. Master bedroom is 18 x 14. House sit in a cul de sac with a deep lot of 150 ft.
-
2025-10-14historical 156-char remark
Show marketing remark (156 chars)
Ready to Sell. Open floor plan with a large kitchen open to the living room. Master bedroom is 18 x 14. House sit in a cul de sac with a deep lot of 150 ft.
-
2025-07-31$197,000 Active 156-char remark
Show marketing remark (156 chars)
Ready to Sell. Open floor plan with a large kitchen open to the living room. Master bedroom is 18 x 14. House sit in a cul de sac with a deep lot of 150 ft.
-
2025-07-31$197,000 Active 156-char remark
Show marketing remark (156 chars)
Ready to Sell. Open floor plan with a large kitchen open to the living room. Master bedroom is 18 x 14. House sit in a cul de sac with a deep lot of 150 ft.
-
2015-04-27soldstatus $85,000 Sold
-
2014-11-11$85,000
-
2014-11-11$85,000
-
2013-07-03$103,000
-
2013-07-03$103,000
-
2003-07-01soldstatus $106,500
ⓘ Source: listings_history table (triggers on properties + properties_extension) + one-shot
backfill from property_details.listing_events for pre-trigger history.
Tax reassessment forecast LA · Resets to sale price
- Current annual tax
- $1,536 · $128/mo
- Projected year-2 tax
- $1,536 · $128/mo
- Expected delta
- $0/yr ($0/mo · 0.0%)
ⓘ Screening estimate from a state-policy table — verify with the county assessor before closing.
Nearby sold comps map
Loading sold comps map…
Walkable amenities ~0.75 mi
Loading nearby amenities…
Taxation est. · year 1
- Rental income
- $22,102
- − Mortgage interest
- −$9,691
- − Property taxes
- −$1,536
- − Insurance
- −$865
- − Repairs & maintenance
- −$1,768
- − Management
- −$1,768
- − Depreciation
- −$5,033
- Taxable income
- $1,441
- Est. tax owed @ 24.0%
- −$346
- After-tax cash flow
- $3,826/yr
For passive investors: Depreciation is non-cash, so a rental often shows a tax loss while cash-flowing — sheltering income. Rental losses are passive: they offset passive income freely, and up to $25,000/yr can offset ordinary (W-2) income if you actively participate and your MAGI is under $100k (phasing out to $0 by $150k); unused losses carry forward. On sale, claimed depreciation is recaptured at up to 25%, and gains may owe capital-gains tax (a 1031 exchange can defer both). Figures are a year-1 estimate at your 24.0% rate — not tax advice; consult a CPA.
Schools (NCES district)
- District
- Jefferson Parish
- NCES district ID
- 2200840
- Math proficiency
- 24% ▼ -36.00%
- Reading proficiency
- 34% ▼ -30.00%
- Median HH income
- $48,421
- Composite
- 25.19/100
- National rank
- #7511
- State rank
- #44 of 98 in LA
Livability — Woodmere
- Score
- 62/100
- State rank
- #216
- US rank
- #16658
Category grades
Schools grade is shown separately in the Schools card above.
Census & demographics
- Census place
- Woodmere, LA
- County
- Jefferson Parish · 426,999 people
- Metro
- New Orleans-Metairie, LA
- Population (ZIP)
- 39,578
- Household income
- $62,416
- Rent vs Own
- Severe rent burden
- 1992.0
Population outlook (Jefferson County) Hauer SSP2
- Today (2025)
- 451,696 people
- By 2030
- 455,451 · +0.8%
- By 2040
- 458,308 · +1.5%
- By 2050
- 461,031 · +2.1%
- By 2075
- 476,351 · +5.5%
- By 2100
- 499,377 · +10.6%
Race, ethnicity, and origin ACS 2023
- Neighborhood character
- Diverse neighborhood (Simpson 0.60)
- Race & ethnicity
- Black 58% White 20% Hispanic / Latino 13% Asian 7% Two or more races 4%
- Hispanic origin (detail)
- Mexican 1% Dominican 1%
- Common ancestry
- Lithuanian 4% Hispanic 1%
- Foreign-born
- 13% · Canada, Vietnam
- Languages at home
- 81% English-only · Spanish 10% Vietnamese 5% French/Haitian/Cajun 2%
Political lean MEDSL · Jefferson
- 2024 margin
- R (+12.9) · D 42.5% · R 55.5% · Other 2.1%
- 2008→2024 swing
- +13.6pp toward D · 2008: -26.6pp · 2024: -12.9pp
- All cycles
- 2024: R+12.9 2020: R+11.1 2016: R+14.8 2012: R+18.4 2008: R+26.6
Not yet ingested
- Civics
- —
Market trends
- HPI YoY
- ▼ -96.82%
- Current HPI
- 156.1052
- Rent YoY
- ▼ -3.88%
- Metro
- New Orleans-Metairie, LA
- State GDP YoY
- ▲ 3.29%
- F500 in state
- 10
Industry mix (Fortune 500 HQ in LA)
| Industry | F500 HQs | Revenue |
|---|---|---|
| Telecommunications | 2 | $23B |
|
||
| Utilities | 1 | $12B |
|
||
| Wholesale / Distribution | 1 | $5B |
|
||
| Advertising | 1 | $2B |
|
||
Price history
+62.4% since first listed19 events — show timeline
- 2026-04-30 Relisted — AcadianaMLS
- 2026-04-30 Relisted — GSREIN
- 2026-04-29 Contingent — GSREIN
- 2026-03-24 Pending — AcadianaMLS
- 2026-03-24 Pending — GSREIN
- 2026-01-02 Price Changed $173,000 AcadianaMLS
- 2026-01-02 Price Changed $173,000 GSREIN
- 2026-01-01 Price Changed $145,000 AcadianaMLS
- 2026-01-01 Relisted — GSREIN
- 2026-01-01 Price Changed $145,000 GSREIN
- 2025-10-14 Listing Removed — GSREIN
- 2025-07-31 Listed $197,000 GSREIN
- 2025-07-31 Listed $197,000 AcadianaMLS
- 2015-04-27 Sold (MLS) $85,000 GSREIN
- 2014-11-11 Listed $85,000 AcadianaMLS
- 2014-11-11 Listed $85,000 GSREIN
- 2013-07-03 Listed $103,000 GSREIN
- 2013-07-03 Listed $103,000 AcadianaMLS
- 2003-07-01 Sold (Public Records) $106,500 Public Records
Property tax history
+2.2%/yrLatest (2025): $1,536 · +0.3% YoY. Source: county tax records.
Cash-flow waterfall
monthlySold comps — $/sqft
last 12 mo · ≤1 miLoading sold comps…