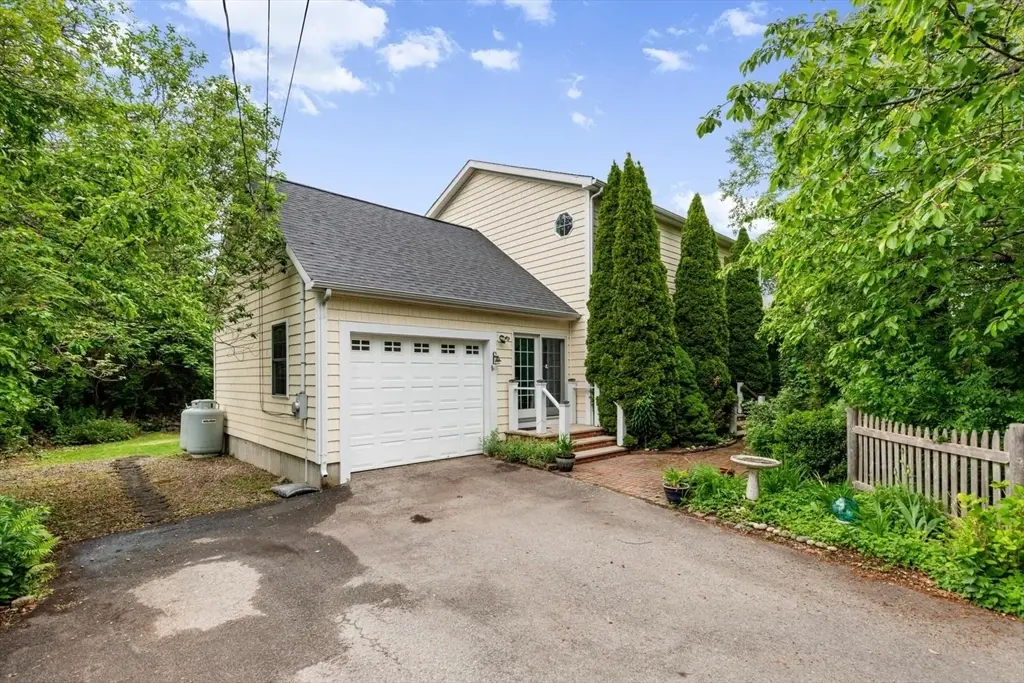
1 Pigeon Hill Ct Unit C · Rockport, MA
Flood risk 1/10 · Minimal
- FEMA flood zone
- X (unshaded)
- Chance of flooding over 30 yrs
- 0.0%
- Est. flood insurance / yr
- $473 – $860
Fire risk 2/10 · Minimal
- Est. fire insurance / yr
- $915 – $1,699
Heat risk 5/10 · Moderate
- Hot days now (above 87°F)
- 7 days/yr
- Hot days in 30 yrs
- 18 days/yr
Wind risk 8/10 · Major
- Chance of severe wind over 30 yrs
- 80.0%
Air-quality risk 2/10 · Minimal
- Unhealthy air days now
- 0 days/yr
- Unhealthy air days in 30 yrs
- 1 days/yr
Risk factors via First Street. Map © Google.
Why this score? — see what drove the B- grade
The composite is a weighted blend of 9 inputs, each scored 0–100. Each bar is that input's sub-score; the figure is the points it added to the 100-point composite (weight × sub-score).
- Cash flow +30.0/30.0
- DSCR +10.0/10.0
- 1% rule +9.1/10.0
- ARV discount +7.5/15.0
- Schools +3.7/10.0
- Livability +3.6/5.0
- Rent growth +2.5/5.0
- Condition / age +2.5/5.0
- Appreciation +0.0/10.0
$888,800
🖨 Deal sheet 📄 Offer letter ✓ Due diligence
Listing remarks MLS
Spacious custom Colonial home in tranquil and serene setting with a natural granite wall creating an inviting and private environment. Open and versatile floor plan, Cherry kitchen with gas stove, and island breakfast bar and Dining area with sliders to deck and yard. Formal Living Room and Dining Room or Family Room. Large Master Bedroom with walk-in-closet and private bath. Charming Granite Garden House, professionally landscaped with specimen plantings and perennial gardens. Wonderful setting for nature lovers, hikers, cross country skiers and more within steps to trails and baths to quarries and Dogtown. Two blocks from Pigeon Cove Harbor for launching boats and kayaks. Nearby commuter rail to North Station.
Key facts
- Granite wall
- Cherry kitchen
- Island breakfast bar
Tags
Property features AI
Finance
- HOA & community: Association present with annual fee; Community features include public transportation, shopping, golf, medical facility, laundromat, highway access, house of worship, public school, T-Station
Exterior
- Parking: Attached garage (1 covered garage space); Driveway and paved parking; Off-street/open parking (4 open spaces); Total of 5 parking spaces
- Utilities: Public water; Public sewer; Electrical: circuit breakers, 200+ amp service; Range connections for gas and electric; oven connections for gas and electric
- Home design: Single family residence; Yellow exterior color; Above-grade finished area reported
- Construction: Frame construction; Shingle roof; Concrete perimeter foundation; Year built approximate (per public records)
- Exterior features: Deck; Outdoor storage; Waterfront nearby: Bay, Harbor, Ocean; 1–2 miles to beach; public beach access; Private road frontage
Interior
- Kitchen: Range; Dishwasher; Disposal; Microwave; Refrigerator; Tankless water heater
- Bedrooms: Master bedroom on second floor (approx. 19.5 × 13); Second bedroom on second floor (approx. 11.6 × 12.9); Third bedroom on second floor (approx. 10.8 × 11)
- Flooring: Wood; Tile; Carpet
- Bathrooms: 2 full bathrooms; 1 half bathroom; Master bathroom included
- Heating & cooling: Baseboard heating; Propane heating; Has heating
- Interior features: Mud room; Partial basement with crawl space and interior entry; 7 total rooms
- Laundry & utility: Washer and dryer included; Washer hookup; Laundry located on second floor
Neighborhood map
What this means for you Summary
Snapshot
- This is a 3-bed/3.0-bath condo listed at $889k.
Deal economics
- At list price, monthly cash flow is $4k ($52k/yr) — positive.
- The deal already cash-flows at list — no discount required.
- Meets the 1% rule at list price ($13k rent vs $889k).
- Recommended offer: $875k (1.5% below list) — sets the bar for market timing.
- Cap rate 12.2% vs local median 2.0% in Rockport — top-decile yield for the area; either an underpriced asset or a hidden risk that comps aren't pricing in. Stress-test before assuming the spread holds.
Location & tenants
- Location reads 71/100 on livability (#130 in MA) — a middle-class / working-renter tenant base. Strengths: crime A+, commute A+, employment A+; Watch: housing C-, amenities F, cost of living F.
- Rockport (suburban): math 32% / reading 51% proficiency, ranked #187 of 302 in MA (top 62%) — families likely to look elsewhere, expect single-tenant / working-renter base with shorter leases; only 13% free/reduced lunch — higher-income household profile.
- Zoned schools: Rockport Elementary (math 32% / reading 52%, grade F, #462 of 938 statewide, top 52%, 304 students, 0% FRL); Rockport Middle (math 27% / reading 47%, grade F, #162 of 305 statewide, top 55%, 195 students, 0% FRL); Rockport High (math 54% / reading 64%, grade C+, #131 of 343 statewide, top 41%, 231 students, 0% FRL).
- Market conditions: 29 active listings in the ZIP; 2 comparable units currently listed for rent nearby; 1,032 units permitted in Essex County in 2024 (590 in 5+ unit buildings).
Forward outlook
- Local home prices are declining (-3.0%/yr); year-one equity from $6k of loan paydown is wiped out by about $27k of value loss. Plan a longer hold.
- Essex County population projected at +15% by 2050 — long-run rental-demand tailwind backs the buy-and-hold thesis.
- At projected returns (-3.0% appreciation + 3.0% rent growth), your $249k cash investment doubles in ~6 years — after that, you're playing with house money.
Negotiation context
- It's been on market 15 days — a 2% lower offer ($875k) is reasonable based on typical stale-listing flexibility.
- 3 sale attempts since 11y ago with the ask held roughly flat each time — persistent listings suggest the price (not the market) is what's stuck; bring a comps-based counter.
- Current owner paid $538k; list at $889k implies a 65% gain — meaningful room to come down on a strong offer.
Risks & watch-outs
- Climate carrying-cost: severe wind risk, 80% chance of damaging wind over 30y; extreme-heat days projected 7→18/yr by 2055 (HVAC capex compounding) — expect insurance premiums to compound above CPI over the hold.
Questions for the listing agent
- Any open or pending special assessments — roof, HVAC, plumbing, elevator, façade? What's the per-unit balance and payoff schedule, and is the seller paying it off at close or rolling it to the buyer?
- Is there a deadline driving the sale (1031 exchange, divorce, estate, relocation)? That informs how much negotiation room exists.
- Schools are B-rated — typically a magnet for longer-tenancy family renters. What's the average tenant stay here, and is there a school-zone premium baked into asking?
- What's the average days-on-market for RENTAL listings here right now (not sales)? A rising rental-DOM trend means longer vacancies and softer asking-rent achievability than the comps imply.
- What's the recent tenant-quality profile in this submarket — average credit score on applications, eviction rate, late-payment / NSF rate, and stable-employment percentage? A property-management company in the area should have these aggregated.
- How much new apartment / multifamily construction is in the pipeline within 1–3 miles? Heavy new supply (>2% of stock underway) typically softens rents 12–24 months out; light construction supports rent growth.
Investment metrics
- 1% rule
- 1.41% ✓
- Cap rate
- 12.17%
- Cash-on-cash
- 21.00%
- DSCR
- 1.93
- GRM
- 5.9
CMA / ARV
No comps found within radius.
Projected returns pro-forma
-3.0% appreciation · 3.0% rent growth · sell at horizon
- IRR
- 13.4%
- Equity multiple
- 1.54×
- Total profit
- $133,193
- Equity at exit
- $132,523
- IRR
- 22.2%
- Equity multiple
- 2.90×
- Total profit
- $472,461
- Equity at exit
- $76,847
Cash invested: $248,864 (down + closing). Projections, not guarantees.
Landlord ↔ Tenant lean methodology
- Overall (STATE)
- 20 Strongly Tenant-Friendly
- State Massachusetts
- 20 Strongly Tenant-Friendly · D+15
- County
- — inherits STATE
- City
- — inherits STATE
ZIP-level market 01966
- Home prices YoY
- -21.2%
- Active inventory
- 29
- Price-to-rent
- 5.9×
Monthly cashflow live
- Estimated rent
- $12,540 medium interval (Pro) →
- Mortgage (P&I)
- −$4,661
- Tax from tax record
- −$520 /mo · $6,240/yr
- Insurance
- −$370
- HOA
- −$0
- Vacancy / Maint / Mgmt
- −$2,633
- Net cashflow
- $4,355
Break-even live
UW: 25.0% down · 7.5% · 30yr · 1.5% tax · 5.0% vac · 8.0% maint · 8.0% mgmt
Financing live
Cash to close
- Down payment
- $222,200
- Closing costs
- $26,664
- Reserves months
- —
- Total cash needed
- —
Loan-product check · same deal, 3 products live
Conventional
25% down · 7.5% · 30yr
- Down + closing
- —
- Monthly P&I
- —
- Monthly cashflow
- —
- DSCR
- —
- Eligible?
- —
Personal DTI + credit; lowest rate.
DSCR
20% down · 8.5% · 30yr
- Down + closing
- —
- Monthly P&I
- —
- Monthly cashflow
- —
- DSCR
- —
- Eligible?
- —
No personal income docs; deal must DSCR.
Hard money
10% down · 12.0% · 12mo
- Down + closing
- —
- Monthly P&I
- —
- Monthly cashflow
- —
- DSCR
- —
- Eligible?
- —
Short-term bridge; refi at stabilization.
Rent comps 2 comps
| Address | Beds | Baths | Sqft | Rent | $/sqft | DOM | Units | Dist |
|---|---|---|---|---|---|---|---|---|
| 21 Norseman Ave Gloucester, MA | 2.0 | 2.0 | 1700 | $3,500 | $2.06 | 1d | 1 | 1.28mi |
| 14 Sunset Point Rd Gloucester, MA | 3.0 | 2.5 | 1518 | $24,000 | $15.81 | 1d | 1 | 1.45mi |
HOA detail condo
- Monthly dues
- $0 · $0/yr
- Likely covers
- gas
- Assessments
- None detected in remarks — confirm with the listing agent.
Listing history 12 events
-
2026-06-18days on market $888,800 Active 15 DOM
-
2026-06-17days on market $888,800 Active 14 DOM
-
2026-06-16days on market $888,800 Active 13 DOM
-
2026-06-15days on market $888,800 Active 12 DOM
-
2026-06-13days on market $888,800 Active 10 DOM
-
2026-06-13days on market $888,800 Active 9 DOM
-
2026-06-09days on market $888,800 Active 6 DOM
-
2026-06-08days on market $888,800 Active 5 DOM
-
2026-06-08status $888,800 Active 4 DOM
-
2026-06-07days on market $888,800 New 4 DOM
-
2026-06-03remarks 699-char remark
-
2026-06-03$888,800 New 1 DOM
ⓘ Source: listings_history table (triggers on properties + properties_extension) + one-shot
backfill from property_details.listing_events for pre-trigger history.
Tax reassessment forecast MA · Partial reset (capped growth)
- Current annual tax
- $6,240 · $520/mo
- Projected year-2 tax
- $8,586 · $716/mo
- Expected delta
- +$2,346/yr (+$196/mo · 37.6%)
ⓘ Screening estimate from a state-policy table — verify with the county assessor before closing.
Climate risk First Street
- Flood 1/10 Low FEMA zone X (unshaded) · 0% chance over 30 yrs
- Wildfire 2/10 Low
- Heat 5/10 Major 7 d/yr ≥87°F today · 18 d/yr by 30 yrs out
- Wind 8/10 Severe 80% chance of damaging wind over 30 yrs
- Air quality 2/10 Low 0 unhealthy d/yr today · 1 by 30 yrs out
Nearby sold comps map
Loading sold comps map…
Walkable amenities ~0.75 mi
Loading nearby amenities…
Taxation est. · year 1
- Rental income
- $150,480
- − Mortgage interest
- −$49,787
- − Property taxes
- −$6,240
- − Insurance
- −$4,444
- − Repairs & maintenance
- −$12,038
- − Management
- −$12,038
- − Depreciation
- −$25,856
- Taxable income
- $40,076
- Est. tax owed @ 24.0%
- −$9,618
- After-tax cash flow
- $42,645/yr
For passive investors: Depreciation is non-cash, so a rental often shows a tax loss while cash-flowing — sheltering income. Rental losses are passive: they offset passive income freely, and up to $25,000/yr can offset ordinary (W-2) income if you actively participate and your MAGI is under $100k (phasing out to $0 by $150k); unused losses carry forward. On sale, claimed depreciation is recaptured at up to 25%, and gains may owe capital-gains tax (a 1031 exchange can defer both). Figures are a year-1 estimate at your 24.0% rate — not tax advice; consult a CPA.
Schools (NCES district)
- District
- Rockport
- NCES district ID
- 2510200
- Math proficiency
- 32% ▼ -14.00%
- Reading proficiency
- 51% ▼ -8.00%
- Median HH income
- $67,677
- Composite
- 37.35/100
- National rank
- #4436
- State rank
- #187 of 302 in MA
Livability — Rockport
- Score
- 71/100
- State rank
- #130
- US rank
- #7169
Category grades
Schools grade is shown separately in the Schools card above.
Census & demographics
- City population
- 6,977
- Population (ZIP)
- 6,977
Population outlook (Essex County) Hauer SSP2
- Today (2025)
- 840,920 people
- By 2030
- 872,201 · +3.7%
- By 2040
- 927,918 · +10.3%
- By 2050
- 970,206 · +15.4%
- By 2075
- 1,077,993 · +28.2%
- By 2100
- 1,103,053 · +31.2%
Race, ethnicity, and origin ACS 2023
- Neighborhood character
- Predominantly White (94%)
- Race & ethnicity
- White 94% Two or more races 5% Hispanic / Latino 2%
- Common ancestry
- Lithuanian 5% Slovak 4% Romanian 4%
- Foreign-born
- 5% · Canada, Jamaica
- Languages at home
- 96% English-only · Other Indo-European 2% Spanish 1% French/Haitian/Cajun 1%
Political lean MEDSL · Essex
- 2024 margin
- Strong D (+20.3) · D 59.2% · R 38.9% · Other 1.9%
- 2008→2024 swing
- 0.0pp no change · 2008: 20.3pp · 2024: 20.3pp
- All cycles
- 2024: D+20.3 2020: D+29.1 2016: D+22.5 2012: D+16.2 2008: D+20.3
Not yet ingested
- Civics
- —
Market trends
- HPI YoY
- ▼ -74.07%
- Current HPI
- 275.8249
- Rent YoY
- —
- Metro
- —
- State GDP YoY
- ▲ 2.28%
- F500 in state
- 38
Industry mix (Fortune 500 HQ in MA)
| Industry | F500 HQs | Revenue |
|---|---|---|
| Technology | 3 | $17B |
|
||
| Insurance | 2 | $84B |
|
||
| Retail | 2 | $76B |
|
||
| Life Sciences | 1 | $43B |
|
||
| Energy Technology | 1 | $31B |
|
||
| Aerospace / Defense | 1 | $18B |
|
||
Price history
+72.6% since first listed7 events — show timeline
- 2026-06-03 Listed $888,800 MLS PIN
- 2015-10-23 Sold (MLS) $537,500 MLS PIN
- 2015-09-16 Pending — MLS PIN
- 2015-08-17 Relisted — MLS PIN
- 2015-08-04 Pending — MLS PIN
- 2015-07-31 Listed $549,900 MLS PIN
- 2006-06-30 Sold (Public Records) $515,000 Public Records
Property tax history
+2.9%/yrLatest (2023): $6,240 · -2.5% YoY. Source: county tax records.
Cash-flow waterfall
monthlySold comps — $/sqft
last 12 mo · ≤1 miLoading sold comps…