2139 Ky-215 · Kenvir, KY
Flood risk No data
- FEMA flood zone
- —
- Chance of flooding over 30 yrs
- —
- Est. flood insurance / yr
- —
Fire risk No data
- Est. fire insurance / yr
- —
Heat risk No data
- Hot days now (above threshold)
- —
- Hot days in 30 yrs
- —
Wind risk No data
- Chance of severe wind over 30 yrs
- —
Air-quality risk No data
- Unhealthy air days now
- —
- Unhealthy air days in 30 yrs
- —
Risk factors via First Street. Map © Google.
Why this score? — see what drove the B- grade
The composite is a weighted blend of 9 inputs, each scored 0–100. Each bar is that input's sub-score; the figure is the points it added to the 100-point composite (weight × sub-score).
- Cash flow +30.0/30.0
- 1% rule +10.0/10.0
- DSCR +10.0/10.0
- ARV discount +7.5/15.0
- Livability +2.8/5.0
- Rent growth +2.5/5.0
- Schools +2.0/10.0
- Appreciation +1.3/10.0
- Condition / age +1.0/5.0
$62,500
🖨 Deal sheet 📄 Offer letter ✓ Due diligence
Listing remarks MLS
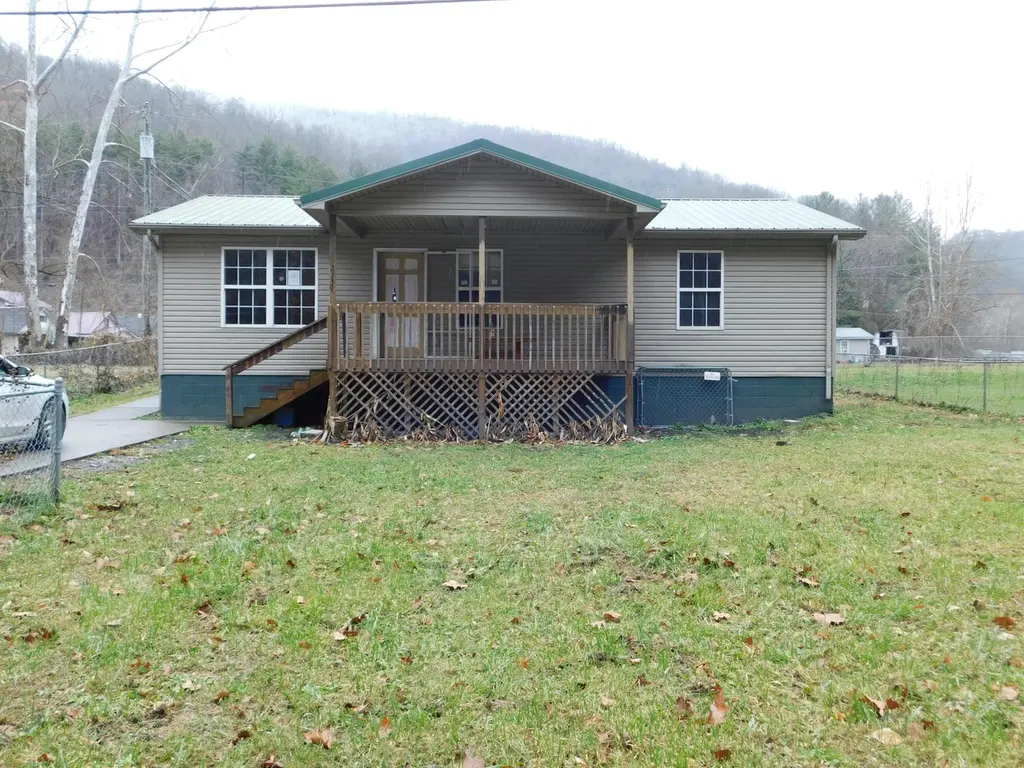
If you're looking to turn a house into a home, this is your opportunity! This 2 bedroom 1 bathroom home sits on a lovely flat yard, and just outside the Evarts community. Priced to sell, this home won't last long. Make it yours today!
Key facts
- 8,712 sq ft lot
- Built 2006
- Listed 175 days
Neighborhood map
What this means for you Summary
Snapshot
- This is a 2-bed/1.0-bath single-family listed at $62k. Condition is rated poor.
Deal economics
- At list price, monthly cash flow is $335 ($4k/yr) — positive.
- The deal already cash-flows at list — no discount required.
- Meets the 1% rule at list price ($971 rent vs $62k).
- Recommended offer: $55k (12.0% below list) — sets the bar for market timing.
Location & tenants
- Location reads 56/100 on livability (#457 in KY) — a working-class tenant base; expect higher turnover. Strengths: cost of living A+, housing A+; Watch: schools F, amenities F, commute F.
- Harlan County (rural): math 16% / reading 35% proficiency, ranked #149 of 165 in KY (top 90%) — low school quality limits family demand, transient renter base, plan for 1-2y turnover; 65% free/reduced lunch — lower-income household profile, screen leases tightly.
- Market conditions: 10 active listings in the ZIP.
Forward outlook
- Local home prices are declining (-3.0%/yr); year-one equity from $432 of loan paydown is wiped out by about $2k of value loss. Plan a longer hold.
- Harlan County population projected at -34% by 2050 — secular population decline; favor cash flow + early exit over multi-decade hold.
- At projected returns (-3.0% appreciation + 3.0% rent growth), your $18k cash investment doubles in ~6 years — after that, you're playing with house money.
Negotiation context
- It's been on market 175 days — a 12% lower offer ($55k) is reasonable based on typical stale-listing flexibility.
Questions for the listing agent
- It's been on market 175 days. Have you received any prior offers? Is the seller open to a 12% concession, seller financing, or rate buy-down credit?
- Have any recent inspections been done? Can we get a copy of the seller's disclosures and any deferred-maintenance estimates?
- Why hasn't it sold? Are there any deal-killer items the seller is aware of (foundation, flood, title, zoning, code violations)?
- Is there a deadline driving the sale (1031 exchange, divorce, estate, relocation)? That informs how much negotiation room exists.
- Schools are F-rated, which usually means shorter tenancies and higher turnover. Who's the typical renter profile here, and what's been the actual vacancy rate?
- What's the average days-on-market for RENTAL listings here right now (not sales)? A rising rental-DOM trend means longer vacancies and softer asking-rent achievability than the comps imply.
- What's the recent tenant-quality profile in this submarket — average credit score on applications, eviction rate, late-payment / NSF rate, and stable-employment percentage? A property-management company in the area should have these aggregated.
- How much new for-sale + rental construction is in the pipeline within 1–3 miles? Heavy new supply typically softens prices + rents 12–24 months out; constrained supply supports both.
Investment metrics
- 1% rule
- 1.55% ✓
- Cap rate
- 12.72%
- Cash-on-cash
- 22.96%
- DSCR
- 2.02
- GRM
- 5.4
CMA / ARV
- ARV (median comp)
- $38,024
- List price
- $62,500
- Delta
- 64.37%
- Verdict
- OVERPRICED
- Comps
- 4 within 1.0 mi
Projected returns pro-forma
-3.0% appreciation · 3.0% rent growth · sell at horizon
- IRR
- 15.9%
- Equity multiple
- 1.64×
- Total profit
- $11,210
- Equity at exit
- $9,319
- IRR
- 24.6%
- Equity multiple
- 3.13×
- Total profit
- $37,277
- Equity at exit
- $5,404
Cash invested: $17,500 (down + closing). Projections, not guarantees.
Landlord ↔ Tenant lean methodology
- Overall (STATE)
- 83 Strongly Landlord-Friendly
- State Kentucky
- 83 Strongly Landlord-Friendly · R+16
- County
- — inherits STATE
- City
- — inherits STATE
ZIP-level market 40828
- Home prices YoY
- -3.8%
- Active inventory
- 10
- Price-to-rent
- 5.4×
Monthly cashflow live
- Estimated rent
- $971 medium interval (Pro) →
- Mortgage (P&I)
- −$328
- Tax est. 1.5%
- −$78 /mo · $938/yr
- Insurance
- −$26
- HOA
- −$0
- Vacancy / Maint / Mgmt
- −$204
- Net cashflow
- $335
Break-even live
UW: 25.0% down · 7.5% · 30yr · 1.5% tax · 5.0% vac · 8.0% maint · 8.0% mgmt
Financing live
Cash to close
- Down payment
- $15,625
- Closing costs
- $1,875
- Reserves months
- —
- Total cash needed
- —
Loan-product check · same deal, 3 products live
Conventional
25% down · 7.5% · 30yr
- Down + closing
- —
- Monthly P&I
- —
- Monthly cashflow
- —
- DSCR
- —
- Eligible?
- —
Personal DTI + credit; lowest rate.
DSCR
20% down · 8.5% · 30yr
- Down + closing
- —
- Monthly P&I
- —
- Monthly cashflow
- —
- DSCR
- —
- Eligible?
- —
No personal income docs; deal must DSCR.
Hard money
10% down · 12.0% · 12mo
- Down + closing
- —
- Monthly P&I
- —
- Monthly cashflow
- —
- DSCR
- —
- Eligible?
- —
Short-term bridge; refi at stabilization.
Listing history 5 events
-
2026-06-03days on market $62,500 Active 175 DOM
-
2026-06-02days on market $62,500 Active 174 DOM
-
2026-06-01days on market $62,500 Active 173 DOM
-
2026-05-31days on market $62,500 Active 172 DOM
-
2025-12-08$62,500 Active 234-char remark
Show marketing remark (234 chars)
If you're looking to turn a house into a home, this is your opportunity! This 2 bedroom 1 bathroom home sits on a lovely flat yard, and just outside the Evarts community. Priced to sell, this home won't last long. Make it yours today!
ⓘ Source: listings_history table (triggers on properties + properties_extension) + one-shot
backfill from property_details.listing_events for pre-trigger history.
Nearby sold comps map
Loading sold comps map…
Walkable amenities ~0.75 mi
Loading nearby amenities…
Taxation est. · year 1
- Rental income
- $11,646
- − Mortgage interest
- −$3,501
- − Property taxes
- −$938
- − Insurance
- −$312
- − Repairs & maintenance
- −$932
- − Management
- −$932
- − Depreciation
- −$1,818
- Taxable income
- $3,214
- Est. tax owed @ 24.0%
- −$771
- After-tax cash flow
- $3,246/yr
For passive investors: Depreciation is non-cash, so a rental often shows a tax loss while cash-flowing — sheltering income. Rental losses are passive: they offset passive income freely, and up to $25,000/yr can offset ordinary (W-2) income if you actively participate and your MAGI is under $100k (phasing out to $0 by $150k); unused losses carry forward. On sale, claimed depreciation is recaptured at up to 25%, and gains may owe capital-gains tax (a 1031 exchange can defer both). Figures are a year-1 estimate at your 24.0% rate — not tax advice; consult a CPA.
Condition & rehab AI · 12 photos
This home requires extensive renovations, including painting, landscaping, and replacing flooring, cabinets, and fixtures. While it has potential, the current state significantly impacts its value.
Repairs flagged
- Major Deck — Structural damage
- Major Siding — Peeling and damaged
- Major Flooring — Worn and dirty
- Major Paint — Peeling and uneven
- Major Kitchen cabinets — Removed and in need of replacement
- Major Bathroom fixtures — Removed and in need of replacement
Value-add opportunities
- Resale Painting — Fresh paint enhances curb appeal
- Resale Landscaping — Well-maintained landscaping improves curb appeal
- Resale New flooring — New flooring improves aesthetics and functionality
- Resale New kitchen cabinets — New cabinets add value and functionality
- Resale New bathroom fixtures — New fixtures improve functionality and aesthetics
Renovation cost estimate screening
| Repair item | Severity | Est. cost |
|---|---|---|
| Deck · Structural damage | Major | $15,000–50,000 |
| Siding · Peeling and damaged | Major | $15,000–50,000 |
| Flooring · Worn and dirty | Major | $15,000–50,000 |
| Paint · Peeling and uneven | Major | $15,000–50,000 |
| Kitchen cabinets · Removed and in need of replacement | Major | $15,000–50,000 |
| Bathroom fixtures · Removed and in need of replacement | Major | $15,000–50,000 |
| Total estimated repair cost · 6 items | $90,000–300,000 |
Value-add ROI direction
- Resale Painting — Fresh paint enhances curb appeal ↑
- Resale Landscaping — Well-maintained landscaping improves curb appeal ↑
- Resale New flooring — New flooring improves aesthetics and functionality ↑
- Resale New kitchen cabinets — New cabinets add value and functionality ↑
- Resale New bathroom fixtures — New fixtures improve functionality and aesthetics ↑
ⓘ Cost ranges are severity-bucket heuristics (US national rule-of-thumb). Get contractor quotes + a written scope before underwriting a rehab budget.
Schools (NCES district)
- District
- Harlan County
- NCES district ID
- 2102540
- Math proficiency
- 16% ▼ -26.00%
- Reading proficiency
- 35% ▼ -24.00%
- Median HH income
- $26,283
- Composite
- 20.13/100
- National rank
- #8642
- State rank
- #149 of 165 in KY
Livability — Kenvir
- Score
- 56/100
- State rank
- #457
- US rank
- #22752
Category grades
Schools grade is shown separately in the Schools card above.
Census & demographics
- City population
- 97
- Population (ZIP)
- 4,431
Population outlook (Harlan County) Hauer SSP2
- Today (2025)
- 24,324 people
- By 2030
- 22,492 · -7.5%
- By 2040
- 19,052 · -21.7%
- By 2050
- 16,060 · -34.0%
- By 2075
- 10,525 · -56.7%
- By 2100
- 6,933 · -71.5%
Race, ethnicity, and origin ACS 2023
- Neighborhood character
- Predominantly White (94%)
- Race & ethnicity
- White 94% Black 3% Two or more races 3%
- Common ancestry
- Lithuanian 2% Serbian 2% Italian 1%
- Foreign-born
- 0%
- Languages at home
- 99% English-only · Spanish 1% Tagalog/Filipino 1%
Political lean MEDSL · Harlan
- 2024 margin
- Solid R (+76.2) · D 11.6% · R 87.7%
- 2008→2024 swing
- -30.0pp toward R · 2008: -46.2pp · 2024: -76.2pp
- All cycles
- 2024: R+76.2 2020: R+71.8 2016: R+72.2 2012: R+64.0 2008: R+46.2
Not yet ingested
- Civics
- —
Market trends
- HPI YoY
- ▼ -7.50%
- Current HPI
- 191.4283
- Rent YoY
- —
- Metro
- —
- State GDP YoY
- ▲ 1.81%
- F500 in state
- 4
Industry mix (Fortune 500 HQ in KY)
| Industry | F500 HQs | Revenue |
|---|---|---|
| Healthcare | 1 | $118B |
|
||
| Food / Beverage | 1 | $7B |
|
||
Price history
1 event — show timeline
- 2025-12-08 Listed $62,500 ImagineMLS
Cash-flow waterfall
monthlySold comps — $/sqft
last 12 mo · ≤1 miLoading sold comps…