 🏗️ New Construction
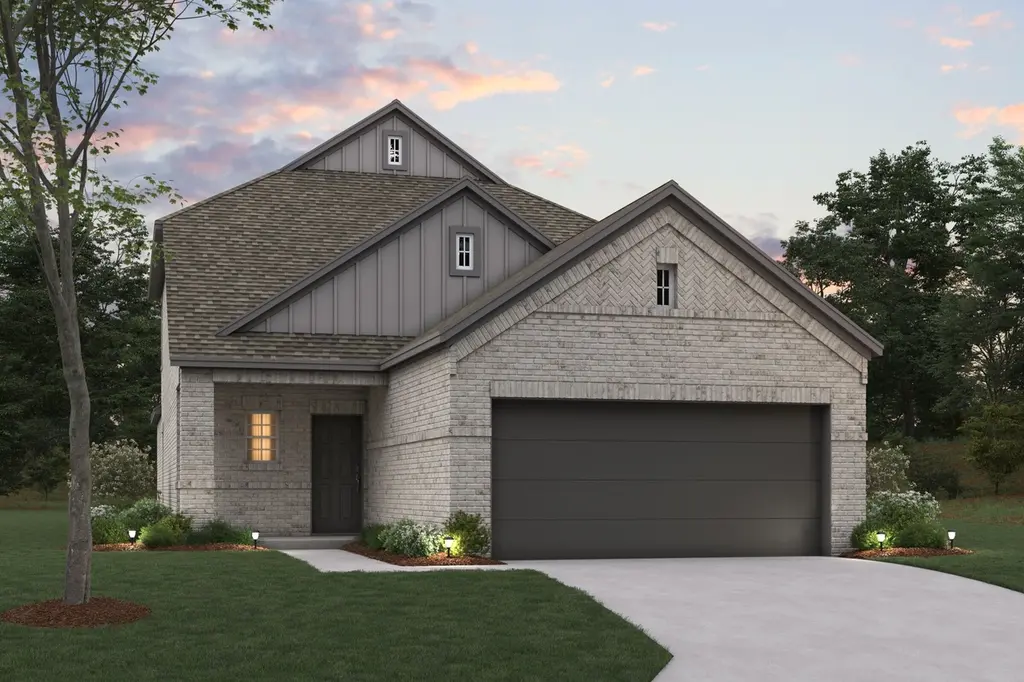
Rosemary Plan · Fulshear, TX
Flood risk 1/10 · Minimal
- FEMA flood zone
- X (unshaded)
- Chance of flooding over 30 yrs
- 0.0%
- Est. flood insurance / yr
- $507 – $1,088
Fire risk 4/10 · Minor
- Est. fire insurance / yr
- $1,222 – $2,270
Heat risk 8/10 · Major
- Hot days now (above 110°F)
- 7 days/yr
- Hot days in 30 yrs
- 19 days/yr
Wind risk 9/10 · Severe
- Chance of severe wind over 30 yrs
- 99.0%
Air-quality risk 2/10 · Minimal
- Unhealthy air days now
- 1 days/yr
- Unhealthy air days in 30 yrs
- 1 days/yr
Risk factors via First Street. Map © Google.
Why this score? — see what drove the C- grade
The composite is a weighted blend of 9 inputs, each scored 0–100. Each bar is that input's sub-score; the figure is the points it added to the 100-point composite (weight × sub-score).
- Cash flow +18.6/30.0
- ARV discount +7.5/15.0
- DSCR +5.8/10.0
- 1% rule +5.0/10.0
- Condition / age +4.8/5.0
- Schools +4.6/10.0
- Livability +3.5/5.0
- Rent growth +2.1/5.0
- Appreciation +0.0/10.0
$346,990
🖨 Deal sheet 📄 Offer letter ✓ Due diligence
Listing remarks MLS
This charming [stories]-story home boasts the best of open-concept living with the bonus of a centrally located kitchen, a private flex room, a first-floor owner's suite, and an upstairs game room. Contact our team today to learn more!
Key facts
- 2 garage spots
- Listed 960 days
Neighborhood map
What this means for you Summary
Snapshot
- This is a 4-bed/3.0-bath single-family listed at $347k. Condition is rated excellent.
Deal economics
- At list price, monthly cash flow is $316 ($4k/yr) — positive.
- The deal already cash-flows at list — no discount required.
- To meet the 1% rule (rent ≥ 1% of price), the offer needs to be $325k (6.4% below list).
- Recommended offer: $305k (12.0% below list) — sets the bar for market timing.
- Cap rate 7.5% vs local median 3.2% in Fulshear — top-decile yield for the area; either an underpriced asset or a hidden risk that comps aren't pricing in. Stress-test before assuming the spread holds.
Location & tenants
- Location reads 69/100 on livability (#430 in TX) — a middle-class / working-renter tenant base. Strengths: schools A+, crime A+, employment A+; Watch: amenities F, commute F, cost of living F.
- Lamar CISD (suburban): math 50% / reading 53% proficiency, ranked #116 of 826 in TX (top 14%) — acceptable for families but not a draw, mixed tenant base, ~2y average lease.
- Market conditions: Rents soft (-1.6%/yr); 1213 active listings in the ZIP; 7 comparable units currently listed for rent nearby; rentals leasing fast (median 13d on market — plan ~1-2 weeks tenant-placement turnaround); high-income renter base; 12,093 units permitted in Fort Bend County in 2024 (815 in 5+ unit buildings).
Forward outlook
- Local home prices are declining (-3.0%/yr); year-one equity from $2k of loan paydown is wiped out by about $10k of value loss. Plan a longer hold.
- Fort Bend County population projected at +75% by 2050 — long-run rental-demand tailwind backs the buy-and-hold thesis.
Negotiation context
- It's been on market 960 days — a 12% lower offer ($305k) is reasonable based on typical stale-listing flexibility.
Risks & watch-outs
- Climate carrying-cost: severe wind risk, 99% chance of damaging wind over 30y; extreme-heat days projected 7→19/yr by 2055 (HVAC capex compounding) — expect insurance premiums to compound above CPI over the hold.
Questions for the listing agent
- It's been on market 960 days. Have you received any prior offers? Is the seller open to a 12% concession, seller financing, or rate buy-down credit?
- Why hasn't it sold? Are there any deal-killer items the seller is aware of (foundation, flood, title, zoning, code violations)?
- Is there a deadline driving the sale (1031 exchange, divorce, estate, relocation)? That informs how much negotiation room exists.
- Schools are A-rated — typically a magnet for longer-tenancy family renters. What's the average tenant stay here, and is there a school-zone premium baked into asking?
- What's the average days-on-market for RENTAL listings here right now (not sales)? A rising rental-DOM trend means longer vacancies and softer asking-rent achievability than the comps imply.
- What's the recent tenant-quality profile in this submarket — average credit score on applications, eviction rate, late-payment / NSF rate, and stable-employment percentage? A property-management company in the area should have these aggregated.
- How much new for-sale + rental construction is in the pipeline within 1–3 miles? Heavy new supply typically softens prices + rents 12–24 months out; constrained supply supports both.
Investment metrics
- 1% rule
- 1.00% ✗
- Cap rate
- 7.46%
- Cash-on-cash
- 4.16%
- DSCR
- 1.18
- GRM
- 8.4
CMA / ARV
- ARV (median comp)
- $325,721
- List price
- $346,990
- Delta
- 6.53%
- Verdict
- FAIR
- Comps
- 20 within 1.0 mi
Show comp detail 12 sales within ~0.75 mi
| Address | Dist | Beds/Ba | Sqft | Sold | Price | $/sf | Match |
|---|---|---|---|---|---|---|---|
| 32107 Morning Luster Ct | 0.22mi | 4/3.0 | 2,402 (+2%) | 1mo | $369,990 | $154 | 86 |
| 5711 Sunland Trl | 0.26mi | 4/3.0 | 2,402 (+2%) | 1mo | $391,990 | $163 | 84 |
| 32215 Sunbeam Dr | 0.28mi | 4/3.0 | 2,417 (+2%) | 1mo | $364,990 | $151 | 82 |
| 32407 Sunbeam Dr | 0.39mi | 4/3.0 | 2,353 (-0%) | 2mo | $352,990 | $150 | 80 |
| 32503 Midsummer Dr | 0.42mi | 4/2.5 | 2,342 (-1%) | 1mo | $324,990 | $139 | 77 |
| 32511 Midsummer Dr | 0.43mi | 4/2.5 | 2,342 (-1%) | 1mo | $350,990 | $150 | 76 |
| 32455 Sunbeam Dr | 0.44mi | 4/2.5 | 2,342 (-1%) | 2mo | $329,990 | $141 | 75 |
| 32447 Sunbeam Dr | 0.43mi | 4/2.5 | 2,342 (-1%) | 2mo | $326,990 | $140 | 75 |
| 31423 Splitting Willow Way | 0.66mi | 4/3.0 | 2,242 (-5%) | 1mo | $349,999 | $156 | 60 |
| 32127 Morning Luster Ct | 0.25mi | 5/3.0 (+1) | 2,677 (+14%) | 1mo | $389,990 | $146 | 60 |
| 32223 Sunbeam Dr | 0.30mi | 5/4.0 (+1) | 2,697 (+14%) | 0mo | $379,990 | $141 | 53 |
| 31130 Crescent Hill Dr | 0.70mi | 4/3.5 | 2,695 (+14%) | 0mo | $499,000 | $185 | 41 |
Match score weights: distance 35% · size 25% · config 20% · recency 20%. Top-matched comps best support the ARV.
Projected returns pro-forma
-3.0% appreciation · 0.0% rent growth · sell at horizon
- IRR
- -13.2%
- Equity multiple
- 0.54×
- Total profit
- $-42,134
- Equity at exit
- $48,566
- IRR
- -9.8%
- Equity multiple
- 0.48×
- Total profit
- $-47,382
- Equity at exit
- $28,162
Cash invested: $91,202 (down + closing). Projections, not guarantees.
Landlord ↔ Tenant lean methodology
- Overall (STATE)
- 87 Strongly Landlord-Friendly
- State Texas
- 87 Strongly Landlord-Friendly · R+5
- County
- — inherits STATE
- City
- — inherits STATE
ZIP-level market 77441
- Rents YoY
- -1.6%
- Active inventory
- 1213
- Price-to-rent
- 8.9×
Monthly cashflow live
- Estimated rent
- $3,249 high interval (Pro) →
- Mortgage (P&I)
- −$1,708
- Tax est. 1.5%
- −$407 /mo · $4,886/yr
- Insurance
- −$136
- HOA
- −$0
- Vacancy / Maint / Mgmt
- −$682
- Net cashflow
- $316
Break-even live
UW: 25.0% down · 7.5% · 30yr · 1.5% tax · 5.0% vac · 8.0% maint · 8.0% mgmt
Financing live
Cash to close
- Down payment
- $81,430
- Closing costs
- $9,772
- Reserves months
- —
- Total cash needed
- —
Loan-product check · same deal, 3 products live
Conventional
25% down · 7.5% · 30yr
- Down + closing
- —
- Monthly P&I
- —
- Monthly cashflow
- —
- DSCR
- —
- Eligible?
- —
Personal DTI + credit; lowest rate.
DSCR
20% down · 8.5% · 30yr
- Down + closing
- —
- Monthly P&I
- —
- Monthly cashflow
- —
- DSCR
- —
- Eligible?
- —
No personal income docs; deal must DSCR.
Hard money
10% down · 12.0% · 12mo
- Down + closing
- —
- Monthly P&I
- —
- Monthly cashflow
- —
- DSCR
- —
- Eligible?
- —
Short-term bridge; refi at stabilization.
Rent comps 7 comps
| Address | Beds | Baths | Sqft | Rent | $/sqft | DOM | Units | Dist |
|---|---|---|---|---|---|---|---|---|
| 5462 Grand View Dr Unit 1568482P Pattison, TX | 5.0 | 3.5 | 2992 | $3,637 | $1.22 | 1d | 1 | 0.54mi |
| 7302 New Pecan Dr Fulshear, TX | 4.0 | 4.0 | 2844 | $3,299 | $1.16 | 43d | 1 | 0.88mi |
| 31043 Vintage Creek Ln Fulshear, TX | 4.0 | 3.5 | 2800 | $3,300 | $1.18 | 22d | 1 | 0.91mi |
| 5222 Wyatt James Ln Brookshire, TX | 4.0 | 2.5 | 2487 | $3,250 | $1.31 | 12d | 1 | 0.98mi |
| 33002 Franklin Brooks Dr Pattison, TX | 4.0 | 3.5 | 3255 | $4,385 | $1.35 | 1d | 1 | 1.07mi |
| 31123 Brightwell Bnd Fulshear, TX | 4.0 | 3.0 | 2400 | $2,400 | $1.00 | 12d | 1 | 1.07mi |
| 31419 Horseshoe Meadow Bend Ln Fulshear, TX | 3.0 | 2.0 | 1588 | $2,100 | $1.32 | 43d | 1 | 1.41mi |
Listing history 20 events
-
2026-06-18days on market $346,990 Active 960 DOM
-
2026-06-17days on market $346,990 Active 959 DOM
-
2026-06-16days on market $346,990 Active 958 DOM
-
2026-06-15days on market $346,990 Active 957 DOM
-
2026-06-13days on market $346,990 Active 955 DOM
-
2026-06-10days on market $346,990 Active 951 DOM
-
2026-06-08days on market $346,990 Active 950 DOM
-
2026-06-07days on market $346,990 Active 949 DOM
-
2026-06-04days on market $346,990 Active 946 DOM
-
2026-06-03days on market $346,990 Active 945 DOM
-
2026-06-02days on market $346,990 Active 944 DOM
-
2026-06-01days on market $346,990 Active 943 DOM
-
2026-05-31days on market $346,990 Active 942 DOM
-
2025-07-02price $346,990 235-char remark
Show marketing remark (235 chars)
This charming [stories]-story home boasts the best of open-concept living with the bonus of a centrally located kitchen, a private flex room, a first-floor owner's suite, and an upstairs game room. Contact our team today to learn more!
-
2025-03-08price $357,990 235-char remark
Show marketing remark (235 chars)
This charming [stories]-story home boasts the best of open-concept living with the bonus of a centrally located kitchen, a private flex room, a first-floor owner's suite, and an upstairs game room. Contact our team today to learn more!
-
2025-01-17price $357,240 235-char remark
Show marketing remark (235 chars)
This charming [stories]-story home boasts the best of open-concept living with the bonus of a centrally located kitchen, a private flex room, a first-floor owner's suite, and an upstairs game room. Contact our team today to learn more!
-
2024-07-18price $355,740 235-char remark
Show marketing remark (235 chars)
This charming [stories]-story home boasts the best of open-concept living with the bonus of a centrally located kitchen, a private flex room, a first-floor owner's suite, and an upstairs game room. Contact our team today to learn more!
-
2024-04-02price $354,740 235-char remark
Show marketing remark (235 chars)
This charming [stories]-story home boasts the best of open-concept living with the bonus of a centrally located kitchen, a private flex room, a first-floor owner's suite, and an upstairs game room. Contact our team today to learn more!
-
2024-02-10price $353,240 235-char remark
Show marketing remark (235 chars)
This charming [stories]-story home boasts the best of open-concept living with the bonus of a centrally located kitchen, a private flex room, a first-floor owner's suite, and an upstairs game room. Contact our team today to learn more!
-
2023-11-01$352,990 Active 235-char remark
Show marketing remark (235 chars)
This charming [stories]-story home boasts the best of open-concept living with the bonus of a centrally located kitchen, a private flex room, a first-floor owner's suite, and an upstairs game room. Contact our team today to learn more!
ⓘ Source: listings_history table (triggers on properties + properties_extension) + one-shot
backfill from property_details.listing_events for pre-trigger history.
Climate risk First Street
- Flood 1/10 Low FEMA zone X (unshaded) · 0% chance over 30 yrs
- Wildfire 4/10 Moderate
- Heat 8/10 Severe 7 d/yr ≥110°F today · 19 d/yr by 30 yrs out
- Wind 9/10 Extreme 99% chance of damaging wind over 30 yrs
- Air quality 2/10 Low 1 unhealthy d/yr today · 1 by 30 yrs out
Nearby sold comps map
Loading sold comps map…
Walkable amenities ~0.75 mi
Loading nearby amenities…
Taxation est. · year 1
- Rental income
- $38,991
- − Mortgage interest
- −$18,245
- − Property taxes
- −$4,886
- − Insurance
- −$1,629
- − Repairs & maintenance
- −$3,119
- − Management
- −$3,119
- − Depreciation
- −$9,476
- Taxable loss
- −$1,483
- Est. tax savings @ 24.0%
- +$356
- After-tax cash flow
- $4,147/yr
For passive investors: Depreciation is non-cash, so a rental often shows a tax loss while cash-flowing — sheltering income. Rental losses are passive: they offset passive income freely, and up to $25,000/yr can offset ordinary (W-2) income if you actively participate and your MAGI is under $100k (phasing out to $0 by $150k); unused losses carry forward. On sale, claimed depreciation is recaptured at up to 25%, and gains may owe capital-gains tax (a 1031 exchange can defer both). Figures are a year-1 estimate at your 24.0% rate — not tax advice; consult a CPA.
Condition & rehab AI · 12 photos
This move-in-ready home features a modern kitchen, private flex room, and first-floor owner's suite, all set in a well-maintained exterior with a brick facade and landscaped yard.
Value-add opportunities
- Both landscaping — enhances curb appeal and adds value
- Both interior paint — fresh paint can make a home more appealing
- Both furniture — stylish furniture can make a home more inviting
Renovation cost estimate screening
Value-add ROI direction
- Both landscaping — enhances curb appeal and adds value ↑
- Both interior paint — fresh paint can make a home more appealing ↑
- Both furniture — stylish furniture can make a home more inviting ↑
ⓘ Cost ranges are severity-bucket heuristics (US national rule-of-thumb). Get contractor quotes + a written scope before underwriting a rehab budget.
Schools (NCES district)
- District
- Lamar CISD
- NCES district ID
- 4826580
- Math proficiency
- 50% ▼ -12.00%
- Reading proficiency
- 53% ▼ -4.00%
- Median HH income
- $75,213
- Composite
- 46.43/100
- National rank
- #2452
- State rank
- #116 of 826 in TX
Livability — Fulshear
- Score
- 69/100
- State rank
- #430
- US rank
- #8901
Category grades
Schools grade is shown separately in the Schools card above.
Census & demographics
- County
- Fort Bend County · 836,777 people
- City population
- 41,324
- Metro
- Houston-The Woodlands-Sugar Land, TX
- Population (ZIP)
- 41,324
- Household income
- $184,390
- Rent vs Own
- Severe rent burden
- 301.0
Population outlook (Fort Bend County) Hauer SSP2
- Today (2025)
- 1,004,526 people
- By 2030
- 1,153,104 · +14.8%
- By 2040
- 1,453,718 · +44.7%
- By 2050
- 1,753,781 · +74.6%
- By 2075
- 2,455,772 · +144.5%
- By 2100
- 2,930,528 · +191.7%
Race, ethnicity, and origin ACS 2023
- Neighborhood character
- Diverse neighborhood (Simpson 0.62)
- Race & ethnicity
- White 57% Hispanic / Latino 20% Two or more races 15% Asian 12% Black 6%
- Hispanic origin (detail)
- Mexican 10%
- Common ancestry
- Lithuanian 5% Romanian 2% Italian 1%
- Foreign-born
- 26% · Canada, China, Jamaica
- Languages at home
- 68% English-only · Spanish 17% German/W. Germanic 4% Chinese 4%
Political lean MEDSL · Fort Bend
- 2024 margin
- Toss-up / Even · D 49.5% · R 47.9% · Other 2.6%
- 2008→2024 swing
- +4.0pp toward D · 2008: -2.4pp · 2024: 1.6pp
- All cycles
- 2024: D+1.6 2020: D+10.6 2016: D+6.6 2012: R+6.8 2008: R+2.4
Not yet ingested
- Civics
- —
Market trends
- HPI YoY
- ▼ -154.74%
- Current HPI
- 275.8798
- Rent YoY
- ▼ -1.63%
- Metro
- Houston-The Woodlands-Sugar Land, TX
- State GDP YoY
- ▲ 3.95%
- F500 in state
- 110
Industry mix (Fortune 500 HQ in TX)
| Industry | F500 HQs | Revenue |
|---|---|---|
| Energy | 16 | $1,198B |
|
||
| Technology | 5 | $198B |
|
||
| Engineering / Construction | 4 | $72B |
|
||
| Energy Services | 3 | $60B |
|
||
| Utilities | 3 | $41B |
|
||
| Healthcare | 2 | $330B |
|
||
Price history
-1.7% since first listed7 events — show timeline
- 2025-07-02 Price Changed $346,990 Zillow
- 2025-03-08 Price Changed $357,990 Zillow
- 2025-01-17 Price Changed $357,240 Zillow
- 2024-07-18 Price Changed $355,740 Zillow
- 2024-04-02 Price Changed $354,740 Zillow
- 2024-02-10 Price Changed $353,240 Zillow
- 2023-11-01 Listed $352,990 Zillow
Cash-flow waterfall
monthlySold comps — $/sqft
last 12 mo · ≤1 miLoading sold comps…