2422 Crescent Wood Rd · Navarre, FL
Flood risk 1/10 · Minimal
- FEMA flood zone
- X (unshaded)
- Chance of flooding over 30 yrs
- 0.0%
- Est. flood insurance / yr
- $507 – $1,088
Fire risk 6/10 · Moderate
- Est. fire insurance / yr
- $947 – $1,759
Heat risk 10/10 · Severe
- Hot days now (above 104°F)
- 7 days/yr
- Hot days in 30 yrs
- 21 days/yr
Wind risk 9/10 · Severe
- Chance of severe wind over 30 yrs
- 99.0%
Air-quality risk 2/10 · Minimal
- Unhealthy air days now
- 1 days/yr
- Unhealthy air days in 30 yrs
- 2 days/yr
Risk factors via First Street. Map © Google.
Why this score? — see what drove the D+ grade
The composite is a weighted blend of 9 inputs, each scored 0–100. Each bar is that input's sub-score; the figure is the points it added to the 100-point composite (weight × sub-score).
- Cash flow +17.5/30.0
- ARV discount +7.5/15.0
- DSCR +5.5/10.0
- Schools +5.3/10.0
- 1% rule +3.8/10.0
- Livability +3.5/5.0
- Rent growth +3.2/5.0
- Condition / age +2.5/5.0
- Appreciation +0.0/10.0
$298,500
🖨 Deal sheet (PDF) 📄 Offer letter ✓ Due diligence
Listing remarks
Seller offering $5k towards buyers closing cost! Tucked away on a quiet street with no through traffic and located just minutes from the white sands of Navarre Beach, this spacious nearly 2,400 sq. ft. home offers 4 bedrooms, 2 bathrooms, and a dedicated office--providing the space, layout, and coastal convenience buyers are looking for. Major updates include a new roof installed in 2022 and a storage shed added in 2023 for extra storage. The washer and dryer convey, and the home has been pet-free and well maintained, creating a clean, move-in-ready environment. Outdoor living is easy here. Relax on the screened porch, unwind on the porch swing, or gather with friends and family around the
Key facts
- Storage shed
- Screened porch
- Spa-style bathroom
Tags
Property features AI
Finance
- HOA & community: Subdivision: Crescent Shores
Exterior
- Parking: 2 driveway spaces
- Security: Smoke detectors
- Utilities: Electric service; Public water; Septic tank
- Home design: Mobile home style; Single-story; Built in 2007
- Construction: Vinyl siding; Pitched roof; Composite shingle roof; Appraiser-sourced building area
- Exterior features: Screened porch; Workshop; Interior, level lot; Private paved road access
Interior
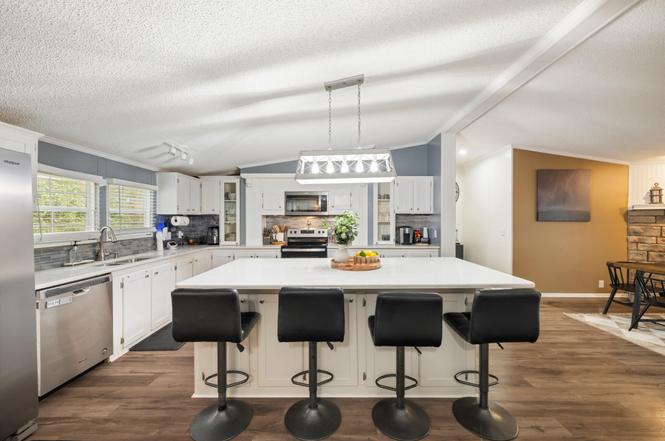
- Kitchen: Kitchen located on the first floor; Kitchen island; Dishwasher; Microwave
- Bedrooms: 4 bedrooms; Master suite on the first floor with double vanity, garden tub, separate shower, and walk-in closet; All bedrooms located on the first floor
- Flooring: Vinyl flooring; Carpet
- Bathrooms: 2 full bathrooms
- Heating & cooling: Central heating; Central air conditioning; Ceiling fans
- Interior features: Vaulted ceilings; Fireplace (EPA qualified); Kitchen island; Double-pane windows; 7 total rooms
- Laundry & utility: Electric water heater
Neighborhood map
What this means for you Summary
Snapshot
- This is a 4-bed/2.0-bath manufactured listed at $298k.
Deal economics
- At list price, monthly cash flow is $232 ($3k/yr) — positive.
- The deal already cash-flows at list — no discount required.
- To meet the 1% rule (rent ≥ 1% of price), the offer needs to be $263k (11.8% below list).
- Recommended offer: $263k (11.8% below list) — sets the bar for 1% rule.
- Cap rate 7.2% vs local median 4.2% in Navarre — top-decile yield for the area; either an underpriced asset or a hidden risk that comps aren't pricing in. Stress-test before assuming the spread holds.
Location & tenants
- Location reads 70/100 on livability (#435 in FL) — a middle-class / working-renter tenant base. Strengths: housing A+, employment A, crime A-; Watch: health & safety C-, amenities F, commute F.
- Santa Rosa (suburban): math 63% / reading 60% proficiency, ranked #8 of 73 in FL (top 11%) — acceptable for families but not a draw, mixed tenant base, ~2y average lease.
- Zoned schools: Holley-Navarre Primary (771 students, 41% FRL); Navarre High School (math 49% / reading 58%, grade C-, #146 of 667 statewide, top 22%, 2,406 students, 30% FRL) — zoned schools at 36% FRL track the district average.
- Market conditions: Rents rising (+2.7%/yr); 768 active listings in the ZIP; 15 comparable units currently listed for rent nearby; rentals at typical pace (median 25d on market — plan ~3-4 weeks tenant-placement turnaround); solid renter incomes; 1,983 units permitted in Santa Rosa County in 2024 (128 in 5+ unit buildings).
Forward outlook
- Local home prices are declining (-3.0%/yr); year-one equity from $2k of loan paydown is wiped out by about $9k of value loss. Plan a longer hold.
- Santa Rosa County population projected at +31% by 2050 — long-run rental-demand tailwind backs the buy-and-hold thesis.
Negotiation context
- It's been on market 102 days — a 9% lower offer ($272k) is reasonable based on typical stale-listing flexibility.
- 16 sale attempts since 25y ago with the ask held roughly flat each time — persistent listings suggest the price (not the market) is what's stuck; bring a comps-based counter.
Risks & watch-outs
- Climate carrying-cost: severe wind risk, 99% chance of damaging wind over 30y; major wildfire risk; extreme-heat days projected 7→21/yr by 2055 (HVAC capex compounding) — expect insurance premiums to compound above CPI over the hold.
Questions for the listing agent
- It's been on market 102 days. Have you received any prior offers? Is the seller open to a 12% concession, seller financing, or rate buy-down credit?
- Why hasn't it sold? Are there any deal-killer items the seller is aware of (foundation, flood, title, zoning, code violations)?
- Is there a deadline driving the sale (1031 exchange, divorce, estate, relocation)? That informs how much negotiation room exists.
- Schools are A-rated — typically a magnet for longer-tenancy family renters. What's the average tenant stay here, and is there a school-zone premium baked into asking?
- The area grade is low — what's the realistic commute time and amenity access for the typical tenant pool here? Any planned neighborhood developments (good or bad) we should know about?
- What's the average days-on-market for RENTAL listings here right now (not sales)? A rising rental-DOM trend means longer vacancies and softer asking-rent achievability than the comps imply.
- What's the recent tenant-quality profile in this submarket — average credit score on applications, eviction rate, late-payment / NSF rate, and stable-employment percentage? A property-management company in the area should have these aggregated.
- How much new for-sale + rental construction is in the pipeline within 1–3 miles? Heavy new supply typically softens prices + rents 12–24 months out; constrained supply supports both.
Investment metrics
- 1% rule
- 0.88% ✗
- Cap rate
- 7.22%
- Cash-on-cash
- 3.33%
- DSCR
- 1.15
- GRM
- 9.4
CMA / ARV
No comps found within radius.
Projected returns pro-forma
-3.0% appreciation · 2.74% rent growth · sell at horizon
- IRR
- -11.4%
- Equity multiple
- 0.59×
- Total profit
- $-34,392
- Equity at exit
- $44,507
- IRR
- -2.5%
- Equity multiple
- 0.83×
- Total profit
- $-14,124
- Equity at exit
- $25,809
Cash invested: $83,580 (down + closing). Projections, not guarantees.
Landlord ↔ Tenant lean methodology
- Overall (STATE)
- 87 Strongly Landlord-Friendly
- State Florida
- 87 Strongly Landlord-Friendly · R+3
- County
- — inherits STATE
- City
- — inherits STATE
ZIP-level market 32566
- Home prices YoY
- -26.2%
- Rents YoY
- 2.7%
- Active inventory
- 768
- Price-to-rent
- 9.4×
Monthly cashflow live
- Estimated rent
- $2,633 high interval (Pro) →
- Mortgage (P&I)
- −$1,565
- Tax from tax record
- −$158 /mo · $1,900/yr
- Insurance
- −$124
- HOA
- −$0
- Vacancy / Maint / Mgmt
- −$553
- Net cashflow
- $232
Break-even live
Sensitivity live
| Price | -10% $401 | -5% $316 | +0% $232 | +5% $147 | +10% $63 |
|---|---|---|---|---|---|
| Rent | -10% $24 | -5% $128 | +0% $232 | +5% $336 | +10% $440 |
| Rate | -1.0pp $382 | -0.5pp $308 | base $232 | +0.5pp $154 | +1.0pp $76 |
UW: 25.0% down · 7.5% · 30yr · 1.5% tax · 5.0% vac · 8.0% maint · 8.0% mgmt
Financing live
Cash to close
- Down payment
- $74,625
- Closing costs
- $8,955
- Reserves months
- —
- Total cash needed
- —
Loan-product check · same deal, 3 products live
Conventional
25% down · 7.5% · 30yr
- Down + closing
- —
- Monthly P&I
- —
- Monthly cashflow
- —
- DSCR
- —
- Eligible?
- —
Personal DTI + credit; lowest rate.
DSCR
20% down · 8.5% · 30yr
- Down + closing
- —
- Monthly P&I
- —
- Monthly cashflow
- —
- DSCR
- —
- Eligible?
- —
No personal income docs; deal must DSCR.
Hard money
10% down · 12.0% · 12mo
- Down + closing
- —
- Monthly P&I
- —
- Monthly cashflow
- —
- DSCR
- —
- Eligible?
- —
Short-term bridge; refi at stabilization.
Rent comps 15 comps
| Address | Beds | Baths | Sqft | Rent | $/sqft | DOM | Units | Dist |
|---|---|---|---|---|---|---|---|---|
| 9946 Mariposa St Navarre, FL | 3.0 | 2.0 | 1706 | $2,770 | $1.62 | 15d | 1 | 0.41mi |
| 9946 Mariposa St Navarre, FL | 3.0 | 2.0 | 1706 | $2,770 | $1.62 | 24d | 1 | 0.41mi |
| 2281 Tom St Navarre, FL | 3.0 | 2.0 | 1604 | $2,295 | $1.43 | 24d | 1 | 0.59mi |
| 2244 Hadleigh Hills Ct Navarre, FL | 3.0 | 2.5 | 1664 | $1,995 | $1.20 | 24d | 1 | 0.64mi |
| 2107 Nina St Navarre, FL | 3.0 | 2.0 | 1738 | $2,400 | $1.38 | 15d | 1 | 0.84mi |
| 10008 Calle de Palencia Navarre, FL | 3.0 | 2.0 | 2159 | $2,900 | $1.34 | 22d | 1 | 0.87mi |
| 9523 Parker Place Dr Navarre, FL | 3.0 | 2.0 | 1700 | $1,850 | $1.09 | 24d | 1 | 1.05mi |
| 2109 Bellemeade Cir Navarre, FL | 3.0 | 2.0 | 1658 | $1,900 | $1.15 | 15d | 1 | 1.05mi |
| 2109 Bellemeade Cir Navarre, FL | 3.0 | 2.0 | 1658 | $1,900 | $1.15 | 24d | 1 | 1.05mi |
| 2212 Peachwood Ct Navarre, FL | 3.0 | 2.0 | 1750 | $2,200 | $1.26 | 24d | 1 | 1.10mi |
| 300 Wildwood St Mary Esther, FL | 3.0 | 3.0 | 2706 | $3,100 | $1.15 | 45d | 1 | 1.16mi |
| 300 Wildwood St Mary Esther, FL | 3.0 | 3.0 | 2706 | $3,100 | $1.15 | 14d | 1 | 1.16mi |
| 306 Evergreen Dr Mary Esther, FL | 4.0 | 2.0 | 1741 | $2,250 | $1.29 | 45d | 1 | 1.18mi |
| 210 Michael Ave Mary Esther, FL | 3.0 | 2.0 | 1850 | $2,250 | $1.22 | 22d | 1 | 1.34mi |
| 202 Stephen Ave Mary Esther, FL | 3.0 | 3.0 | 2048 | $2,300 | $1.12 | 45d | 1 | 1.37mi |
Listing history 50 events
-
2026-06-18days on market $298,500 Active 102 DOM
-
2026-06-17days on market $298,500 Active 101 DOM
-
2026-06-16days on market $298,500 Active 100 DOM
-
2026-06-15days on market $298,500 Active 99 DOM
-
2026-06-14days on market $298,500 Active 97 DOM
-
2026-06-10days on market $298,500 Active 94 DOM
-
2026-06-09days on market $298,500 Active 93 DOM
-
2026-06-08days on market $298,500 Active 92 DOM
-
2026-06-07days on market $298,500 Active 91 DOM
-
2026-06-05days on market $298,500 Active 88 DOM
-
2026-06-03days on market $298,500 Active 87 DOM
-
2026-06-02days on market $298,500 Active 86 DOM
-
2026-06-01days on market $298,500 Active 85 DOM
-
2026-05-31days on market $298,500 Active 84 DOM
-
2026-05-31days on market $298,500 Active 83 DOM
-
2026-05-12price $298,500
-
2026-05-12price $298,500
-
2026-03-11$299,000 Active
-
2026-03-08$299,000 Active
-
2025-09-21historical
-
2025-08-10price $310,000
-
2025-08-10price $310,000
-
2025-08-02status Active
-
2025-07-30status Active
-
2025-07-29status Pending
-
2025-07-21status Active
-
2025-05-14historical Contingent
-
2025-03-21price $314,900
-
2025-03-20price $314,900
-
2024-12-20status Active
-
2024-11-30historical
-
2024-11-04$319,900 Active
-
2024-11-01$314,900 Active
-
2022-10-14soldstatus $265,000 Sold
-
2022-10-14soldstatus $265,000 Sold
-
2022-10-14soldstatus $265,000
-
2022-09-17status Pending
-
2022-09-17status Pending
-
2022-09-14$250,000 Active
-
2022-09-11$250,000 Active
-
2021-03-03soldstatus $175,000
-
2021-02-26soldstatus $175,000
-
2021-02-26soldstatus $175,000
-
2020-12-12$198,800
-
2020-12-12$198,800
-
2020-02-04historical
-
2019-11-04$92,000
-
2019-11-04$92,000
-
2007-07-02soldstatus $37,500
-
2007-06-28soldstatus $37,500
ⓘ Source: listings_history table (triggers on properties + properties_extension) + one-shot
backfill from property_details.listing_events for pre-trigger history.
Tax reassessment forecast FL · Resets to sale price
- Current annual tax
- $1,900 · $158/mo
- Projected year-2 tax
- $2,478 · $206/mo
- Expected delta
- +$577/yr (+$48/mo · 30.4%)
ⓘ Screening estimate from a state-policy table — verify with the county assessor before closing.
Climate risk First Street
- Flood 1/10 Low FEMA zone X (unshaded) · 0% chance over 30 yrs
- Wildfire 6/10 Major
- Heat 10/10 Extreme 7 d/yr ≥104°F today · 21 d/yr by 30 yrs out
- Wind 9/10 Extreme 99% chance of damaging wind over 30 yrs
- Air quality 2/10 Low 1 unhealthy d/yr today · 2 by 30 yrs out
Nearby sold comps map
Loading sold comps map…
Walkable amenities ~0.75 mi
Loading nearby amenities…
Taxation est. · year 1
- Rental income
- $31,592
- − Mortgage interest
- −$16,721
- − Property taxes
- −$1,900
- − Insurance
- −$1,492
- − Repairs & maintenance
- −$2,527
- − Management
- −$2,527
- − Depreciation
- −$8,684
- Taxable loss
- −$2,260
- Est. tax savings @ 24.0%
- +$542
- After-tax cash flow
- $3,323/yr
For passive investors: Depreciation is non-cash, so a rental often shows a tax loss while cash-flowing — sheltering income. Rental losses are passive: they offset passive income freely, and up to $25,000/yr can offset ordinary (W-2) income if you actively participate and your MAGI is under $100k (phasing out to $0 by $150k); unused losses carry forward. On sale, claimed depreciation is recaptured at up to 25%, and gains may owe capital-gains tax (a 1031 exchange can defer both). Figures are a year-1 estimate at your 24.0% rate — not tax advice; consult a CPA.
Schools (NCES district)
- District
- Santa Rosa
- NCES district ID
- 1201650
- Math proficiency
- 63% ▼ -6.00%
- Reading proficiency
- 60% ▼ -5.00%
- Median HH income
- $58,161
- Composite
- 53.12/100
- National rank
- #1511
- State rank
- #8 of 73 in FL
Livability — Navarre
- Score
- 70/100
- State rank
- #435
- US rank
- #7790
Category grades
Schools grade is shown separately in the Schools card above.
Census & demographics
- Census place
- Navarre, FL
- County
- Santa Rosa County · 194,764 people
- City population
- 43,883
- Metro
- Pensacola-Ferry Pass-Brent, FL
- Population (ZIP)
- 43,883
- Household income
- $105,551
- Rent vs Own
- Severe rent burden
- 608.0
Population outlook (Santa Rosa County) Hauer SSP2
- Today (2025)
- 195,978 people
- By 2030
- 209,782 · +7.0%
- By 2040
- 235,293 · +20.1%
- By 2050
- 256,408 · +30.8%
- By 2075
- 298,074 · +52.1%
- By 2100
- 303,216 · +54.7%
Race, ethnicity, and origin ACS 2023
- Neighborhood character
- Predominantly White (75%)
- Race & ethnicity
- White 75% Two or more races 9% Hispanic / Latino 9% Black 6% Asian 3%
- Hispanic origin (detail)
- Mexican 3% Puerto Rican 2%
- Common ancestry
- Scotch-Irish 3% Lithuanian 3% Romanian 2%
- Foreign-born
- 6% · Canada, Jamaica, Vietnam
- Languages at home
- 92% English-only · Spanish 4% German/W. Germanic 1% Tagalog/Filipino 1%
Political lean MEDSL · Santa Rosa
- 2024 margin
- Solid R (+51.0) · D 24.1% · R 75.0%
- 2008→2024 swing
- -3.0pp toward R · 2008: -47.9pp · 2024: -51.0pp
- All cycles
- 2024: R+51.0 2020: R+46.5 2016: R+53.5 2012: R+52.6 2008: R+47.9
Not yet ingested
- Civics
- —
Market trends
- HPI YoY
- ▼ -105.87%
- Current HPI
- 298.6821
- Rent YoY
- ▲ 2.74%
- Metro
- Pensacola-Ferry Pass-Brent, FL
- State GDP YoY
- ▲ 3.28%
- F500 in state
- 36
Industry mix (Fortune 500 HQ in FL)
| Industry | F500 HQs | Revenue |
|---|---|---|
| Industrial Technology | 2 | $29B |
|
||
| Insurance | 2 | $17B |
|
||
| Retail | 1 | $60B |
|
||
| Technology Distribution | 1 | $58B |
|
||
| Homebuilding | 1 | $35B |
|
||
| Technology Manufacturing | 1 | $35B |
|
||
Price history
-6.7% since first listed39 events — show timeline
- 2026-05-12 Price Changed $298,500 PARMLS
- 2026-05-12 Price Changed $298,500 ECAR
- 2026-03-11 Listed $299,000 PARMLS
- 2026-03-08 Listed $299,000 ECAR
- 2025-09-21 Listing Removed — PARMLS
- 2025-08-10 Price Changed $310,000 ECAR
- 2025-08-10 Price Changed $310,000 PARMLS
- 2025-08-02 Relisted — PARMLS
- 2025-07-30 Relisted — ECAR
- 2025-07-29 Pending — PARMLS
- 2025-07-21 Relisted — PARMLS
- 2025-05-14 Contingent — PARMLS
- 2025-03-21 Price Changed $314,900 ECAR
- 2025-03-20 Price Changed $314,900 PARMLS
- 2024-12-20 Relisted — PARMLS
- 2024-11-30 Listing Removed — PARMLS
- 2024-11-04 Listed $319,900 PARMLS
- 2024-11-01 Listed $314,900 ECAR
- 2022-10-14 Sold (Public Records) $265,000 Public Records
- 2022-10-14 Sold (MLS) $265,000 ECAR
- 2022-10-14 Sold (MLS) $265,000 NAMLS
- 2022-09-17 Pending — ECAR
- 2022-09-17 Pending — NAMLS
- 2022-09-14 Listed $250,000 ECAR
- 2022-09-11 Listed $250,000 NAMLS
- 2021-03-03 Sold (Public Records) $175,000 Public Records
- 2021-02-26 Sold (MLS) $175,000 NAMLS
- 2021-02-26 Sold (MLS) $175,000 ECAR
- 2020-12-12 Listed $198,800 NAMLS
- 2020-12-12 Listed $198,800 ECAR
- 2020-02-04 Listing Removed — NAMLS
- 2019-11-04 Listed $92,000 NAMLS
- 2019-11-04 Listed $92,000 ECAR
- 2007-07-02 Sold (Public Records) $37,500 Public Records
- 2007-06-28 Sold (MLS) $37,500 PARMLS
- 2007-02-19 Listed $47,500 PARMLS
- 2005-08-05 Sold (Public Records) $20,500 Public Records
- 2005-04-05 Sold (Public Records) $20,500 Public Records
- 2001-11-15 Listed $319,900 ECAR
Property tax history
+4.0%/yrLatest (2025): $1,900 · -0.7% YoY. Source: county tax records.
Cash-flow waterfall
monthlySold comps — $/sqft
last 12 mo · ≤1 miLoading sold comps…