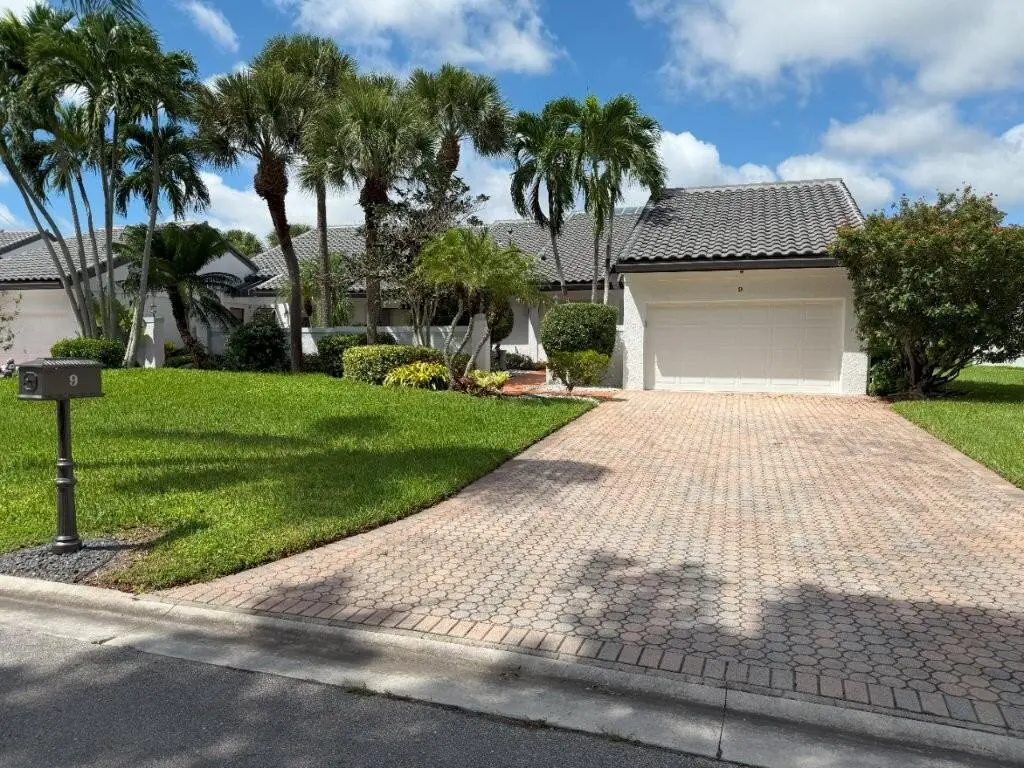
9 Windsor Ln · Boynton Beach, FL
Flood risk 1/10 · Minimal
- FEMA flood zone
- X (unshaded)
- Chance of flooding over 30 yrs
- 0.0%
- Est. flood insurance / yr
- $507 – $1,088
Fire risk 1/10 · Minimal
- Est. fire insurance / yr
- $947 – $1,759
Heat risk 9/10 · Severe
- Hot days now (above 105°F)
- 7 days/yr
- Hot days in 30 yrs
- 25 days/yr
Wind risk 10/10 · Severe
- Chance of severe wind over 30 yrs
- 99.0%
Air-quality risk 2/10 · Minimal
- Unhealthy air days now
- 1 days/yr
- Unhealthy air days in 30 yrs
- 2 days/yr
Risk factors via First Street. Map © Google.
Why this score? — see what drove the D- grade
The composite is a weighted blend of 9 inputs, each scored 0–100. Each bar is that input's sub-score; the figure is the points it added to the 100-point composite (weight × sub-score).
- 1% rule +9.6/10.0
- Cash flow +7.9/30.0
- ARV discount +7.5/15.0
- Schools +4.3/10.0
- Livability +3.6/5.0
- Condition / age +2.5/5.0
- Rent growth +2.4/5.0
- DSCR +2.0/10.0
- Appreciation +0.0/10.0
$369,900
🖨 Deal sheet 📄 Offer letter ✓ Due diligence
Listing remarks
Ideally positioned in Windsor on a private lot with sweeping golf course views, this home invites you to relax and entertain from the expansive enclosed patio and charming screened side patio—perfect for outdoor dining and enjoying South Florida's year-round sunshine. Inside, soaring vaulted ceilings and skylights fill the living and dining areas with natural light, creating a bright and airy ambiance. A flexible third bedroom or den offers space for a home office or guest suite, while the spacious primary suite boasts serene golf views, cathedral ceilings, and generous walk-in closets. Located within the prestigious, gated Hunters Run community, residents enjoy access to world-class
Key facts
- Screened side patio
- Vaulted ceilings
- Granite counters
Tags
Property features AI
Finance
- Other: Community of about 40 units; Pets allowed with restrictions (breed, number, and size limits may apply)
- HOA & community: Part of an association (Windsor at Hunters Run / Hunters Run); Monthly association fee; Association covers insurance, grounds maintenance, security, common areas, roof repairs, and recreation facility; Community amenities include clubhouse, fitness center, golf course, pool (including heated pool), sauna, spa/hot tub, tennis courts, pickleball courts, putting green, sidewalks, managed community, recreation facilities, bar, cafe/restaurant, library, manager on site, internet included
Exterior
- Parking: Attached garage; Approximately 1.5 garage spaces (total parking for 2 vehicles); Driveway
- Security: Gated community with guard; Security gate
- Utilities: Public water; Public sewer; Cable available
- Home design: Villa; One-story; Entry-level living area; Southeast-facing
- Construction: Stucco and CBS construction; Tile roof
- Exterior features: Screened patio; Open porch; Patio; Porch; Located on a golf course; Paved road
Interior
- Bedrooms: Three bedrooms on the main level (split layout)
- Flooring: Carpet; Laminate; Tile
- Bathrooms: Two full bathrooms on the main level
- Heating & cooling: Central electric heating; Central air conditioning; Ceiling fans
- Interior features: Built-in features; Cathedral and vaulted ceilings; Entrance foyer; High ceilings; Walk-in closets; Split bedroom layout; French doors; Skylights
- Laundry & utility: Inside, in-unit laundry
Neighborhood map
What this means for you Summary
Snapshot
- This is a 3-bed/2.0-bath condo listed at $370k.
Deal economics
- At list price, monthly cash flow is $-392 ($-5k/yr) — negative.
- To cash-flow at today's rent, offer at most $301k (18.7% below list).
- Meets the 1% rule at list price ($5k rent vs $370k).
- Recommended offer: $301k (18.7% below list) — sets the bar for cash-flow.
Location & tenants
- Location reads 72/100 on livability (#351 in FL) — a middle-class / working-renter tenant base. Strengths: housing A+, health & safety B+, cost of living B; Watch: amenities D+, crime D-, commute F.
- Palm Beach (suburban): math 46% / reading 53% proficiency, ranked #34 of 73 in FL (top 47%) — families likely to look elsewhere, expect single-tenant / working-renter base with shorter leases.
- Zoned schools: Crosspointe Elementary School (math 36% / reading 45%, grade F, #1,471 of 2,144 statewide, top 69%, 652 students, 75% FRL); Atlantic High School (math 28% / reading 52%, grade F, #296 of 667 statewide, top 45%, 1,889 students, 59% FRL) — zoned schools average 67% FRL vs 52% district-wide (15 pts higher); higher-poverty schools than district average — tighter screening recommended.
- Market conditions: Rents soft (-0.6%/yr); 445 active listings in the ZIP; 20 comparable units currently listed for rent nearby; rentals at typical pace (median 22d on market — plan ~3-4 weeks tenant-placement turnaround); solid renter incomes; 3,974 units permitted in Palm Beach County in 2024 (1,012 in 5+ unit buildings).
- At $5,401/mo this rent would consume 86% of the median local household income ($76k/yr) (locally 1813% of renters already pay >50% of income on rent) — very limited rent-growth headroom before tenants either downsize or default.
Forward outlook
- Local home prices are declining (-3.0%/yr); year-one equity from $3k of loan paydown is wiped out by about $11k of value loss. Plan a longer hold.
- Palm Beach County population projected at +30% by 2050 — long-run rental-demand tailwind backs the buy-and-hold thesis.
Negotiation context
- It's been on market 77 days — a 6% lower offer ($348k) is reasonable based on typical stale-listing flexibility.
- 8 sale attempts since 24y ago; this cycle's ask has dropped $20k (5%) from the opening price — seller is motivated, your offer sets the floor, not the list.
- Current owner paid $310k; 19% above their basis — modest negotiation headroom, anchor on the comps not their cost.
Risks & watch-outs
- Watch-outs: HOA is 41% of rent.
- Climate carrying-cost: severe wind risk, 99% chance of damaging wind over 30y; extreme-heat days projected 7→25/yr by 2055 (HVAC capex compounding) — expect insurance premiums to compound above CPI over the hold.
Questions for the listing agent
- What do current leases actually rent for vs. the listed asking? Can we see a recent rent roll and the last 12 months of T-12 income?
- It's been on market 77 days. Have you received any prior offers? Is the seller open to a 19% concession, seller financing, or rate buy-down credit?
- What does the HOA fee cover, when was the last increase, and are there any pending special assessments or reserve-fund shortfalls?
- Any open or pending special assessments — roof, HVAC, plumbing, elevator, façade? What's the per-unit balance and payoff schedule, and is the seller paying it off at close or rolling it to the buyer?
- Why hasn't it sold? Are there any deal-killer items the seller is aware of (foundation, flood, title, zoning, code violations)?
- Is there a deadline driving the sale (1031 exchange, divorce, estate, relocation)? That informs how much negotiation room exists.
- Crime grade is D in this area — have there been break-ins, vandalism, or insurance claims at this property in the last 3 years? What carrier currently insures it and at what premium?
- The area grade is low — what's the realistic commute time and amenity access for the typical tenant pool here? Any planned neighborhood developments (good or bad) we should know about?
- What's the average days-on-market for RENTAL listings here right now (not sales)? A rising rental-DOM trend means longer vacancies and softer asking-rent achievability than the comps imply.
- What's the recent tenant-quality profile in this submarket — average credit score on applications, eviction rate, late-payment / NSF rate, and stable-employment percentage? A property-management company in the area should have these aggregated.
- How much new apartment / multifamily construction is in the pipeline within 1–3 miles? Heavy new supply (>2% of stock underway) typically softens rents 12–24 months out; light construction supports rent growth.
Investment metrics
- 1% rule
- 1.46% ✓
- Cap rate
- 5.02%
- Cash-on-cash
- -4.54%
- DSCR
- 0.80
- GRM
- 5.7
CMA / ARV
No comps found within radius.
Projected returns pro-forma
-3.0% appreciation · 0.0% rent growth · sell at horizon
- IRR
- -30.4%
- Equity multiple
- 0.04×
- Total profit
- $-99,370
- Equity at exit
- $55,153
- IRR
- -80.6%
- Equity multiple
- -0.68×
- Total profit
- $-174,281
- Equity at exit
- $31,982
Cash invested: $103,572 (down + closing). Projections, not guarantees.
Landlord ↔ Tenant lean methodology
- Overall (STATE)
- 87 Strongly Landlord-Friendly
- State Florida
- 87 Strongly Landlord-Friendly · R+3
- County
- — inherits STATE
- City
- — inherits STATE
ZIP-level market 33436
- Home prices YoY
- -26.0%
- Rents YoY
- -0.6%
- Active inventory
- 445
- Price-to-rent
- 5.7×
Monthly cashflow live
- Estimated rent
- $5,401 high interval (Pro) →
- Mortgage (P&I)
- −$1,940
- Tax from tax record
- −$326 /mo · $3,914/yr
- Insurance
- −$154
- HOA
- −$2,239
- Vacancy / Maint / Mgmt
- −$1,134
- Net cashflow
- $-392
Break-even live
UW: 25.0% down · 7.5% · 30yr · 1.5% tax · 5.0% vac · 8.0% maint · 8.0% mgmt
Financing live
Cash to close
- Down payment
- $92,475
- Closing costs
- $11,097
- Reserves months
- —
- Total cash needed
- —
Loan-product check · same deal, 3 products live
Conventional
25% down · 7.5% · 30yr
- Down + closing
- —
- Monthly P&I
- —
- Monthly cashflow
- —
- DSCR
- —
- Eligible?
- —
Personal DTI + credit; lowest rate.
DSCR
20% down · 8.5% · 30yr
- Down + closing
- —
- Monthly P&I
- —
- Monthly cashflow
- —
- DSCR
- —
- Eligible?
- —
No personal income docs; deal must DSCR.
Hard money
10% down · 12.0% · 12mo
- Down + closing
- —
- Monthly P&I
- —
- Monthly cashflow
- —
- DSCR
- —
- Eligible?
- —
Short-term bridge; refi at stabilization.
Rent comps 20 comps
| Address | Beds | Baths | Sqft | Rent | $/sqft | DOM | Units | Dist |
|---|---|---|---|---|---|---|---|---|
| 18 Bristol Ln Boynton Beach, FL | 3.0 | 3.0 | 3293 | $10,000 | $3.04 | 24d | 1 | 0.36mi |
| 81 Nottingham Pl Boynton Beach, FL | 3.0 | 2.5 | 2209 | $3,500 | $1.58 | 22d | 1 | 0.41mi |
| 81 Nottingham Pl Boynton Beach, FL | 3.0 | 2.5 | 2209 | $3,500 | $1.58 | 17d | 1 | 0.41mi |
| 17 Country Lake Cir Boynton Beach, FL | 3.0 | 2.5 | 2312 | $4,250 | $1.84 | 24d | 1 | 0.54mi |
| 17 Country Lake Cir Boynton Beach, FL | 3.0 | 2.5 | 2312 | $4,250 | $1.84 | 22d | 1 | 0.54mi |
| 30 Beechdale Ln Boynton Beach, FL | 3.0 | 2.5 | 2226 | $3,300 | $1.48 | 22d | 1 | 0.63mi |
| 1770 NW 22nd Ave Delray Beach, FL | 3.0 | 2.0 | 1850 | $7,000 | $3.78 | 17d | 1 | 0.67mi |
| 2414 Venetian Way Boynton Beach, FL | 3.0 | 2.5 | 1990 | $3,200 | $1.61 | 15d | 1 | 1.04mi |
| 937 SW 34th Ct Boynton Beach, FL | 4.0 | 3.5 | 3388 | $18,500 | $5.46 | 24d | 1 | 1.11mi |
| 4020 Sabal Lakes Rd Delray Beach, FL | 4.0 | 2.5 | 2310 | $4,050 | $1.75 | 24d | 1 | 1.22mi |
| 1590 Verawood Ln Delray Beach, FL | 3.0 | 2.5 | 2295 | $4,400 | $1.92 | 12d | 1 | 1.33mi |
| 1507 Pine Ln Delray Beach, FL | 4.0 | 3.5 | 2660 | $18,000 | $6.77 | 24d | 1 | 1.35mi |
| 5 Lake Eden Dr Boynton Beach, FL | 3.0 | 2.5 | 2841 | $5,700 | $2.01 | 24d | 1 | 1.38mi |
| 2866 SW 8th St Boynton Beach, FL | 3.0 | 3.0 | 1954 | $6,000 | $3.07 | 5d | 1 | 1.40mi |
| 2866 SW 8th St Boynton Beach, FL | 3.0 | 3.0 | 1954 | $6,000 | $3.07 | 24d | 1 | 1.40mi |
| 514 NW 13th St Delray Beach, FL | 4.0 | 2.5 | 2563 | $25,000 | $9.75 | 24d | 1 | 1.43mi |
| 1117 Lake Dr Delray Beach, FL | 4.0 | 3.5 | 3466 | $28,000 | $8.08 | 12d | 1 | 1.43mi |
| 945 Sunflower Ave Delray Beach, FL | 3.0 | 2.0 | 1755 | $4,500 | $2.56 | 8d | 1 | 1.45mi |
| 302 NW 16th St Delray Beach, FL | 4.0 | 3.0 | 2304 | $15,500 | $6.73 | 24d | 1 | 1.45mi |
| 711 SW 27th Way Boynton Beach, FL | 3.0 | 3.0 | 1988 | $12,000 | $6.04 | 4d | 1 | 1.49mi |
HOA detail condo
- Monthly dues
- $2,239 · $26,868/yr
- Likely covers
- security
- Assessments
- None detected in remarks — confirm with the listing agent.
Listing history 39 events
-
2026-06-18days on market $369,900 Active 77 DOM
-
2026-06-17days on market $369,900 Active 76 DOM
-
2026-06-16days on market $369,900 Active 75 DOM
-
2026-06-15days on market $369,900 Active 74 DOM
-
2026-06-13days on market $369,900 Active 72 DOM
-
2026-06-09days on market $369,900 Active 68 DOM
-
2026-06-08days on market $369,900 Active 67 DOM
-
2026-06-07days on market $369,900 Active 66 DOM
-
2026-06-04days on market $369,900 Active 63 DOM
-
2026-06-03pricedays on market $369,900 Active 62 DOM
-
2026-06-02days on market $389,900 Active 61 DOM
-
2026-06-01days on market $389,900 Active 60 DOM
-
2026-05-31days on market $389,900 Active 59 DOM
-
2026-03-31$389,900 Active
-
2026-03-11historical
-
2025-12-11$449,900 Active
-
2025-08-23historical
-
2025-07-18price $425,000
-
2024-09-16$525,000 Active
-
2024-06-15historical
-
2024-01-31price $549,000
-
2024-01-05price $599,900
-
2023-11-14price $629,000
-
2023-09-10price $649,000
-
2023-08-09$695,000 Active
-
2023-08-03historical
-
2023-03-17status Active
-
2023-03-01historical Active Under Contract
-
2023-01-03price $719,000
-
2022-10-11$749,000 Active
-
2003-05-20soldstatus $310,000
-
2002-12-02soldstatus $335,000
-
2002-10-01historical
-
2002-05-22soldstatus $310,000
-
2002-05-20soldstatus $310,000
-
2002-04-16historical
-
2002-03-05$355,000
-
2002-03-01$355,000
-
1990-08-20soldstatus $250,000
ⓘ Source: listings_history table (triggers on properties + properties_extension) + one-shot
backfill from property_details.listing_events for pre-trigger history.
Tax reassessment forecast FL · Resets to sale price
- Current annual tax
- $3,914 · $326/mo
- Projected year-2 tax
- $3,914 · $326/mo
- Expected delta
- $0/yr ($0/mo · 0.0%)
ⓘ Screening estimate from a state-policy table — verify with the county assessor before closing.
Climate risk First Street
- Flood 1/10 Low FEMA zone X (unshaded) · 0% chance over 30 yrs
- Wildfire 1/10 Low
- Heat 9/10 Extreme 7 d/yr ≥105°F today · 25 d/yr by 30 yrs out
- Wind 10/10 Extreme 99% chance of damaging wind over 30 yrs
- Air quality 2/10 Low 1 unhealthy d/yr today · 2 by 30 yrs out
Nearby sold comps map
Loading sold comps map…
Walkable amenities ~0.75 mi
Loading nearby amenities…
Taxation est. · year 1
- Rental income
- $64,814
- − Mortgage interest
- −$20,720
- − Property taxes
- −$3,914
- − Insurance
- −$1,850
- − Repairs & maintenance
- −$5,185
- − Management
- −$5,185
- − HOA
- −$26,868
- − Depreciation
- −$10,761
- Taxable loss
- −$9,668
- Est. tax savings @ 24.0%
- +$2,320
- After-tax cash flow
- $-2,385/yr
For passive investors: Depreciation is non-cash, so a rental often shows a tax loss while cash-flowing — sheltering income. Rental losses are passive: they offset passive income freely, and up to $25,000/yr can offset ordinary (W-2) income if you actively participate and your MAGI is under $100k (phasing out to $0 by $150k); unused losses carry forward. On sale, claimed depreciation is recaptured at up to 25%, and gains may owe capital-gains tax (a 1031 exchange can defer both). Figures are a year-1 estimate at your 24.0% rate — not tax advice; consult a CPA.
Schools (NCES district)
- District
- Palm Beach
- NCES district ID
- 1201500
- Math proficiency
- 46% ▼ -16.00%
- Reading proficiency
- 53% ▼ -4.00%
- Median HH income
- $53,943
- Composite
- 42.72/100
- National rank
- #3160
- State rank
- #34 of 73 in FL
Livability — Boynton Beach
- Score
- 72/100
- State rank
- #351
- US rank
- #6098
Category grades
Schools grade is shown separately in the Schools card above.
Census & demographics
- Census place
- Boynton Beach, FL
- County
- Palm Beach County · 1,438,312 people
- City population
- 148,060
- Metro
- Miami-Fort Lauderdale-Pompano Beach, FL
- Population (ZIP)
- 48,743
- Household income
- $75,789
- Rent vs Own
- Severe rent burden
- 1813.0
Population outlook (Palm Beach County) Hauer SSP2
- Today (2025)
- 1,637,487 people
- By 2030
- 1,743,255 · +6.5%
- By 2040
- 1,948,712 · +19.0%
- By 2050
- 2,132,979 · +30.3%
- By 2075
- 2,530,027 · +54.5%
- By 2100
- 2,706,979 · +65.3%
Race, ethnicity, and origin ACS 2023
- Neighborhood character
- Diverse neighborhood (Simpson 0.64)
- Race & ethnicity
- White 52% Black 24% Hispanic / Latino 19% Two or more races 10% Asian 2%
- Hispanic origin (detail)
- Mexican 2% Puerto Rican 4% Cuban 3% Dominican 1%
- Common ancestry
- Hispanic 12% Romanian 3% Scotch-Irish 2%
- Foreign-born
- 27% · Canada, Jamaica, Vietnam
- Languages at home
- 64% English-only · Spanish 14% French/Haitian/Cajun 13% Other Indo-European 2%
Political lean MEDSL · Palm Beach
- 2024 margin
- Toss-up / Even · D 50.0% · R 49.2%
- 2008→2024 swing
- -22.1pp toward R · 2008: 22.9pp · 2024: 0.8pp
- All cycles
- 2024: D+0.8 2020: D+12.8 2016: D+15.3 2012: D+17.0 2008: D+22.9
Not yet ingested
- Civics
- —
Market trends
- HPI YoY
- ▼ -109.59%
- Current HPI
- 311.7742
- Rent YoY
- ▼ -0.57%
- Metro
- Miami-Fort Lauderdale-Pompano Beach, FL
- State GDP YoY
- ▲ 3.28%
- F500 in state
- 36
Industry mix (Fortune 500 HQ in FL)
| Industry | F500 HQs | Revenue |
|---|---|---|
| Industrial Technology | 2 | $29B |
|
||
| Insurance | 2 | $17B |
|
||
| Retail | 1 | $60B |
|
||
| Technology Distribution | 1 | $58B |
|
||
| Homebuilding | 1 | $35B |
|
||
| Technology Manufacturing | 1 | $35B |
|
||
Price history
+56.0% since first listed26 events — show timeline
- 2026-03-31 Listed $389,900 Beaches MLS
- 2026-03-11 Listing Removed — Beaches MLS
- 2025-12-11 Listed $449,900 Beaches MLS
- 2025-08-23 Listing Removed — Beaches MLS
- 2025-07-18 Price Changed $425,000 Beaches MLS
- 2024-09-16 Listed $525,000 Beaches MLS
- 2024-06-15 Listing Removed — Beaches MLS
- 2024-01-31 Price Changed $549,000 Beaches MLS
- 2024-01-05 Price Changed $599,900 Beaches MLS
- 2023-11-14 Price Changed $629,000 Beaches MLS
- 2023-09-10 Price Changed $649,000 Beaches MLS
- 2023-08-09 Listed $695,000 Beaches MLS
- 2023-08-03 Listing Removed — Beaches MLS
- 2023-03-17 Relisted — Beaches MLS
- 2023-03-01 Contingent — Beaches MLS
- 2023-01-03 Price Changed $719,000 Beaches MLS
- 2022-10-11 Listed $749,000 Beaches MLS
- 2003-05-20 Sold (MLS) $310,000 Beaches MLS
- 2002-12-02 Sold (Public Records) $335,000 Public Records
- 2002-10-01 Listing Removed — Beaches MLS
- 2002-05-22 Sold (Public Records) $310,000 Public Records
- 2002-05-20 Sold (MLS) $310,000 Beaches MLS
- 2002-04-16 Listing Removed — Beaches MLS
- 2002-03-05 Listed $355,000 Beaches MLS
- 2002-03-01 Listed $355,000 Beaches MLS
- 1990-08-20 Sold (Public Records) $250,000 Public Records
Property tax history
-1.5%/yrLatest (2025): $3,914 · +3.1% YoY. Source: county tax records.
Cash-flow waterfall
monthlySold comps — $/sqft
last 12 mo · ≤1 miLoading sold comps…