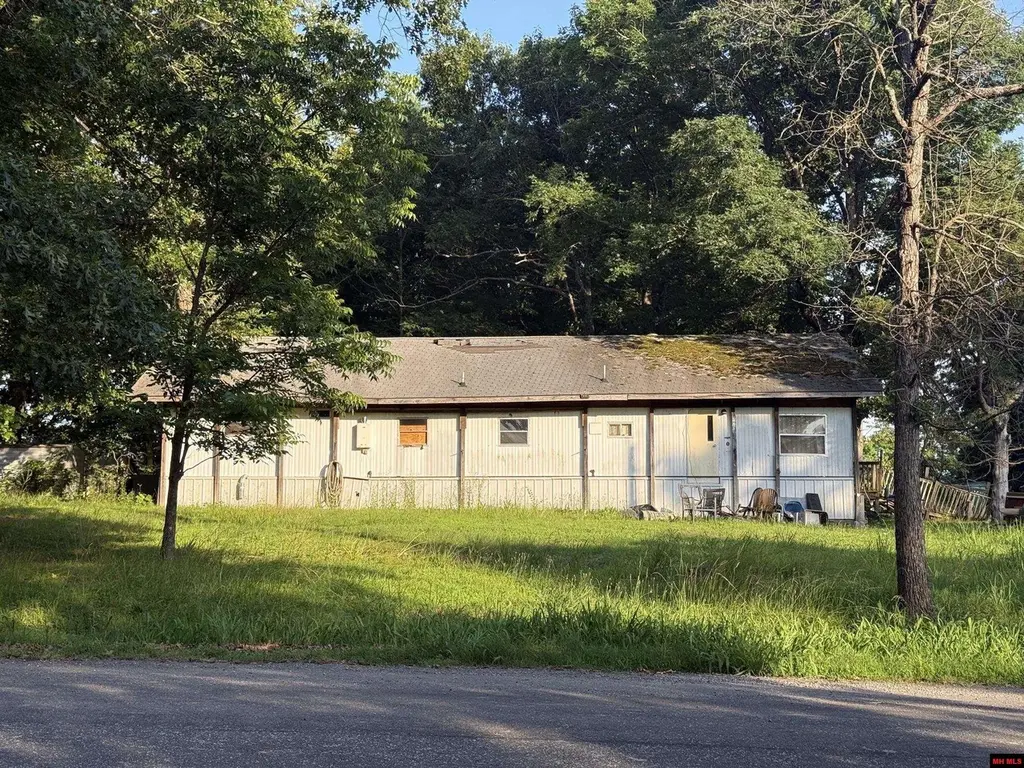
902 Shorecrest Dr · Bull Shoals, AR
Flood risk No data
- FEMA flood zone
- —
- Chance of flooding over 30 yrs
- —
- Est. flood insurance / yr
- —
Fire risk No data
- Est. fire insurance / yr
- —
Heat risk No data
- Hot days now (above threshold)
- —
- Hot days in 30 yrs
- —
Wind risk No data
- Chance of severe wind over 30 yrs
- —
Air-quality risk No data
- Unhealthy air days now
- —
- Unhealthy air days in 30 yrs
- —
Risk factors via First Street. Map © Google.
Why this score? — see what drove the D grade
The composite is a weighted blend of 9 inputs, each scored 0–100. Each bar is that input's sub-score; the figure is the points it added to the 100-point composite (weight × sub-score).
- Cash flow +15.0/30.0
- ARV discount +7.5/15.0
- 1% rule +5.0/10.0
- DSCR +5.0/10.0
- Livability +3.4/5.0
- Schools +2.7/10.0
- Rent growth +2.5/5.0
- Condition / age +2.5/5.0
- Appreciation +0.0/10.0
$20,000
🖨 Deal sheet (PDF) 📄 Offer letter ✓ Due diligence
Listing remarks MLS
This mobile with a roof over & add on needs TLC. Its located within walking distance to Bull Shoals Marina & Boat Launch, Banking, groceries and other conveniences. With a little work it would be perfect for a weekend getaway or rental. This home is sold as is.
Key facts
- City water and sewer
- Permanent foundation
- Two city lots
Tags
Property features AI
Exterior
- Home design: Manufactured home (Residential)
- Construction: Masonite and metal siding
- Exterior features: 0.3-acre lot
Interior
- Bathrooms: 1 full bathroom
- Heating & cooling: Central heating (Propane); Central electric air conditioning
- Interior features: Wood-burning fireplace (1)
Neighborhood map
What this means for you Summary
Snapshot
- This is a 3-bed/1.0-bath manufactured listed at $20k.
Deal economics
- At list price, monthly cash flow is $700 ($8k/yr) — positive.
- The deal already cash-flows at list — no discount required.
- Meets the 1% rule at list price ($1k rent vs $20k).
- Cap rate 48.3% vs local median 2.4% in Bull Shoals — top-decile yield for the area; either an underpriced asset or a hidden risk that comps aren't pricing in. Stress-test before assuming the spread holds.
Location & tenants
- Location reads 67/100 on livability (#92 in AR) — a middle-class / working-renter tenant base. Strengths: cost of living A+, crime A, housing A; Watch: schools F, amenities F, commute F.
- Flippin School District (rural): math 34% / reading 30% proficiency, ranked #143 of 238 in AR (top 60%) — families likely to look elsewhere, expect single-tenant / working-renter base with shorter leases.
- Market conditions: 74 active listings in the ZIP; 237 units permitted in Marion County in 2024 (0 in 5+ unit buildings).
Forward outlook
- Local home prices are declining (-3.0%/yr); year-one equity from $138 of loan paydown is wiped out by about $600 of value loss. Plan a longer hold.
- Marion County population projected at -24% by 2050 — secular population decline; favor cash flow + early exit over multi-decade hold.
- At projected returns (-3.0% appreciation + 3.0% rent growth), your $6k cash investment doubles in ~1 year — after that, you're playing with house money.
Negotiation context
- Only 10 days on market — expect competitive offers; lowballing is unlikely to land.
- 2 sale attempts since 10y ago with the ask held roughly flat each time — persistent listings suggest the price (not the market) is what's stuck; bring a comps-based counter.
- Current owner paid $15k; 33% above their basis — modest negotiation headroom, anchor on the comps not their cost.
Questions for the listing agent
- Is there a deadline driving the sale (1031 exchange, divorce, estate, relocation)? That informs how much negotiation room exists.
- Schools are F-rated, which usually means shorter tenancies and higher turnover. Who's the typical renter profile here, and what's been the actual vacancy rate?
- The area grade is low — what's the realistic commute time and amenity access for the typical tenant pool here? Any planned neighborhood developments (good or bad) we should know about?
- What's the average days-on-market for RENTAL listings here right now (not sales)? A rising rental-DOM trend means longer vacancies and softer asking-rent achievability than the comps imply.
- What's the recent tenant-quality profile in this submarket — average credit score on applications, eviction rate, late-payment / NSF rate, and stable-employment percentage? A property-management company in the area should have these aggregated.
- How much new for-sale + rental construction is in the pipeline within 1–3 miles? Heavy new supply typically softens prices + rents 12–24 months out; constrained supply supports both.
Investment metrics
- 1% rule
- 5.22% ✓
- Cap rate
- 48.29%
- Cash-on-cash
- 149.97%
- DSCR
- 7.67
- GRM
- 1.6
CMA / ARV
- ARV (on-the-fly)
- $167,440
- Comps found
- 1
Show comp detail 1 sale within ~0.75 mi
| Address | Dist | Beds/Ba | Sqft | Sold | Price | $/sf | Match |
|---|---|---|---|---|---|---|---|
| 111 Chelsea Ln | 0.57mi | 3/2.0 | 1,280 (-12%) | 9mo | $146,900 | $115 | 42 |
Match score weights: distance 35% · size 25% · config 20% · recency 20%. Top-matched comps best support the ARV.
Projected returns pro-forma
-3.0% appreciation · 3.0% rent growth · sell at horizon
- IRR
- —
- Equity multiple
- 8.38×
- Total profit
- $41,342
- Equity at exit
- $2,982
- IRR
- —
- Equity multiple
- 17.68×
- Total profit
- $93,427
- Equity at exit
- $1,729
Cash invested: $5,600 (down + closing). Projections, not guarantees.
Landlord ↔ Tenant lean methodology
- Overall (STATE)
- 92 Strongly Landlord-Friendly
- State Arkansas
- 92 Strongly Landlord-Friendly · R+14
- County
- — inherits STATE
- City
- — inherits STATE
ZIP-level market 72619
- Home prices YoY
- -22.1%
- Active inventory
- 74
- Price-to-rent
- 1.6×
Monthly cashflow live
- Estimated rent
- $1,043 medium interval (Pro) →
- Mortgage (P&I)
- −$105
- Tax from tax record
- −$11 /mo · $131/yr
- Insurance
- −$8
- HOA
- −$0
- Vacancy / Maint / Mgmt
- −$219
- Net cashflow
- $700
Break-even live
Sensitivity live
| Price | -10% $711 | -5% $706 | +0% $700 | +5% $694 | +10% $689 |
|---|---|---|---|---|---|
| Rent | -10% $617 | -5% $659 | +0% $700 | +5% $741 | +10% $782 |
| Rate | -1.0pp $710 | -0.5pp $705 | base $700 | +0.5pp $695 | +1.0pp $689 |
UW: 25.0% down · 7.5% · 30yr · 1.5% tax · 5.0% vac · 8.0% maint · 8.0% mgmt
Financing live
Cash to close
- Down payment
- $5,000
- Closing costs
- $600
- Reserves months
- —
- Total cash needed
- —
Loan-product check · same deal, 3 products live
Conventional
25% down · 7.5% · 30yr
- Down + closing
- —
- Monthly P&I
- —
- Monthly cashflow
- —
- DSCR
- —
- Eligible?
- —
Personal DTI + credit; lowest rate.
DSCR
20% down · 8.5% · 30yr
- Down + closing
- —
- Monthly P&I
- —
- Monthly cashflow
- —
- DSCR
- —
- Eligible?
- —
No personal income docs; deal must DSCR.
Hard money
10% down · 12.0% · 12mo
- Down + closing
- —
- Monthly P&I
- —
- Monthly cashflow
- —
- DSCR
- —
- Eligible?
- —
Short-term bridge; refi at stabilization.
Listing history 9 events
-
2026-06-19days on market $20,000 Active 10 DOM
-
2026-06-18days on market $20,000 Active 9 DOM
-
2026-06-17days on market $20,000 Active 8 DOM
-
2026-06-16days on market $20,000 Active 7 DOM
-
2026-06-15days on market $20,000 Active 6 DOM
-
2026-06-14days on market $20,000 Active 4 DOM
-
2026-06-12days on market $20,000 Active 3 DOM
-
2026-06-09remarks 615-char remark
-
2026-06-09$20,000 Active 1 DOM
ⓘ Source: listings_history table (triggers on properties + properties_extension) + one-shot
backfill from property_details.listing_events for pre-trigger history.
Tax reassessment forecast AR · Resets to sale price
- Current annual tax
- $131 · $11/mo
- Projected year-2 tax
- $131 · $11/mo
- Expected delta
- $0/yr ($0/mo · 0.0%)
ⓘ Screening estimate from a state-policy table — verify with the county assessor before closing.
Nearby sold comps map
Loading sold comps map…
Walkable amenities ~0.75 mi
Loading nearby amenities…
Taxation est. · year 1
- Rental income
- $12,516
- − Mortgage interest
- −$1,120
- − Property taxes
- −$131
- − Insurance
- −$100
- − Repairs & maintenance
- −$1,001
- − Management
- −$1,001
- − Depreciation
- −$582
- Taxable income
- $8,581
- Est. tax owed @ 24.0%
- −$2,059
- After-tax cash flow
- $6,339/yr
For passive investors: Depreciation is non-cash, so a rental often shows a tax loss while cash-flowing — sheltering income. Rental losses are passive: they offset passive income freely, and up to $25,000/yr can offset ordinary (W-2) income if you actively participate and your MAGI is under $100k (phasing out to $0 by $150k); unused losses carry forward. On sale, claimed depreciation is recaptured at up to 25%, and gains may owe capital-gains tax (a 1031 exchange can defer both). Figures are a year-1 estimate at your 24.0% rate — not tax advice; consult a CPA.
Schools (NCES district)
- District
- Flippin School District
- NCES district ID
- 0506150
- Math proficiency
- 34% ▼ -13.00%
- Reading proficiency
- 30% ▼ -12.00%
- Median HH income
- $35,855
- Composite
- 26.54/100
- National rank
- #7194
- State rank
- #143 of 238 in AR
Livability — Bull Shoals
- Score
- 67/100
- State rank
- #92
- US rank
- #10104
Category grades
Schools grade is shown separately in the Schools card above.
Census & demographics
- Census place
- Bull Shoals, AR
- City population
- 1,671
- Population (ZIP)
- 1,671
Population outlook (Marion County) Hauer SSP2
- Today (2025)
- 14,979 people
- By 2030
- 14,153 · -5.5%
- By 2040
- 12,546 · -16.2%
- By 2050
- 11,386 · -24.0%
- By 2075
- 9,663 · -35.5%
- By 2100
- 8,248 · -44.9%
Race, ethnicity, and origin ACS 2023
- Neighborhood character
- Predominantly White (91%)
- Race & ethnicity
- White 91% Asian 4% Hispanic / Latino 2% Two or more races 2%
- Common ancestry
- Lithuanian 5% Romanian 3% Italian 3%
- Foreign-born
- 4% · China, Canada
- Languages at home
- 97% English-only · Other Asian/Pacific 2% Russian/Polish/Slavic 1%
Political lean MEDSL · Marion
- 2024 margin
- Solid R (+60.2) · D 19.1% · R 79.3% · Other 1.5%
- 2008→2024 swing
- -30.3pp toward R · 2008: -29.9pp · 2024: -60.2pp
- All cycles
- 2024: R+60.2 2020: R+56.7 2016: R+55.1 2012: R+39.1 2008: R+29.9
Not yet ingested
- Civics
- —
Market trends
- HPI YoY
- ▼ -47.66%
- Current HPI
- 168.1902
- Rent YoY
- —
- Metro
- —
- State GDP YoY
- ▲ 3.80%
- F500 in state
- 10
Industry mix (Fortune 500 HQ in AR)
| Industry | F500 HQs | Revenue |
|---|---|---|
| Retail | 1 | $681B |
|
||
| Food / Agriculture | 1 | $53B |
|
||
| Retail / Energy | 1 | $22B |
|
||
| Transportation / Logistics | 1 | $12B |
|
||
| Energy | 1 | $4B |
|
||
Price history
+0.0% since first listed4 events — show timeline
- 2026-06-09 Listed $20,000 MHMLS
- 2016-11-14 Sold (MLS) $15,000 MHMLS
- 2016-11-10 Sold (Public Records) $15,000 Public Records
- 2016-11-02 Listed $20,000 MHMLS
Property tax history
-9.7%/yrLatest (2025): $131 · +0.0% YoY. Source: county tax records.
Cash-flow waterfall
monthlySold comps — $/sqft
last 12 mo · ≤1 miLoading sold comps…