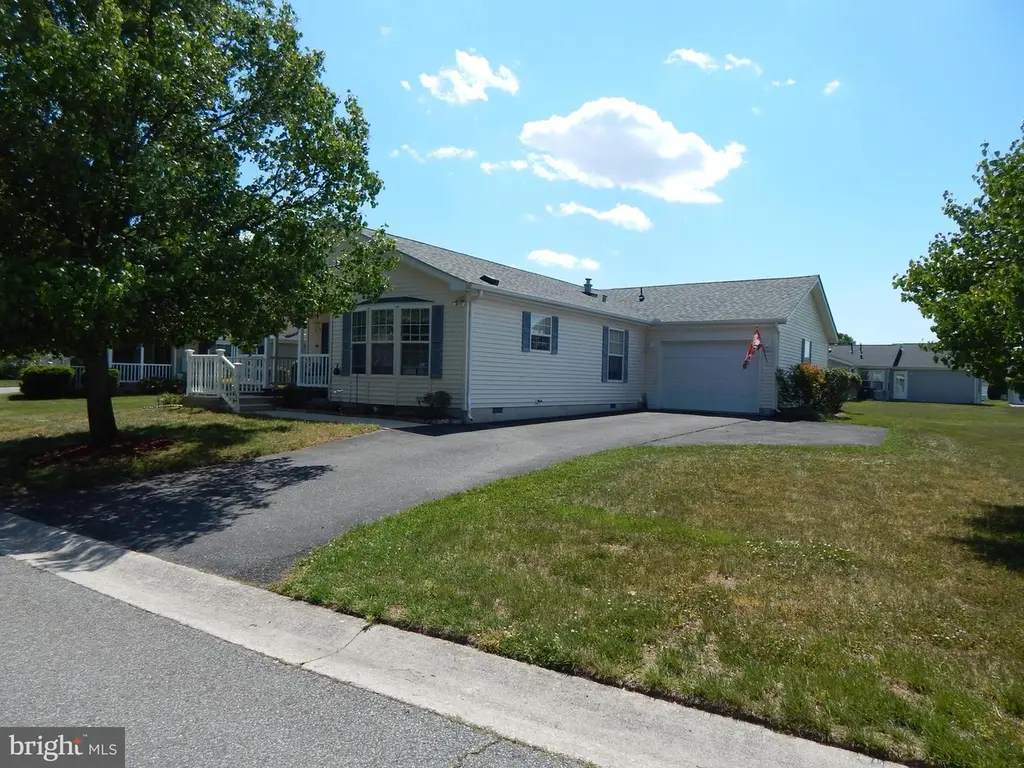
537 Weaver Dr #537 · Dover, DE
Flood risk No data
- FEMA flood zone
- —
- Chance of flooding over 30 yrs
- —
- Est. flood insurance / yr
- —
Fire risk No data
- Est. fire insurance / yr
- —
Heat risk No data
- Hot days now (above threshold)
- —
- Hot days in 30 yrs
- —
Wind risk No data
- Chance of severe wind over 30 yrs
- —
Air-quality risk No data
- Unhealthy air days now
- —
- Unhealthy air days in 30 yrs
- —
Risk factors via First Street. Map © Google.
Why this score? — see what drove the C+ grade
The composite is a weighted blend of 9 inputs, each scored 0–100. Each bar is that input's sub-score; the figure is the points it added to the 100-point composite (weight × sub-score).
- Cash flow +25.0/30.0
- ARV discount +10.9/15.0
- DSCR +8.2/10.0
- 1% rule +6.5/10.0
- Livability +3.4/5.0
- Rent growth +3.0/5.0
- Condition / age +2.8/5.0
- Schools +2.0/10.0
- Appreciation +0.0/10.0
$139,900
🖨 Deal sheet (PDF) 📄 Offer letter ✓ Due diligence
Listing remarks
Sharp and tidy 2 Bedroom / 2 Full bath home in the Senior community of Wild Meadows with attached garage with extra wide driveway space for ample parking for friends and family. Extra room with side entrance for a den, office or craft / hoobies. Lot rent includes freedom from lawn care and full access to community amenities: clubhouse, heated pool, hot tub, fitness center, , bocce, horseshoes, or safe exercise walks around the over 55 neighborhood. Buyer must be approved by Wild Meadows / RHP Landowner.
Key facts
- Garage
- Community pool
- Built 2005
Property features AI
Finance
- Other: Ownership interest: Land lease
- HOA & community: HOA fee $10 annually; Land lease $753.88 monthly (approximately 2 years remaining)
Exterior
- Parking: Attached 1-car garage with side entry and inside access; Driveway; On-street parking
- Utilities: Public water; Public sewer
- Home design: Manufactured home; Located in a senior community (55+)
- Construction: Block and vinyl siding exterior
- Exterior features: Community pool; Lot dimensions recorded by assessor
Interior
- Bedrooms: Two main-level bedrooms
- Bathrooms: Two full bathrooms (both on the main level)
- Heating & cooling: 90% forced-air heating; Natural gas heating and hot water; Central air conditioning (electric)
- Interior features: No basement; Finished living area per assessor
Neighborhood map
What this means for you Summary
Snapshot
- This is a 2-bed/2.0-bath single-family listed at $140k. Condition is rated average.
Deal economics
- At list price, monthly cash flow is $306 ($4k/yr) — positive.
- The deal already cash-flows at list — no discount required.
- Meets the 1% rule at list price ($2k rent vs $140k).
- Recommended offer: $136k (3.0% below list) — sets the bar for market timing.
- Cap rate 8.9% vs local median 5.2% in Dover — top-decile yield for the area; either an underpriced asset or a hidden risk that comps aren't pricing in. Stress-test before assuming the spread holds.
Location & tenants
- Location reads 67/100 on livability (#38 in DE) — a middle-class / working-renter tenant base. Strengths: amenities A+, cost of living A+, housing A+; Watch: schools C-, crime F, commute F.
- Capital School District (urban): math 14% / reading 31% proficiency, ranked #24 of 26 in DE (top 92%) — low school quality limits family demand, transient renter base, plan for 1-2y turnover.
- Market conditions: Rents rising (+2.0%/yr); 184 active listings in the ZIP; 5 comparable units currently listed for rent nearby; rentals lingering (median 45d on market — plan ~5-8 weeks vacancy on turnover, expect pricing pressure); 100% of comp listings sitting > 30 days — soft ceiling on asking rent; 1,201 units permitted in Kent County in 2024 (116 in 5+ unit buildings).
Forward outlook
- Local home prices are declining (-3.0%/yr); year-one equity from $967 of loan paydown is wiped out by about $4k of value loss. Plan a longer hold.
- Kent County population projected at +22% by 2050 — long-run rental-demand tailwind backs the buy-and-hold thesis.
Negotiation context
- It's been on market 40 days — a 3% lower offer ($136k) is reasonable based on typical stale-listing flexibility.
Questions for the listing agent
- It's been on market 40 days. Have you received any prior offers? Is the seller open to a 3% concession, seller financing, or rate buy-down credit?
- What does the HOA fee cover, when was the last increase, and are there any pending special assessments or reserve-fund shortfalls?
- Is there a deadline driving the sale (1031 exchange, divorce, estate, relocation)? That informs how much negotiation room exists.
- Crime grade is F in this area — have there been break-ins, vandalism, or insurance claims at this property in the last 3 years? What carrier currently insures it and at what premium?
- What's the average days-on-market for RENTAL listings here right now (not sales)? A rising rental-DOM trend means longer vacancies and softer asking-rent achievability than the comps imply.
- What's the recent tenant-quality profile in this submarket — average credit score on applications, eviction rate, late-payment / NSF rate, and stable-employment percentage? A property-management company in the area should have these aggregated.
- How much new for-sale + rental construction is in the pipeline within 1–3 miles? Heavy new supply typically softens prices + rents 12–24 months out; constrained supply supports both.
Investment metrics
- 1% rule
- 1.15% ✓
- Cap rate
- 8.91%
- Cash-on-cash
- 9.36%
- DSCR
- 1.42
- GRM
- 7.2
CMA / ARV
- ARV (median comp)
- $151,350
- List price
- $139,900
- Delta
- -7.57%
- Verdict
- FAIR
- Comps
- 20 within 1.0 mi
Show comp detail 12 sales within ~0.75 mi
| Address | Dist | Beds/Ba | Sqft | Sold | Price | $/sf | Match |
|---|---|---|---|---|---|---|---|
| 106 Kurt Dr #106 | 0.12mi | 2/2.0 | 1,408 (0%) | 6mo | $120,000 | $85 | 90 |
| 549 Weaver Dr #549 | 0.11mi | 2/2.0 | 1,408 (0%) | 8mo | $115,000 | $82 | 88 |
| 710 Mcginnis Dr #710 | 0.06mi | 3/2.0 (+1) | 1,350 (-4%) | 7mo | $125,000 | $93 | 79 |
| 311 W Persimmon Cir W #311 | 0.18mi | 2/2.0 | 1,514 (+8%) | 0mo | $138,000 | $91 | 79 |
| 914 Jonathan Dr #914 | 0.13mi | 3/2.0 (+1) | 1,350 (-4%) | 4mo | $169,500 | $126 | 79 |
| 222 Persimmon Cir W #222 | 0.19mi | 3/2.0 (+1) | 1,408 (0%) | 9mo | $131,000 | $93 | 79 |
| 425 Moore Pl #425 | 0.21mi | 3/2.0 (+1) | 1,296 (-8%) | 2mo | $124,000 | $96 | 70 |
| 322 Persimmon Cir W #322 | 0.23mi | 3/2.0 (+1) | 1,296 (-8%) | 3mo | $125,000 | $96 | 68 |
| 51 Karen Pl | 0.37mi | 3/2.0 (+1) | 1,344 (-4%) | 4mo | $235,000 | $175 | 67 |
| 56 Primrose Dr E | 0.40mi | 3/2.0 (+1) | 1,512 (+7%) | 1mo | $223,000 | $147 | 64 |
| 19 Karen Pl | 0.31mi | 3/2.0 (+1) | 1,248 (-11%) | 2mo | $208,000 | $167 | 60 |
| 206 Persimmon Cir | 0.34mi | 3/2.0 (+1) | 1,512 (+7%) | 10mo | $215,000 | $142 | 58 |
Match score weights: distance 35% · size 25% · config 20% · recency 20%. Top-matched comps best support the ARV.
Projected returns pro-forma
-3.0% appreciation · 2.03% rent growth · sell at horizon
- IRR
- -3.3%
- Equity multiple
- 0.88×
- Total profit
- $-4,744
- Equity at exit
- $20,860
- IRR
- 5.3%
- Equity multiple
- 1.38×
- Total profit
- $14,757
- Equity at exit
- $12,096
Cash invested: $39,172 (down + closing). Projections, not guarantees.
Landlord ↔ Tenant lean methodology
- Overall (STATE)
- 70 Landlord-Friendly
- State Delaware
- 70 Landlord-Friendly · D+7
- County
- — inherits STATE
- City
- — inherits STATE
ZIP-level market 19901
- Rents YoY
- 2.0%
- Active inventory
- 184
- Price-to-rent
- 7.2×
Monthly cashflow live
- Estimated rent
- $1,612 high interval (Pro) →
- Mortgage (P&I)
- −$734
- Tax est. 1.5%
- −$175 /mo · $2,098/yr
- Insurance
- −$58
- HOA
- −$1
- Vacancy / Maint / Mgmt
- −$338
- Net cashflow
- $306
Break-even live
Sensitivity live
| Price | -10% $402 | -5% $354 | +0% $306 | +5% $257 | +10% $209 |
|---|---|---|---|---|---|
| Rent | -10% $178 | -5% $242 | +0% $306 | +5% $369 | +10% $433 |
| Rate | -1.0pp $376 | -0.5pp $341 | base $306 | +0.5pp $269 | +1.0pp $232 |
UW: 25.0% down · 7.5% · 30yr · 1.5% tax · 5.0% vac · 8.0% maint · 8.0% mgmt
Financing live
Cash to close
- Down payment
- $34,975
- Closing costs
- $4,197
- Reserves months
- —
- Total cash needed
- —
Loan-product check · same deal, 3 products live
Conventional
25% down · 7.5% · 30yr
- Down + closing
- —
- Monthly P&I
- —
- Monthly cashflow
- —
- DSCR
- —
- Eligible?
- —
Personal DTI + credit; lowest rate.
DSCR
20% down · 8.5% · 30yr
- Down + closing
- —
- Monthly P&I
- —
- Monthly cashflow
- —
- DSCR
- —
- Eligible?
- —
No personal income docs; deal must DSCR.
Hard money
10% down · 12.0% · 12mo
- Down + closing
- —
- Monthly P&I
- —
- Monthly cashflow
- —
- DSCR
- —
- Eligible?
- —
Short-term bridge; refi at stabilization.
Rent comps 5 comps
| Address | Beds | Baths | Sqft | Rent | $/sqft | DOM | Units | Dist |
|---|---|---|---|---|---|---|---|---|
| 500 Persimmon Tree Ln Dover, DE | 2.0 | 2.0 | 940 | $1,477 | $1.57 | 44d | 1 | 0.31mi |
| 6000 Winners Cir Dover, DE | 2.0 | 2.0 | 1269 | $1,920 | $1.51 | 44d | 10 | 1.17mi |
| 820 Carvel Dr Dover, DE | 1.0–2.0 | 1.0–1.5 | 782 | $1,435 | $1.83 | 44d | 12 | 1.23mi |
| 91 Chatham Ct Dover, DE | 2.0 | 2.5 | 1530 | $1,750 | $1.14 | 44d | 1 | 1.31mi |
| 177 Willis Rd Dover, DE | 1.0–2.0 | 1.0 | 851 | $1,605 | $1.88 | 44d | 27 | 1.37mi |
HOA detail
- Monthly dues
- $1 · $12/yr
- Likely covers
- landscapingpoolgym
Listing history 17 events
-
2026-06-19days on market $139,900 Active 40 DOM
-
2026-06-18days on market $139,900 Active 39 DOM
-
2026-06-17days on market $139,900 Active 38 DOM
-
2026-06-16days on market $139,900 Active 37 DOM
-
2026-06-15days on market $139,900 Active 36 DOM
-
2026-06-14days on market $139,900 Active 34 DOM
-
2026-06-13days on market $139,900 Active 33 DOM
-
2026-06-10days on market $139,900 Active 31 DOM
-
2026-06-09days on market $139,900 Active 30 DOM
-
2026-06-08days on market $139,900 Active 29 DOM
-
2026-06-07days on market $139,900 Active 28 DOM
-
2026-06-02days on market $139,900 Active 23 DOM
-
2026-06-01days on market $139,900 Active 22 DOM
-
2026-05-31days on market $139,900 Active 21 DOM
-
2026-05-30days on market $139,900 Active 20 DOM
-
2026-05-11$139,900 Active 508-char remark
-
2026-05-10historical $139,900 508-char remark
ⓘ Source: listings_history table (triggers on properties + properties_extension) + one-shot
backfill from property_details.listing_events for pre-trigger history.
Nearby sold comps map
Loading sold comps map…
Walkable amenities ~0.75 mi
Loading nearby amenities…
Taxation est. · year 1
- Rental income
- $19,342
- − Mortgage interest
- −$7,837
- − Property taxes
- −$2,098
- − Insurance
- −$700
- − Repairs & maintenance
- −$1,547
- − Management
- −$1,547
- − HOA
- −$12
- − Depreciation
- −$4,070
- Taxable income
- $1,531
- Est. tax owed @ 24.0%
- −$367
- After-tax cash flow
- $3,299/yr
For passive investors: Depreciation is non-cash, so a rental often shows a tax loss while cash-flowing — sheltering income. Rental losses are passive: they offset passive income freely, and up to $25,000/yr can offset ordinary (W-2) income if you actively participate and your MAGI is under $100k (phasing out to $0 by $150k); unused losses carry forward. On sale, claimed depreciation is recaptured at up to 25%, and gains may owe capital-gains tax (a 1031 exchange can defer both). Figures are a year-1 estimate at your 24.0% rate — not tax advice; consult a CPA.
Condition & rehab AI · 13 photos
This home is in average condition with some cosmetic updates needed to improve its curb appeal and interior spaces. The home is move-in ready with a few minor repairs and maintenance items to address.
Repairs flagged
- Minor Kitchen cabinets — Worn and dated appearance.
- Minor Bathtub and sink — Appears functional but dated and in need of cleaning.
- Minor Exterior paint — Siding appears intact but could benefit from a fresh coat of paint.
- Minor Living room carpet — Worn appearance and could be replaced with a more modern option.
- Minor Bedroom carpet — Worn appearance and could be replaced with a more modern option.
- Minor Paint — Paint appears faded in some areas and could be refreshed with a fresh coat.
Value-add opportunities
- Both Paint exterior siding — Fresh paint can improve curb appeal and home value.
- Both Replace living room carpet — Modern carpet can improve the look and feel of the living space.
- Both Replace bedroom carpet — Modern carpet can improve the look and feel of the bedrooms.
- Both Paint interior walls — Fresh paint can improve the look and feel of the interior spaces.
- Both Replace kitchen cabinets — Modern cabinets can improve the look and feel of the kitchen and increase the home's value.
- Both Replace bathtub and sink — A new, more modern bathtub and sink can improve the look and feel of the bathroom and increase the home's value.
Renovation cost estimate screening
| Repair item | Severity | Est. cost |
|---|---|---|
| Kitchen cabinets · Worn and dated appearance. | Minor | $500–3,000 |
| Bathtub and sink · Appears functional but dated and in need of cleaning. | Minor | $500–3,000 |
| Exterior paint · Siding appears intact but could benefit from a fresh coat of paint. | Minor | $500–3,000 |
| Living room carpet · Worn appearance and could be replaced with a more modern option. | Minor | $500–3,000 |
| Bedroom carpet · Worn appearance and could be replaced with a more modern option. | Minor | $500–3,000 |
| Paint · Paint appears faded in some areas and could be refreshed with a fresh coat. | Minor | $500–3,000 |
| Total estimated repair cost · 6 items | $3,000–18,000 |
Value-add ROI direction
- Both Paint exterior siding — Fresh paint can improve curb appeal and home value. ↑
- Both Replace living room carpet — Modern carpet can improve the look and feel of the living space. ↑
- Both Replace bedroom carpet — Modern carpet can improve the look and feel of the bedrooms. ↑
- Both Paint interior walls — Fresh paint can improve the look and feel of the interior spaces. ↑
- Both Replace kitchen cabinets — Modern cabinets can improve the look and feel of the kitchen and increase the home's value. ↑
- Both Replace bathtub and sink — A new, more modern bathtub and sink can improve the look and feel of the bathroom and increase the home's value. ↑
ⓘ Cost ranges are severity-bucket heuristics (US national rule-of-thumb). Get contractor quotes + a written scope before underwriting a rehab budget.
Schools (NCES district)
- District
- Capital School District
- NCES district ID
- 1000190
- Math proficiency
- 14% ▼ -17.00%
- Reading proficiency
- 31% ▼ -12.00%
- Median HH income
- $48,499
- Composite
- 19.78/100
- National rank
- #8703
- State rank
- #24 of 26 in DE
Livability — Dover
- Score
- 67/100
- State rank
- #38
- US rank
- #10574
Category grades
Schools grade is shown separately in the Schools card above.
Census & demographics
- Census place
- Dover, DE
- County
- Kent County · 82,184 people
- Metro
- Dover, DE
- Population (ZIP)
- 37,763
- Household income
- $66,388
- Rent vs Own
- Severe rent burden
- 1320.0
Population outlook (Kent County) Hauer SSP2
- Today (2025)
- 194,477 people
- By 2030
- 204,351 · +5.1%
- By 2040
- 222,135 · +14.2%
- By 2050
- 236,483 · +21.6%
- By 2075
- 266,327 · +36.9%
- By 2100
- 275,335 · +41.6%
Race, ethnicity, and origin ACS 2023
- Neighborhood character
- Diverse neighborhood (Simpson 0.68)
- Race & ethnicity
- White 44% Black 34% Hispanic / Latino 13% Two or more races 11% Asian 2%
- Hispanic origin (detail)
- Mexican 3% Puerto Rican 6%
- Common ancestry
- Romanian 2% Hispanic 1% Lithuanian 1%
- Foreign-born
- 7% · Canada, South Korea
- Languages at home
- 88% English-only · Spanish 7% French/Haitian/Cajun 1% Other Asian/Pacific 1%
Political lean MEDSL · Kent
- 2024 margin
- Toss-up / Even · D 50.2% · R 48.2% · Other 1.7%
- 2008→2024 swing
- -7.8pp toward R · 2008: 9.8pp · 2024: 2.0pp
- All cycles
- 2024: D+2.0 2020: D+4.1 2016: R+4.9 2012: D+4.9 2008: D+9.8
Not yet ingested
- Civics
- —
Market trends
- HPI YoY
- ▼ -113.29%
- Current HPI
- 199.5132
- Rent YoY
- ▲ 2.03%
- Metro
- Dover, DE
- State GDP YoY
- —
- F500 in state
- 0
Price history
+0.0% since first listed2 events — show timeline
- 2026-05-11 Listed $139,900 BRIGHT MLS
- 2026-05-10 Coming Soon $139,900 BRIGHT MLS
Cash-flow waterfall
monthlySold comps — $/sqft
last 12 mo · ≤1 miLoading sold comps…