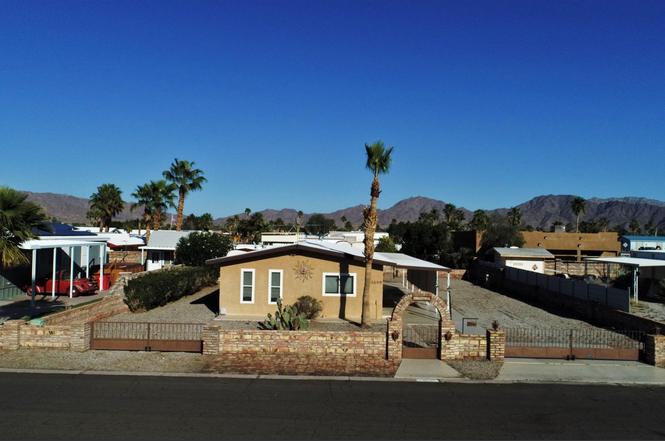
12699 S Montana Ave · Fortuna Foothills, AZ
Flood risk 1/10 · Minimal
- FEMA flood zone
- X (shaded)
- Chance of flooding over 30 yrs
- 0.0%
- Est. flood insurance / yr
- $507 – $1,088
Fire risk 4/10 · Minor
- Est. fire insurance / yr
- $610 – $1,132
Heat risk 9/10 · Severe
- Hot days now (above 113°F)
- 5 days/yr
- Hot days in 30 yrs
- 13 days/yr
Wind risk 1/10 · Minimal
- Chance of severe wind over 30 yrs
- —
Air-quality risk 2/10 · Minimal
- Unhealthy air days now
- 1 days/yr
- Unhealthy air days in 30 yrs
- 2 days/yr
Risk factors via First Street. Map © Google.
Why this score? — see what drove the C+ grade
The composite is a weighted blend of 9 inputs, each scored 0–100. Each bar is that input's sub-score; the figure is the points it added to the 100-point composite (weight × sub-score).
- Cash flow +25.2/30.0
- ARV discount +14.1/15.0
- DSCR +8.3/10.0
- 1% rule +5.3/10.0
- Rent growth +3.6/5.0
- Livability +3.0/5.0
- Condition / age +2.5/5.0
- Schools +1.3/10.0
- Appreciation +0.0/10.0
$155,000
🖨 Deal sheet 📄 Offer letter ✓ Due diligence
Listing remarks
Move-in ready 3 bedroom, 2 bath mobile home with a 720 sq ft addition on a 7400sqft lot, offering spacious living areas throughout. The home features an eat-in kitchen with breakfast bar and pantry, good-sized bedrooms, and newer windows for improved comfort and efficiency. Outside you’ll find RV access with hookups, plus a large storage shed and workshop for extra space and projects. Conveniently located in the Foothills
Key facts
- Pantry
- Rv access
- Storage shed
Tags
Property features AI
Exterior
- Parking: RV access/parking
- Utilities: Public water; Septic tank
- Home design: Manufactured home; Residential property
- Construction: Mobile home / manufactured construction
- Exterior features: RV hookup; Covered patio; Patio; Sliding doors; Workshop; Shed(s); Paved road access
Interior
- Kitchen: Refrigerator; Dishwasher; Electric range
- Flooring: Other
- Bathrooms: 1 full bathroom; 1 three-quarter bathroom
- Heating & cooling: Has heating; Has cooling
- Interior features: Double pane windows; Water softener (owned); Water purifier
- Laundry & utility: Washer; Dryer
Neighborhood map
What this means for you Summary
Snapshot
- This is a 3-bed/2.0-bath manufactured listed at $155k.
Deal economics
- At list price, monthly cash flow is $348 ($4k/yr) — positive.
- The deal already cash-flows at list — no discount required.
- Meets the 1% rule at list price ($2k rent vs $155k).
- Recommended offer: $141k (9.0% below list) — sets the bar for market timing.
- Cap rate 9.0% vs local median 4.2% in Fortuna Foothills — top-decile yield for the area; either an underpriced asset or a hidden risk that comps aren't pricing in. Stress-test before assuming the spread holds.
Location & tenants
- Location reads 60/100 on livability (#174 in AZ) — a middle-class / working-renter tenant base. Strengths: cost of living A+, housing A+; Watch: employment C-, schools F, crime F.
- Yuma Union High School District (4507) (urban): math 14% / reading 16% proficiency, ranked #212 of 249 in AZ (top 85%) — low school quality limits family demand, transient renter base, plan for 1-2y turnover.
- Market conditions: Rents rising fast (+4.5%/yr); 413 active listings in the ZIP; 1,399 units permitted in Yuma County in 2024 (180 in 5+ unit buildings).
- This rent runs 33% of the median local income ($58k/yr) — at the standard rent-burdened threshold; future hikes will face affordability resistance.
Forward outlook
- Local home prices are declining (-3.0%/yr); year-one equity from $1k of loan paydown is wiped out by about $5k of value loss. Plan a longer hold.
- Yuma County population projected at +4% by 2050 — modest demand growth; plan on rents tracking national, not racing it.
- At projected returns (-3.0% appreciation + 4.5% rent growth), your $43k cash investment doubles in ~10 years — after that, you're playing with house money.
Negotiation context
- It's been on market 99 days — a 9% lower offer ($141k) is reasonable based on typical stale-listing flexibility.
- Current owner paid $66k; list at $155k implies a 135% gain — meaningful room to come down on a strong offer.
Risks & watch-outs
- Climate carrying-cost: extreme-heat days projected 5→13/yr by 2055 (HVAC capex compounding) — expect insurance premiums to compound above CPI over the hold.
Questions for the listing agent
- It's been on market 99 days. Have you received any prior offers? Is the seller open to a 9% concession, seller financing, or rate buy-down credit?
- Built in 1972 — when were the roof, HVAC, electrical panel, plumbing, and water heater last replaced?
- Why hasn't it sold? Are there any deal-killer items the seller is aware of (foundation, flood, title, zoning, code violations)?
- Is there a deadline driving the sale (1031 exchange, divorce, estate, relocation)? That informs how much negotiation room exists.
- Schools are F-rated, which usually means shorter tenancies and higher turnover. Who's the typical renter profile here, and what's been the actual vacancy rate?
- Crime grade is F in this area — have there been break-ins, vandalism, or insurance claims at this property in the last 3 years? What carrier currently insures it and at what premium?
- What's the average days-on-market for RENTAL listings here right now (not sales)? A rising rental-DOM trend means longer vacancies and softer asking-rent achievability than the comps imply.
- What's the recent tenant-quality profile in this submarket — average credit score on applications, eviction rate, late-payment / NSF rate, and stable-employment percentage? A property-management company in the area should have these aggregated.
- How much new for-sale + rental construction is in the pipeline within 1–3 miles? Heavy new supply typically softens prices + rents 12–24 months out; constrained supply supports both.
Investment metrics
- 1% rule
- 1.03% ✓
- Cap rate
- 8.98%
- Cash-on-cash
- 9.61%
- DSCR
- 1.43
- GRM
- 8.1
CMA / ARV
- ARV (on-the-fly)
- $181,440
- Comps found
- 12
Show comp detail 12 sales within ~0.75 mi
| Address | Dist | Beds/Ba | Sqft | Sold | Price | $/sf | Match |
|---|---|---|---|---|---|---|---|
| 13564 E 47 Dr | 0.23mi | 2/2.0 (-1) | 769 (+7%) | 3mo | $179,900 | $234 | 71 |
| 13592 E 46 St | 0.26mi | 2/1.0 (-1) | 718 (-0%) | 10mo | $125,000 | $174 | 70 |
| 12595 S Joleane Ave | 0.14mi | 2/1.5 (-1) | 784 (+9%) | 4mo | $185,000 | $236 | 68 |
| 13729 E 49 Dr | 0.56mi | 2/1.5 (-1) | 721 (+0%) | 2mo | $195,000 | $270 | 66 |
| 13609 E 50 St | 0.53mi | 2/1.5 (-1) | 735 (+2%) | 2mo | $185,000 | $252 | 63 |
| 13458 E 48 Dr | 0.24mi | 2/2.0 (-1) | 660 (-8%) | 8mo | $141,000 | $214 | 63 |
| 13388 E 48 Dr | 0.23mi | 2/2.0 (-1) | 637 (-12%) | 5mo | $185,400 | $291 | 61 |
| 13420 E 44 St | 0.33mi | 2/1.0 (-1) | 768 (+7%) | 6mo | $170,000 | $221 | 59 |
| 13249 E 42 St | 0.56mi | 2/2.5 (-1) | 700 (-3%) | 5mo | $210,000 | $300 | 58 |
| 12694 E 47 St | 0.62mi | 3/2.0 | 771 (+7%) | 8mo | $230,000 | $298 | 53 |
| 13815 E 48 Dr | 0.59mi | 2/1.0 (-1) | 784 (+9%) | 6mo | $189,900 | $242 | 44 |
| 12623 E 45 St | 0.73mi | 2/1.5 (-1) | 616 (-14%) | 8mo | $158,000 | $256 | 28 |
Match score weights: distance 35% · size 25% · config 20% · recency 20%. Top-matched comps best support the ARV.
Projected returns pro-forma
-3.0% appreciation · 4.46% rent growth · sell at horizon
- IRR
- -0.4%
- Equity multiple
- 0.98×
- Total profit
- $-656
- Equity at exit
- $23,111
- IRR
- 10.6%
- Equity multiple
- 1.87×
- Total profit
- $37,740
- Equity at exit
- $13,402
Cash invested: $43,400 (down + closing). Projections, not guarantees.
Landlord ↔ Tenant lean methodology
- Overall (STATE)
- 87 Strongly Landlord-Friendly
- State Arizona
- 87 Strongly Landlord-Friendly · R+3
- County
- — inherits STATE
- City
- — inherits STATE
ZIP-level market 85367
- Home prices YoY
- -26.2%
- Rents YoY
- 4.5%
- Active inventory
- 413
- Price-to-rent
- 8.1×
Monthly cashflow live
- Estimated rent
- $1,600 medium interval (Pro) →
- Mortgage (P&I)
- −$813
- Tax from tax record
- −$39 /mo · $470/yr
- Insurance
- −$65
- HOA
- −$0
- Vacancy / Maint / Mgmt
- −$336
- Net cashflow
- $348
Break-even live
Sensitivity live
| Price | -10% $435 | -5% $392 | +0% $348 | +5% $304 | +10% $260 |
|---|---|---|---|---|---|
| Rent | -10% $221 | -5% $285 | +0% $348 | +5% $411 | +10% $474 |
| Rate | -1.0pp $426 | -0.5pp $387 | base $348 | +0.5pp $308 | +1.0pp $267 |
UW: 25.0% down · 7.5% · 30yr · 1.5% tax · 5.0% vac · 8.0% maint · 8.0% mgmt
Financing live
Cash to close
- Down payment
- $38,750
- Closing costs
- $4,650
- Reserves months
- —
- Total cash needed
- —
Loan-product check · same deal, 3 products live
Conventional
25% down · 7.5% · 30yr
- Down + closing
- —
- Monthly P&I
- —
- Monthly cashflow
- —
- DSCR
- —
- Eligible?
- —
Personal DTI + credit; lowest rate.
DSCR
20% down · 8.5% · 30yr
- Down + closing
- —
- Monthly P&I
- —
- Monthly cashflow
- —
- DSCR
- —
- Eligible?
- —
No personal income docs; deal must DSCR.
Hard money
10% down · 12.0% · 12mo
- Down + closing
- —
- Monthly P&I
- —
- Monthly cashflow
- —
- DSCR
- —
- Eligible?
- —
Short-term bridge; refi at stabilization.
Listing history 20 events
-
2026-06-19days on market $155,000 Active 99 DOM
-
2026-06-18days on market $155,000 Active 98 DOM
-
2026-06-17days on market $155,000 Active 97 DOM
-
2026-06-16days on market $155,000 Active 96 DOM
-
2026-06-15days on market $155,000 Active 95 DOM
-
2026-06-14days on market $155,000 Active 93 DOM
-
2026-06-13days on market $155,000 Active 92 DOM
-
2026-06-10days on market $155,000 Active 90 DOM
-
2026-06-09days on market $155,000 Active 89 DOM
-
2026-06-09price $155,000 Active 88 DOM
-
2026-06-08days on market $175,000 Active 88 DOM
-
2026-06-07days on market $175,000 Active 87 DOM
-
2026-06-05days on market $175,000 Active 84 DOM
-
2026-06-02days on market $175,000 Active 82 DOM
-
2026-06-01days on market $175,000 Active 81 DOM
-
2026-05-31days on market $175,000 Active 80 DOM
-
2026-05-30days on market $175,000 Active 79 DOM
-
2026-03-12$175,000 Active
-
2003-04-21soldstatus $66,000
-
1982-06-14soldstatus $7,295
ⓘ Source: listings_history table (triggers on properties + properties_extension) + one-shot
backfill from property_details.listing_events for pre-trigger history.
Tax reassessment forecast AZ · Resets to sale price
- Current annual tax
- $470 · $39/mo
- Projected year-2 tax
- $1,023 · $85/mo
- Expected delta
- +$553/yr (+$46/mo · 117.8%)
ⓘ Screening estimate from a state-policy table — verify with the county assessor before closing.
Climate risk First Street
- Flood 1/10 Low FEMA zone X (shaded) · 0% chance over 30 yrs
- Wildfire 4/10 Moderate
- Heat 9/10 Extreme 5 d/yr ≥113°F today · 13 d/yr by 30 yrs out
- Wind 1/10 Low
- Air quality 2/10 Low 1 unhealthy d/yr today · 2 by 30 yrs out
Nearby sold comps map
Loading sold comps map…
Walkable amenities ~0.75 mi
Loading nearby amenities…
Taxation est. · year 1
- Rental income
- $19,204
- − Mortgage interest
- −$8,682
- − Property taxes
- −$470
- − Insurance
- −$775
- − Repairs & maintenance
- −$1,536
- − Management
- −$1,536
- − Depreciation
- −$4,509
- Taxable income
- $1,695
- Est. tax owed @ 24.0%
- −$407
- After-tax cash flow
- $3,766/yr
For passive investors: Depreciation is non-cash, so a rental often shows a tax loss while cash-flowing — sheltering income. Rental losses are passive: they offset passive income freely, and up to $25,000/yr can offset ordinary (W-2) income if you actively participate and your MAGI is under $100k (phasing out to $0 by $150k); unused losses carry forward. On sale, claimed depreciation is recaptured at up to 25%, and gains may owe capital-gains tax (a 1031 exchange can defer both). Figures are a year-1 estimate at your 24.0% rate — not tax advice; consult a CPA.
Schools (NCES district)
- District
- Yuma Union High School District (4507)
- NCES district ID
- 0409630
- Math proficiency
- 14% ▼ -12.00%
- Reading proficiency
- 16% ▼ -10.00%
- Median HH income
- $40,512
- Composite
- 12.86/100
- National rank
- #9592
- State rank
- #212 of 249 in AZ
Livability — Fortuna Foothills
- Score
- 60/100
- State rank
- #174
- US rank
- #18663
Category grades
Schools grade is shown separately in the Schools card above.
Census & demographics
- Census place
- Fortuna Foothills, AZ
- County
- Yuma County · 149,809 people
- City population
- 21,356
- Metro
- Yuma, AZ
- Population (ZIP)
- 22,074
- Household income
- $58,469
- Rent vs Own
- Severe rent burden
- 408.0
Population outlook (Yuma County) Hauer SSP2
- Today (2025)
- 211,633 people
- By 2030
- 214,114 · +1.2%
- By 2040
- 217,856 · +2.9%
- By 2050
- 220,276 · +4.1%
- By 2075
- 222,359 · +5.1%
- By 2100
- 198,880 · -6.0%
Race, ethnicity, and origin ACS 2023
- Neighborhood character
- Predominantly White (71%)
- Race & ethnicity
- White 71% Hispanic / Latino 22% Two or more races 11% Black 3%
- Hispanic origin (detail)
- Mexican 20%
- Common ancestry
- Portuguese 4% Lithuanian 2% Italian 2%
- Foreign-born
- 10% · Canada
- Languages at home
- 81% English-only · Spanish 16% French/Haitian/Cajun 1% German/W. Germanic 1%
Political lean MEDSL · Yuma
- 2024 margin
- Strong R (+20.4) · D 39.3% · R 59.8%
- 2008→2024 swing
- -6.6pp toward R · 2008: -13.8pp · 2024: -20.4pp
- All cycles
- 2024: R+20.4 2020: R+6.2 2016: R+5.5 2012: R+16.1 2008: R+13.8
Not yet ingested
- Civics
- —
Market trends
- HPI YoY
- ▼ -80.81%
- Current HPI
- 227.2692
- Rent YoY
- ▲ 4.46%
- Metro
- Yuma, AZ
- State GDP YoY
- ▲ 4.54%
- F500 in state
- 20
Industry mix (Fortune 500 HQ in AZ)
| Industry | F500 HQs | Revenue |
|---|---|---|
| Technology | 2 | $13B |
|
||
| Mining / Metals | 1 | $23B |
|
||
| Environmental Services | 1 | $16B |
|
||
| Metals / Steel | 1 | $14B |
|
||
| Technology Distribution | 1 | $9B |
|
||
| Homebuilding | 1 | $8B |
|
||
Price history
+2298.9% since first listed3 events — show timeline
- 2026-03-12 Listed $175,000 YAR
- 2003-04-21 Sold (Public Records) $66,000 Public Records
- 1982-06-14 Sold (Public Records) $7,295 Public Records
Property tax history
-4.7%/yrLatest (2025): $470 · +3.2% YoY. Source: county tax records.
Cash-flow waterfall
monthlySold comps — $/sqft
last 12 mo · ≤1 miLoading sold comps…