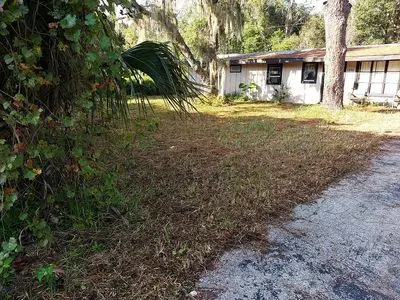
1090 N Fan Palm Pt · Crystal River, FL
Flood risk 10/10 · Severe
- FEMA flood zone
- AE
- Chance of flooding over 30 yrs
- 0.99%
- Est. flood insurance / yr
- $1,737 – $8,500
Fire risk 3/10 · Minor
- Est. fire insurance / yr
- $947 – $1,759
Heat risk 9/10 · Severe
- Hot days now (above 109°F)
- 7 days/yr
- Hot days in 30 yrs
- 25 days/yr
Wind risk 9/10 · Severe
- Chance of severe wind over 30 yrs
- 99.0%
Air-quality risk 1/10 · Minimal
- Unhealthy air days now
- 0 days/yr
- Unhealthy air days in 30 yrs
- 0 days/yr
Risk factors via First Street. Map © Google.
Why this score? — see what drove the D grade
The composite is a weighted blend of 9 inputs, each scored 0–100. Each bar is that input's sub-score; the figure is the points it added to the 100-point composite (weight × sub-score).
- Cash flow +15.0/30.0
- ARV discount +7.5/15.0
- 1% rule +5.0/10.0
- DSCR +5.0/10.0
- Schools +4.1/10.0
- Livability +3.3/5.0
- Rent growth +2.5/5.0
- Condition / age +2.5/5.0
- Appreciation +0.0/10.0
$28,000
🖨 Deal sheet 📄 Offer letter ✓ Due diligence
Listing remarks
House fire sale. This structure could be rebuilt or start over. Impact fees are paid, property has a well, septic field and slab. Nice quiet street with woods at rear leading to Plantation Golf course.
Key facts
- Quiet street
- Woods
- Slab
Tags
Neighborhood map
What this means for you Summary
Snapshot
- This is a 3-bed/2.0-bath single-family listed at $28k.
Deal economics
- At list price, monthly cash flow is $971 ($12k/yr) — positive.
- The deal already cash-flows at list — no discount required.
- Meets the 1% rule at list price ($2k rent vs $28k).
- Cap rate 66.2% vs local median 2.1% in Crystal River — top-decile yield for the area; either an underpriced asset or a hidden risk that comps aren't pricing in. Stress-test before assuming the spread holds.
Location & tenants
- Location reads 66/100 on livability (#603 in FL) — a middle-class / working-renter tenant base. Strengths: crime A+, cost of living A+; Watch: health & safety C-, schools D+, amenities F.
- Citrus (rural): math 49% / reading 50% proficiency, ranked #44 of 73 in FL (top 60%) — families likely to look elsewhere, expect single-tenant / working-renter base with shorter leases.
- Market conditions: 325 active listings in the ZIP; 4 comparable units currently listed for rent nearby; rentals at typical pace (median 21d on market — plan ~3-4 weeks tenant-placement turnaround); 2,443 units permitted in Citrus County in 2024 (0 in 5+ unit buildings).
Forward outlook
- Local home prices are declining (-3.0%/yr); year-one equity from $194 of loan paydown is wiped out by about $840 of value loss. Plan a longer hold.
- Citrus County population projected to shrink 10% by 2050 — rents likely to lag national; underwrite the cash flow, not the appreciation.
- At projected returns (-3.0% appreciation + 3.0% rent growth), your $8k cash investment doubles in ~1 year — after that, you're playing with house money.
Negotiation context
- Only 11 days on market — expect competitive offers; lowballing is unlikely to land.
- 4 sale attempts since 4y ago with the ask held roughly flat each time — persistent listings suggest the price (not the market) is what's stuck; bring a comps-based counter.
Risks & watch-outs
- Watch-outs: flood insurance adds $427/mo.
- Climate carrying-cost: in FEMA flood zone AE (mandatory federal flood insurance); severe wind risk, 99% chance of damaging wind over 30y; extreme-heat days projected 7→25/yr by 2055 (HVAC capex compounding) — expect insurance premiums to compound above CPI over the hold.
Questions for the listing agent
- Built in 1972 — when were the roof, HVAC, electrical panel, plumbing, and water heater last replaced?
- What's the actual annual flood-insurance premium (NFIP or private), and is the property in a SFHA with mandatory coverage?
- Is there a deadline driving the sale (1031 exchange, divorce, estate, relocation)? That informs how much negotiation room exists.
- Schools are D-rated, which usually means shorter tenancies and higher turnover. Who's the typical renter profile here, and what's been the actual vacancy rate?
- The area grade is low — what's the realistic commute time and amenity access for the typical tenant pool here? Any planned neighborhood developments (good or bad) we should know about?
- What's the average days-on-market for RENTAL listings here right now (not sales)? A rising rental-DOM trend means longer vacancies and softer asking-rent achievability than the comps imply.
- What's the recent tenant-quality profile in this submarket — average credit score on applications, eviction rate, late-payment / NSF rate, and stable-employment percentage? A property-management company in the area should have these aggregated.
- How much new for-sale + rental construction is in the pipeline within 1–3 miles? Heavy new supply typically softens prices + rents 12–24 months out; constrained supply supports both.
Investment metrics
- 1% rule
- 7.19% ✓
- Cap rate
- 66.18%
- Cash-on-cash
- 213.90%
- DSCR
- 10.52
- GRM
- 1.2
CMA / ARV
- ARV (on-the-fly)
- $153,216
- Comps found
- 7
Show comp detail 7 sales within ~0.75 mi
| Address | Dist | Beds/Ba | Sqft | Sold | Price | $/sf | Match |
|---|---|---|---|---|---|---|---|
| 1011 N Lajolla Pt | 0.12mi | 2/2.0 (-1) | 1,152 (0%) | 3mo | $147,000 | $128 | 87 |
| 1090 N Lajolla Pt | 0.05mi | 3/2.0 | 1,176 (+2%) | 18mo | $200,000 | $170 | 80 |
| 1135 N Fan Palm Pt | 0.05mi | 2/1.0 (-1) | 1,236 (+7%) | 13mo | $120,000 | $97 | 66 |
| 868 N Rhyme Pt | 0.71mi | 3/2.0 | 1,152 (0%) | 4mo | $105,000 | $91 | 63 |
| 1050 N Midiron Pt | 0.43mi | 3/2.0 | 1,020 (-12%) | 2mo | $200,000 | $196 | 60 |
| 1075 N Fan Palm Pt | 0.04mi | 2/2.0 (-1) | 980 (-15%) | 14mo | $130,000 | $133 | 57 |
| 950 N Appalachian Ter | 0.75mi | 3/2.0 | 1,248 (+8%) | 21mo | $247,500 | $198 | 34 |
Match score weights: distance 35% · size 25% · config 20% · recency 20%. Top-matched comps best support the ARV.
Projected returns pro-forma
-3.0% appreciation · 3.0% rent growth · sell at horizon
- IRR
- —
- Equity multiple
- 8.35×
- Total profit
- $57,594
- Equity at exit
- $4,175
- IRR
- —
- Equity multiple
- 17.70×
- Total profit
- $130,967
- Equity at exit
- $2,421
Cash invested: $7,840 (down + closing). Projections, not guarantees.
Landlord ↔ Tenant lean methodology
- Overall (STATE)
- 87 Strongly Landlord-Friendly
- State Florida
- 87 Strongly Landlord-Friendly · R+3
- County
- — inherits STATE
- City
- — inherits STATE
ZIP-level market 34429
- Home prices YoY
- -17.8%
- Active inventory
- 325
- Price-to-rent
- 1.2×
Monthly cashflow live
- Estimated rent
- $2,014 medium interval (Pro) →
- Mortgage (P&I)
- −$147
- Tax est. 1.5%
- −$35 /mo · $420/yr
- Insurance
- −$12
- Flood insurance flood zone
- −$427 /mo · $5,118/yr
- HOA
- −$0
- Vacancy / Maint / Mgmt
- −$423
- Net cashflow
- $971
Break-even live
UW: 25.0% down · 7.5% · 30yr · 1.5% tax · 5.0% vac · 8.0% maint · 8.0% mgmt
Financing live
Cash to close
- Down payment
- $7,000
- Closing costs
- $840
- Reserves months
- —
- Total cash needed
- —
Loan-product check · same deal, 3 products live
Conventional
25% down · 7.5% · 30yr
- Down + closing
- —
- Monthly P&I
- —
- Monthly cashflow
- —
- DSCR
- —
- Eligible?
- —
Personal DTI + credit; lowest rate.
DSCR
20% down · 8.5% · 30yr
- Down + closing
- —
- Monthly P&I
- —
- Monthly cashflow
- —
- DSCR
- —
- Eligible?
- —
No personal income docs; deal must DSCR.
Hard money
10% down · 12.0% · 12mo
- Down + closing
- —
- Monthly P&I
- —
- Monthly cashflow
- —
- DSCR
- —
- Eligible?
- —
Short-term bridge; refi at stabilization.
Rent comps 4 comps
| Address | Beds | Baths | Sqft | Rent | $/sqft | DOM | Units | Dist |
|---|---|---|---|---|---|---|---|---|
| 540 N Afterglow Cir Crystal River, FL | 3.0 | 2.0 | 1500 | $2,950 | $1.97 | 21d | 1 | 0.58mi |
| 493 N Sams Pt Crystal River, FL | 2.0 | 2.0 | 1000 | $1,300 | $1.30 | 21d | 1 | 1.16mi |
| 130 S Suncoast Blvd Crystal River, FL | 1.0–2.0 | 1.0 | 559 | $1,091 | $1.95 | 13d | 4 | 1.23mi |
| 450 N Elmwood Pt Crystal River, FL | 2.0 | 2.0 | 950 | $1,450 | $1.53 | 21d | 1 | 1.31mi |
Listing history 9 events
-
2026-06-19days on market $28,000 Active 11 DOM
-
2026-06-18days on market $28,000 Active 10 DOM
-
2026-06-17days on market $28,000 Active 9 DOM
-
2026-06-16days on market $28,000 Active 8 DOM
-
2026-06-15days on market $28,000 Active 7 DOM
-
2026-06-14days on market $28,000 Active 5 DOM
-
2026-06-13days on market $28,000 Active 4 DOM
-
2026-06-09remarks 201-char remark
-
2026-06-09$28,000 Active 1 DOM
ⓘ Source: listings_history table (triggers on properties + properties_extension) + one-shot
backfill from property_details.listing_events for pre-trigger history.
Climate risk First Street
- Flood 10/10 Extreme FEMA zone AE · 99% chance over 30 yrs
- Wildfire 3/10 Moderate
- Heat 9/10 Extreme 7 d/yr ≥109°F today · 25 d/yr by 30 yrs out
- Wind 9/10 Extreme 99% chance of damaging wind over 30 yrs
- Air quality 1/10 Low 0 unhealthy d/yr today · 0 by 30 yrs out
Nearby sold comps map
Loading sold comps map…
Walkable amenities ~0.75 mi
Loading nearby amenities…
Taxation est. · year 1
- Rental income
- $24,167
- − Mortgage interest
- −$1,568
- − Property taxes
- −$420
- − Insurance
- −$5,258
- − Repairs & maintenance
- −$1,933
- − Management
- −$1,933
- − Depreciation
- −$815
- Taxable income
- $12,238
- Est. tax owed @ 24.0%
- −$2,937
- After-tax cash flow
- $8,714/yr
For passive investors: Depreciation is non-cash, so a rental often shows a tax loss while cash-flowing — sheltering income. Rental losses are passive: they offset passive income freely, and up to $25,000/yr can offset ordinary (W-2) income if you actively participate and your MAGI is under $100k (phasing out to $0 by $150k); unused losses carry forward. On sale, claimed depreciation is recaptured at up to 25%, and gains may owe capital-gains tax (a 1031 exchange can defer both). Figures are a year-1 estimate at your 24.0% rate — not tax advice; consult a CPA.
Schools (NCES district)
- District
- Citrus
- NCES district ID
- 1200270
- Math proficiency
- 49% ▼ -10.00%
- Reading proficiency
- 50% ▼ -6.00%
- Median HH income
- $38,618
- Composite
- 41.28/100
- National rank
- #3519
- State rank
- #44 of 73 in FL
Livability — Crystal River
- Score
- 66/100
- State rank
- #603
- US rank
- #11564
Category grades
Schools grade is shown separately in the Schools card above.
Census & demographics
- City population
- 10,163
- Population (ZIP)
- 9,494
Population outlook (Citrus County) Hauer SSP2
- Today (2025)
- 138,622 people
- By 2030
- 136,886 · -1.3%
- By 2040
- 132,009 · -4.8%
- By 2050
- 125,196 · -9.7%
- By 2075
- 108,570 · -21.7%
- By 2100
- 84,454 · -39.1%
Race, ethnicity, and origin ACS 2023
- Neighborhood character
- Predominantly White (88%)
- Race & ethnicity
- White 88% Black 5% Hispanic / Latino 4% Two or more races 3%
- Common ancestry
- Italian 7% Slovak 2% Lithuanian 2%
- Foreign-born
- 4% · Canada
- Languages at home
- 97% English-only · Spanish 1% Tagalog/Filipino 1%
Political lean MEDSL · Citrus
- 2024 margin
- Solid R (+45.9) · D 26.8% · R 72.6%
- 2008→2024 swing
- -29.8pp toward R · 2008: -16.1pp · 2024: -45.9pp
- All cycles
- 2024: R+45.9 2020: R+41.0 2016: R+39.7 2012: R+21.9 2008: R+16.1
Not yet ingested
- Civics
- —
Market trends
- HPI YoY
- ▼ -58.92%
- Current HPI
- 271.3171
- Rent YoY
- —
- Metro
- —
- State GDP YoY
- ▲ 3.28%
- F500 in state
- 36
Industry mix (Fortune 500 HQ in FL)
| Industry | F500 HQs | Revenue |
|---|---|---|
| Industrial Technology | 2 | $29B |
|
||
| Insurance | 2 | $17B |
|
||
| Retail | 1 | $60B |
|
||
| Technology Distribution | 1 | $58B |
|
||
| Homebuilding | 1 | $35B |
|
||
| Technology Manufacturing | 1 | $35B |
|
||
Price history
-41.5% since first listed14 events — show timeline
- 2026-06-08 Listed $28,000 FSBO.com
- 2022-08-23 Listing Removed — HCAR
- 2022-08-13 Price Changed $169,900 HCAR
- 2022-07-21 Price Changed $179,900 HCAR
- 2022-06-29 Price Changed $189,900 HCAR
- 2022-06-22 Price Changed $199,900 HCAR
- 2022-05-31 Price Changed $209,000 HCAR
- 2022-05-27 Relisted — HCAR
- 2022-05-26 Contingent — HCAR
- 2022-05-18 Price Changed $219,000 HCAR
- 2022-04-26 Relisted — HCAR
- 2022-04-24 Contingent — HCAR
- 2022-04-19 Listed $229,000 HCAR
- 2020-12-22 Sold (Public Records) $47,900 Public Records
Property tax history
+17.5%/yrLatest (2025): $1,944 · +6.1% YoY. Source: county tax records.
Cash-flow waterfall
monthlySold comps — $/sqft
last 12 mo · ≤1 miLoading sold comps…